

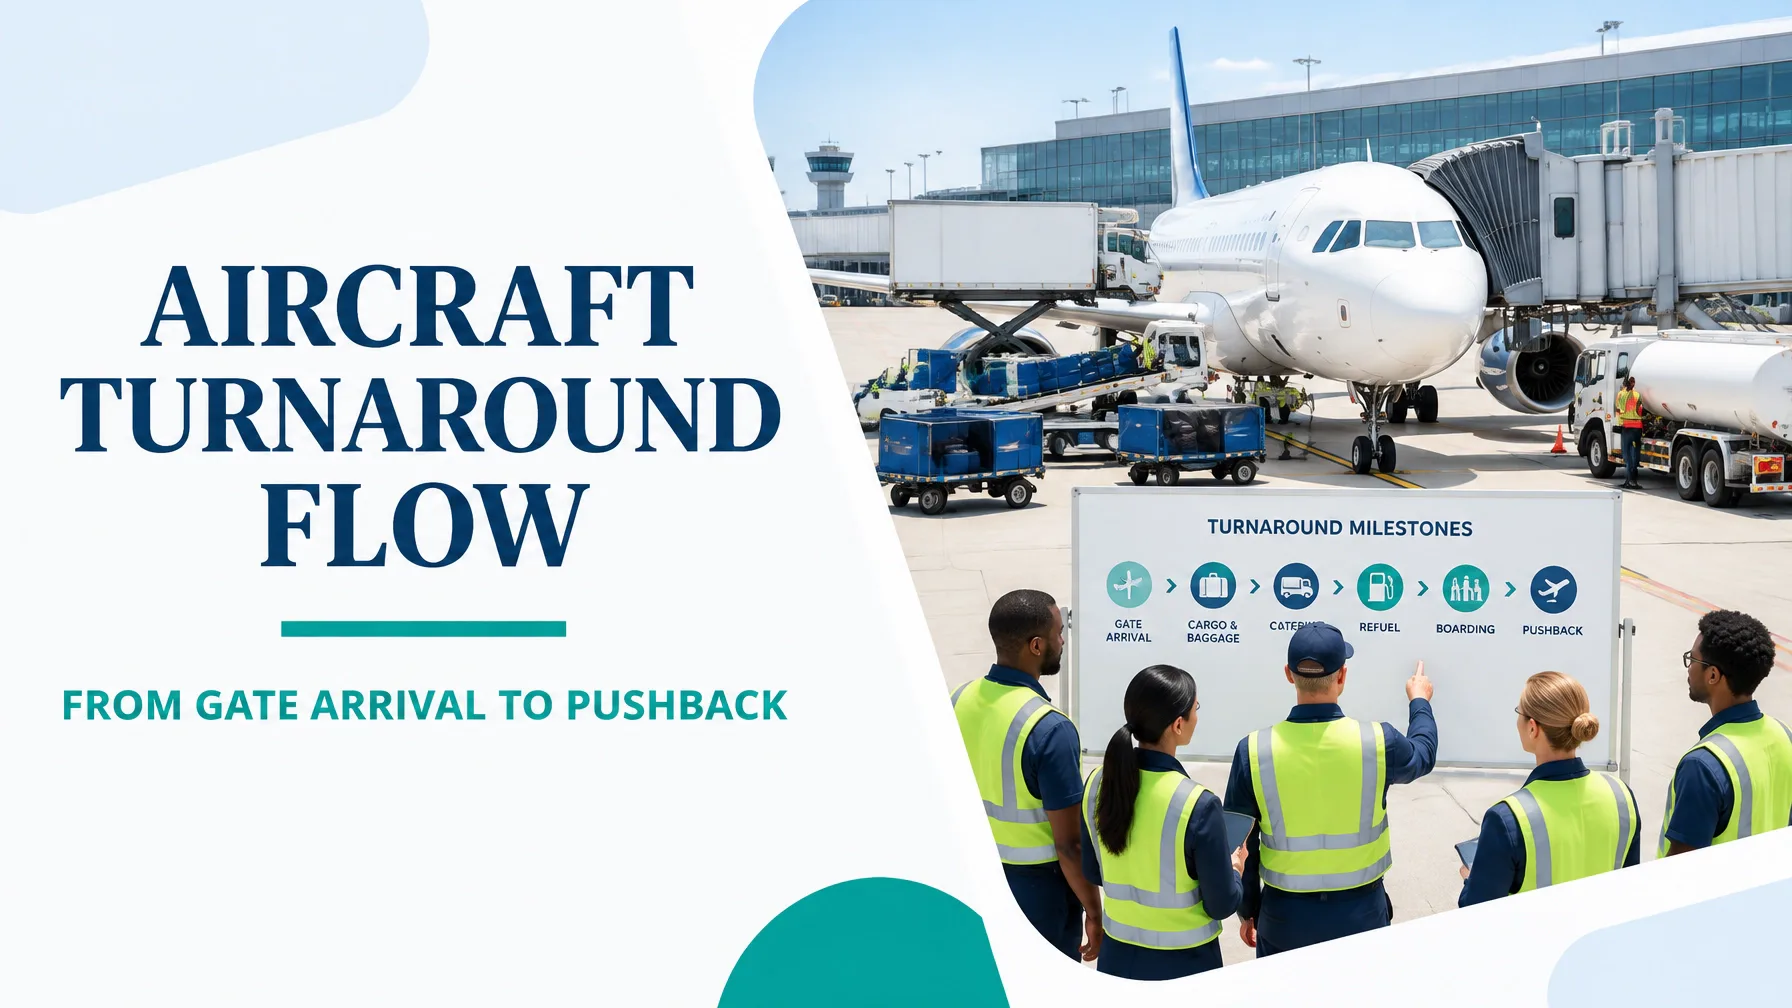
Aircraft turnaround is a tightly coupled service value stream. Passenger movement, cabin preparation, catering, baggage handling, refuelling, boarding, load control and ramp coordination must converge before pushback. When one activity loses time, the impact can propagate through the entire flight rotation.
Value Stream Mapping (VSM) makes that flow visible. It connects physical work, such as baggage offload and catering uplift, with information flow, approvals, handovers and escalation decisions. In the realm of aviation ground handling, this distinction matters because the longest turnaround is not always caused by the task that appears busiest. It is often created by waiting, poor sequencing, duplicate processing and unclear ownership.
This worked example examines 1,240 narrowbody domestic turnarounds per month across three station types. The published turnaround target is 35 minutes, while the actual average is 47.3 minutes. A disciplined future-state design can reduce the turnaround to 33.8 minutes, while improving on-time departure performance from 78% to 92%.
Scope Selection: Why Map Gate Arrival to Pushback?
The scope begins at in-block or gate arrival and ends at pushback.
This boundary is appropriate because it captures the complete ground-handling value stream that determines whether the aircraft is ready for its next scheduled sector. It includes:
- Disembarkation and passenger flow
- Cabin cleaning and readiness
- Catering removal and uplift
- Baggage and cargo offload
- Refuelling
- Boarding and gate processing
- Load control, final checks and pushback readiness
The scope deliberately excludes flight planning, aircraft rotation planning and post-pushback taxi activities. Those processes influence the turnaround, but they belong to adjacent value streams.
The critical-to-quality requirements are clear:
- Depart safely and on schedule.
- Complete cabin, catering and baggage activities correctly.
- Avoid rework, missing items and documentation errors.
- Maintain a predictable flow across station types.
This boundary can be formalised through a Lean Six Sigma project scope and validated with the Voice of the Customer, Voice of the Business and Voice of the Process.

Current-State Map: The Real Flow Behind a 47.3-Minute Turnaround
The current-state process appears to contain many parallel activities. However, timestamped observation shows that only 33.8 minutes of the 47.3-minute average is genuinely sequential work. The remaining time is created by waiting, handovers, conflicts, rework and weak coordination.
A simplified current-state flow is:
In-block → Disembarkation → Baggage offload / cabin clean / catering / refuel → Boarding → Final reconciliation → Pushback
The baseline data is:
| Activity or measure | Current performance | Standard or reference |
|---|---|---|
| Monthly turnarounds | 1,240 | Three station types |
| Average turnaround | 47.3 min | 35.0 min |
| Turnarounds exceeding 45 minutes | 21% | Minimise |
| Disembarkation | 9.4 min | 6.0 min |
| Cabin clean | 14.8 min | 11.0 min |
| Catering uplift | 12.1 min | 8.5 min |
| Galley reconciliation | 3.4 min | Included in catering time |
| Baggage offload | 18.2 min | Primary constraint |
| Refuelling | 16.4 min | Partly overlapping |
| Boarding | 24.6 min | 19.0 min |
| Ground support equipment wait | 3.2 min | Immediate availability |
| Second boarding call or delayed pushback | 8% | Minimise |
| Critical path without named owner | 6.7 min | 0 min |
| Sequential work | 33.8 min | Below 35-minute target |
The baggage offload is the real constraint. Its 18.2-minute average is influenced by the six-belt pier, baggage transportation between piers and the timing of equipment arrival. Refuelling overlaps with other work, but it cannot compensate for a delayed baggage stream or late boarding release.
Boarding also contains a significant process-design issue. 4.1 minutes are lost to a second boarding pass scan at the gate, creating an avoidable queue and compressing the final readiness window.
Quantifying All Eight DOWNTIME Wastes
The DOWNTIME framework provides a practical way to classify the losses. The measurements below are baseline indicators. They should not be added together because several wastes occur simultaneously within the same turnaround.
| Waste | Evidence in the current state | Quantified baseline |
|---|---|---|
| Defects | Unreconciled galleys, missing seat-back items and unrecorded cabin damage create rework or late discovery. | 22% of uplifted meals are returned unopened; 8% require a second boarding call or delayed pushback, signalling exception exposure. |
| Overproduction | Catering is loaded beyond actual consumption. | 22% of uplifted meals return unopened. |
| Waiting | Teams wait for equipment, boarding flow and information. | 3.2 minutes average GSE wait; 4.1 minutes lost to the second scan; 6.7 minutes of critical-path activity has no named owner. |
| Non-utilised talent | Cabin crew spend time on galley counts rather than safety, service and readiness tasks. | 3.4 minutes of galley reconciliation is embedded in aircraft-side catering work. |
| Transportation | Baggage is transferred between piers instead of following a direct, synchronised flow. | One additional inter-pier movement per transferred batch is the baseline count to remove or redesign. |
| Inventory | Catering trolleys and excess meals occupy galley and hold space. | Excess meal inventory equals the 22% unopened-meal rate. |
| Motion | Crew fetch manifests and paperwork during the turnaround. | One additional document-retrieval loop per exception should be counted and eliminated through point-of-use information. |
| Excess processing | Duplicate manifest sign-off and double boarding scans add no customer value. | 4.1 minutes per affected turnaround are attributed to the second scan; duplicate sign-off is an additional transaction to remove. |
In Lean terms, the customer values a safe, clean, correctly catered and on-time departure. Activities that do not contribute to those outcomes are either necessary non-value-added work or pure waste. The objective is not to remove required safety controls. It is to eliminate avoidable duplication and improve the sequence around them.
Future-State Design: Build Flow Around Milestones and Ownership
The future state uses one integrated turnaround plan rather than separate schedules for ramp, cabin, catering and gate teams.

The future-state design has six core changes:
- Appoint one named turnaround coordinator responsible for the critical path.
- Use a five-minute milestone board showing planned, actual and next-due events.
- Pre-position ground support equipment during aircraft approach, rather than waiting until after arrival.
- Run catering and cabin service in parallel, subject to safety and access controls.
- Move galley reconciliation off-aircraft to the catering vehicle.
- Introduce zone boarding with a single scan and a five-minute checkpoint escalation rule.
The coordinator does not replace functional accountability. Instead, the role integrates the work and makes constraints visible early. If a milestone is five minutes late, the coordinator triggers escalation before the delay reaches boarding or pushback.
A future-state map should also include an automatic turnaround debrief for every exceedance. This converts each exception into a learning opportunity rather than allowing the same cause to recur across the next rotation.
Current Versus Future Performance
| Measure | Current state | Future state |
|---|---|---|
| Average turnaround | 47.3 min | 33.8 min |
| Turnarounds exceeding 45 minutes | 21% | 4% |
| On-time departures | 78% | 92% |
| Baggage offload | 18.2 min | 13.6 min |
| Catering uplift | 12.1 min | 7.9 min |
| Boarding | 24.6 min | 20.1 min |
| Unopened meal waste | 22% | 9% |
| Critical path with named owner | 0% | 100% |
The future state achieves the target by improving flow, not by asking teams to work faster without structure. Baggage remains a key constraint, but its reduction from 18.2 to 13.6 minutes releases capacity across the entire turnaround. Catering falls to 7.9 minutes because reconciliation is separated from aircraft-side loading. Boarding improves through zone sequencing and one scan.
This is the practical connection between VSM and the DMAIC framework: Measure the actual flow, Analyse the constraint, Improve the sequence and Control the performance over time.

30/60/90-Day Kaizen Sequencing
Days 1–30: Establish the Baseline
Owners: Station Operations Manager, Continuous Improvement Lead, Baggage Operations Lead
Priorities:
- Observe representative turnarounds across all three station types.
- Create the five-minute milestone baseline.
- Confirm the true critical path using timestamped data.
- Run a detailed baggage offload study.
- Trial ground support equipment pre-positioning during aircraft approach.
- Record waiting, transport, motion and handover events separately.
The first 30 days should focus on facts, not assumptions. A time observation sheet can distinguish work time from queue time and expose variation by station, shift, aircraft type and crew.
Days 31–60: Pilot the Future-State Flow
Owners: Cabin Services Manager, Catering Manager, Gate Manager, Ramp Operations Lead
Priorities:
- Run cabin cleaning and catering in parallel.
- Move galley reconciliation to the catering vehicle.
- Introduce single-scan, zone-based boarding.
- Test a five-minute checkpoint escalation rule.
- Review meal uplift quantities using actual consumption data.
- Reduce baggage transportation between piers through revised staging and handoff rules.
This phase should use controlled pilots. Compare average turnaround, variation, exceedance rate, boarding queue time and defect indicators before expanding the changes across all stations.
Days 61–90: Standardise and Control
Owners: Station Operations Manager, Quality Manager, CI Lead, Operations Control
Priorities:
- Embed the coordinator role into standard work.
- Publish the integrated turnaround plan.
- Automate the exceedance debrief trigger.
- Use control charts for turnaround minutes and on-time departure.
- Review weekly performance by station type.
- Audit adherence to the milestone board, single scan and equipment pre-positioning process.
Control charts are essential because an improved average can conceal unstable performance. The operation needs both a lower mean and predictable variation.
The Leadership Lesson
Aircraft turnaround is not improved by optimising each department in isolation. It is improved by managing the entire value stream (material flow, information flow, approvals, ownership and customer requirements) as one system.
The current state shows that a 47.3-minute average does not mean 47.3 minutes of productive work. It contains parallel activity, constraint-driven waiting, excess processing, poor handovers and unowned critical-path time. VSM converts those observations into a shared operational language and a sequenced improvement plan.
For professionals leading aviation, logistics, healthcare or service operations, this is precisely where advanced Lean Six Sigma capability creates value. A CSSC-accredited Lean Six Sigma certification develops the skills to map processes, analyse variation, lead Kaizen and sustain measurable gains. For complex, cross-functional operations, Lean Six Sigma Black Belt online training provides the deeper capability required to lead data-driven transformation.
Build your Lean Six Sigma certification pathway today through CSSC-accredited training, develop advanced capability with Lean Six Sigma Black Belt online training, and apply Kaizen to your organisation’s most important value streams.
Kaizen. Kai-Care. Kai-Done. Lean Six Sigma.





