

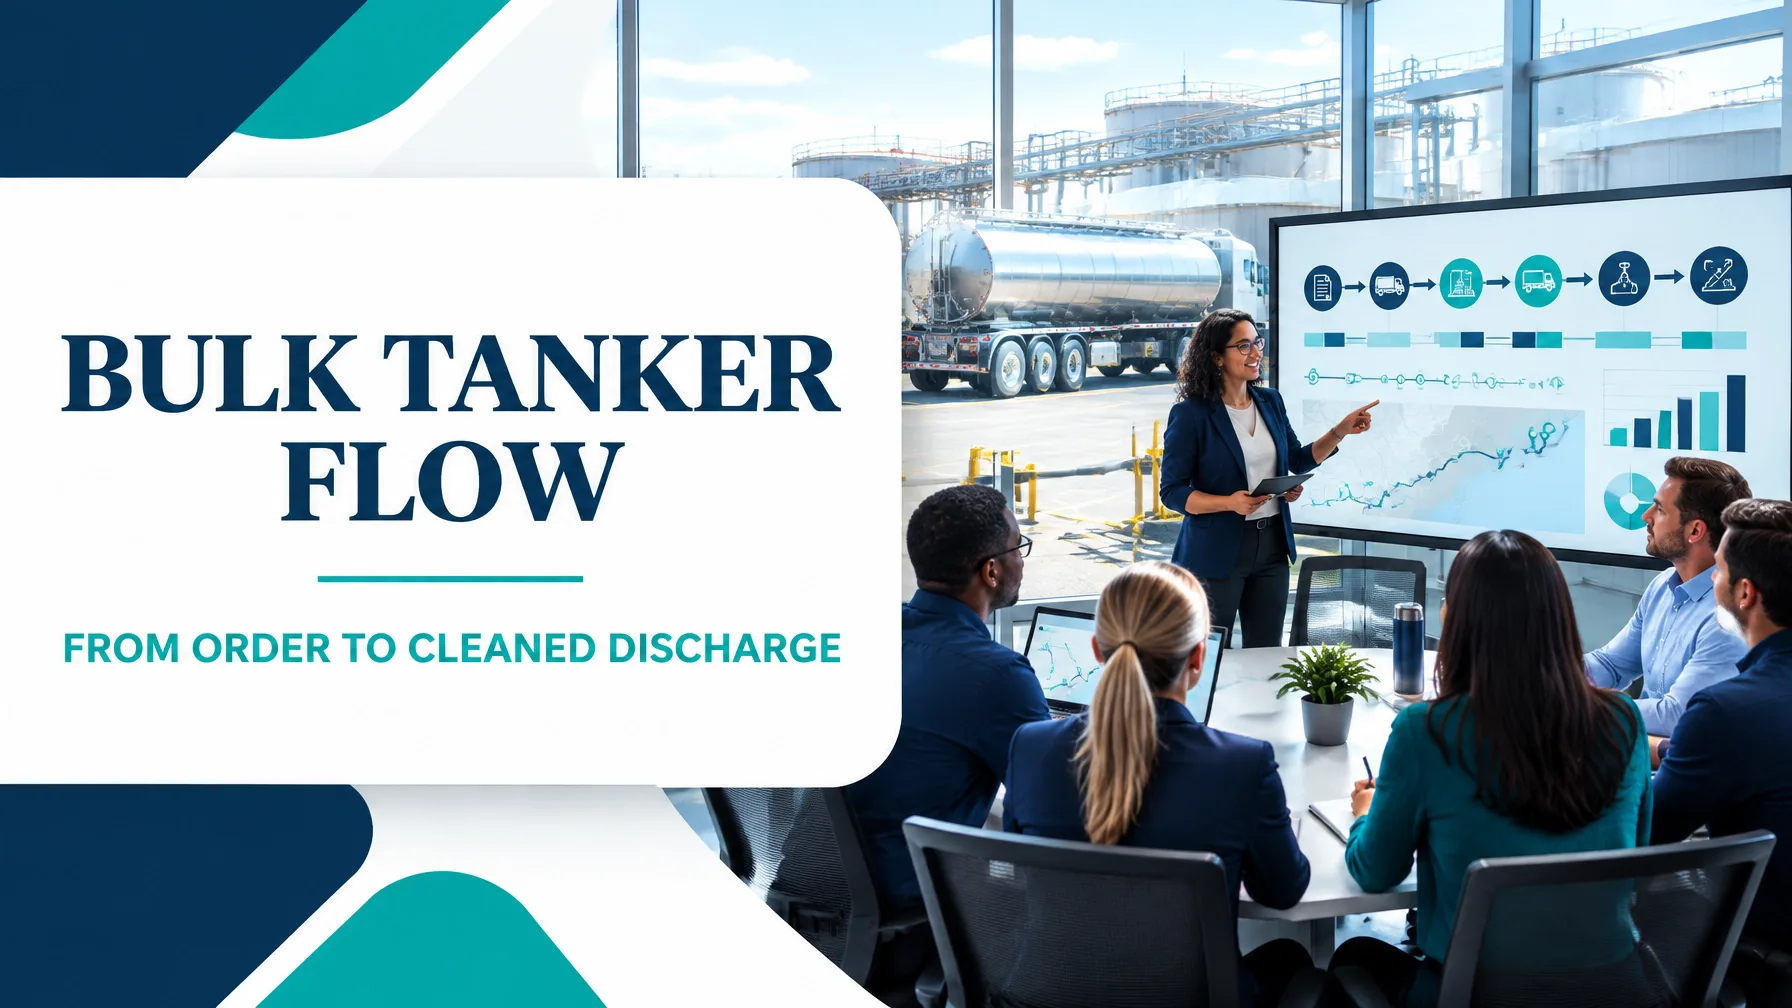
In the realm of bulk liquid logistics, customer value is created when the correct product reaches the correct destination safely, on time, and in specification. However, the tanker itself must also move through a complex network of planning, allocation, loading, transport, discharge, backhaul, inspection, and cleaning before it is ready for the next order.
This makes bulk tanker distribution an ideal environment for Value Stream Mapping (VSM).
VSM visualises the material flow and information flow required to deliver a service from order release to completion. It reveals where tankers, people, documents, product, and decisions wait between process steps. As explained by the Lean Enterprise Institute, a current-state map shows how the process operates today, while a future-state map defines how it should operate.
The following worked case study shows how a bulk liquid distributor can use VSM to reduce wash-bay congestion, improve on-time delivery, and create a more reliable tanker cycle.
Scope Selection: Define the Bulk Tanker Value Stream
A useful VSM begins with a clearly defined product family and scope. Mapping every customer, route, product grade, and cleaning requirement at once creates excessive complexity.
For this case, the selected value stream is:
Bulk liquid tanker loads released from the central depot, delivered to regional customers, discharged, returned, cleaned, and made available for the next load.
The scope includes:
- Order release and customer confirmation
- Load planning and route scheduling
- Tanker allocation and availability checks
- Product compatibility and cleaning-status verification
- Loading and documentation
- Haul to the customer
- Customer-site discharge
- Backhaul or return movement
- Wash-bay queue, cleaning, inspection, and certification
- Tanker status update and release for the next order
The map must include both:
- Material flow: tanker movement, product movement, discharge, return, and cleaning.
- Information flow: orders, transport instructions, safety documentation, delivery confirmation, wash certificates, and tanker-status updates.
This is broader than a process map. A process map may show how loading is performed. A VSM shows how loading connects to planning, customer demand, tanker availability, transport, discharge, and cleaning.

Current-State Map: Where the Wash-Bay Queue Begins
The distributor in this example handles 38 tanker loads per day. Each load travels an average 2,150 km round trip, and current on-time delivery performance is 87%.
The wash bay is the most visible constraint:
- Average wash-bay turnaround: 96 minutes
- Standard cleaning turnaround: 35 minutes
- Loads delayed by cleaning availability: 14%
- Average wash-bay queue: 4.2 tankers
- Average customer-site waiting time before discharge: 95 minutes
A planning team might initially describe the problem as “insufficient wash-bay capacity.” The current-state map provides a more precise diagnosis.
Current Material Flow
Order release → Load planning → Tanker allocation → Loading → 2,150 km round trip → Customer discharge → Backhaul → Wash-bay queue → Cleaning and inspection → Ready tanker
Current Information Flow
Customer order → Transport planning → Loading authorisation → Driver documentation → Proof of delivery → Discharge confirmation → Wash certificate → Tanker status in the transport management system
The data shows that the wash bay is not isolated from the rest of the network. Late order changes, inconsistent tanker-status updates, product-changeover requirements, and uneven arrival patterns all increase its workload.
Worked Current-State Numbers
The current average elapsed time from order release to cleaned tanker availability is approximately:
| Process segment | Touch or travel time | Waiting time |
|---|---|---|
| Order release and confirmation | 20 minutes | 180 minutes |
| Load planning and tanker allocation | 35 minutes | 120 minutes |
| Loading and documentation | 45 minutes | 40 minutes |
| Round-trip haul | 33.1 hours* | – |
| Customer discharge | 55 minutes | 95 minutes |
| Backhaul and depot return | 45 minutes | 60 minutes |
| Wash-bay cleaning and certification | 96 minutes | 75 minutes |
| Final status update | 15 minutes | – |
| Total | Approximately 38.3 hours | 570 minutes |
*Assuming an average road speed and operating pattern equivalent to approximately 33.1 hours of movement for the 2,150 km round trip.
The important insight is not simply that cleaning takes 96 minutes. The larger issue is the combination of:
- 75 minutes of wash-bay waiting
- Unplanned product sequencing
- Incomplete cleaning-status information
- Arrival bunching after customer discharge
- Manual certification and status updates
A tanker can therefore spend longer waiting for cleaning than the cleaning activity itself.
Identify the Eight DOWNTIME Wastes
The eight Lean wastes provide a practical lens for reviewing the map.
1. Defects
Examples include incorrect loading documents, incomplete delivery records, contaminated tanks, failed inspection, and cleaning certificates requiring rework. A single documentation error can prevent a tanker from being released.
2. Overproduction
Planning more tanker capacity or preparing loads before confirmed customer demand creates unnecessary movement and yard congestion. Early loading can also increase product dwell time.
3. Waiting
Waiting appears at order approval, loading bays, customer gates, discharge points, and especially the wash bay. The 96-minute wash-bay turnaround includes both processing and queue-related delay.
4. Non-Utilised Talent
Drivers, dispatchers, wash-bay operators, and planners often understand the recurring causes of delay. If their observations are not included in daily improvement reviews, the organisation loses valuable process knowledge.
5. Transportation
The 2,150 km round trip is operationally necessary, but unnecessary repositioning, empty kilometres, and poorly coordinated backhaul movements increase cost without improving customer value.
6. Inventory
Work in process includes tankers awaiting loading, loaded tankers awaiting dispatch, tankers waiting at customer sites, and empty tanks waiting for cleaning. This inventory conceals flow problems and consumes yard capacity.
7. Motion
Repeated walking to locate paperwork, search for hoses, find inspection equipment, or confirm tanker status adds motion without improving the service.
8. Extra-Processing
Manual re-entry of order information, duplicate approvals, repeated safety checks caused by missing records, and multiple status calls are common forms of extra-processing.
The objective is not to remove necessary safety, quality, or compliance controls. Instead, it is to distinguish essential control from avoidable repetition.
Build the Future State: Flow Before More Capacity
The National Institute of Standards and Technology describes VSM as a method for identifying waste, defining a future state, and implementing improvements through cross-functional teamwork. For bulk tanker distribution, the future state should connect demand, tanker availability, cleaning requirements, and customer discharge slots.
The future-state design includes five changes.
1. Create a Cleaning-Ready Pull Signal
Instead of sending tankers to the wash bay based on arrival sequence alone, planners classify each tanker by:
- Previous product
- Required cleaning standard
- Next assigned product
- Customer loading window
- Certification status
A digital or visual pull signal releases the next tanker to cleaning only when the downstream loading requirement is confirmed.
2. Segment Cleaning by Standard Work
Separate the flow into defined cleaning families, such as:
- Quick rinse
- Standard product change
- Food-grade or high-assurance cleaning
- Specialist or hazardous cleaning
Standard work reduces variation and prevents every tanker from being treated as an individual exception.
3. Level the Arrival Pattern
The operation currently receives tankers in batches after customer discharge. The future state uses planned return windows and staggered wash-bay appointments.
At 38 loads per day, a 19-hour operating window creates a planning takt of:
1,140 available minutes ÷ 38 loads = 30 minutes per load
This does not mean every tanker must be cleaned in exactly 30 minutes. It provides a rhythm for coordinating dispatch, return, cleaning, and loading demand.
4. Introduce a Single Status Record
The transport management system should show one current status for each tanker:
- Allocated
- Loading
- In transit
- Awaiting discharge
- Discharged
- Awaiting wash
- Cleaning
- Inspection pending
- Ready for allocation
This reduces phone calls, duplicate data entry, and incorrect allocation decisions.
5. Establish a Pacemaker Process
The loading schedule becomes the pacemaker: the point where customer demand, tanker readiness, and product sequence are translated into a controlled operating rhythm.
The wash bay then works to a visible, levelled requirement rather than reacting to unpredictable arrivals.
Current State versus Future State
The following targets are realistic improvement objectives for a 90-day pilot. They should be validated against actual operating data before being adopted as permanent standards.
| Metric | Current state | Future-state target |
|---|---|---|
| Daily tanker loads | 38 | 38–40 |
| Average wash-bay turnaround | 96 minutes | 42 minutes |
| Wash-bay standard | 35 minutes | 35–40 minutes by cleaning family |
| Average wash-bay queue | 4.2 tankers | 1.5 tankers |
| Loads delayed by cleaning availability | 14% | 3% |
| On-time delivery | 87% | 96% |
| Customer discharge waiting | 95 minutes | 35 minutes |
| Order-to-cleaned-tanker availability | 38.3 hours | 35.0 hours |
| Manual status updates per load | 6 | 2 |
| Cleaning certificate rework | 8% | 2% |
The future state does not depend on one large equipment purchase. It combines flow control, standard work, visual management, scheduling discipline, and reliable data.
90-Day Kaizen Sequencing Plan
Days 1–15: Confirm the Baseline
- Select one route and product family.
- Observe at least 30 tanker cycles from order release to cleaned discharge.
- Verify wash-bay turnaround using timestamps rather than estimates.
- Measure queue length by hour and cleaning type.
- Confirm the definition of on-time delivery.
- Build the current-state VSM with drivers, planners, terminal staff, wash-bay operators, and customer-service representatives.
Days 16–30: Stabilise the Process
- Create standard work for tanker allocation, wash-bay entry, cleaning, inspection, and certification.
- Introduce a visual board showing tanker status and next required action.
- Separate cleaning types into defined families.
- Remove duplicate paperwork and clarify approval points.
- Establish a daily 15-minute flow review.
Days 31–60: Pilot the Future State
- Launch scheduled wash-bay appointments.
- Test a pull signal based on confirmed next-load demand.
- Stagger tanker returns where operationally possible.
- Introduce a standard digital status update after discharge and cleaning.
- Track turnaround, queue length, delayed loads, on-time delivery, and certificate rework daily.
Days 61–75: Analyse and Adjust
- Compare pilot performance with the baseline.
- Stratify results by product family, shift, customer, cleaning type, and driver route.
- Use control charts to distinguish common-cause variation from special causes.
- Investigate whether the 35-minute cleaning standard is achievable for each cleaning family.
- Resolve exceptions before expanding the pilot.
Days 76–90: Control and Scale
- Finalise the future-state map and control plan.
- Assign process owners for planning, loading, discharge, wash-bay flow, and data accuracy.
- Audit status updates and cleaning certification weekly.
- Add the improved workflow to training and onboarding.
- Expand the method to additional routes only after the pilot sustains its targets.
Turn the Map into Measurable Capability
A VSM is not valuable because it looks comprehensive. It is valuable because it changes decisions.
For bulk liquid tanker distribution, the map should help leaders answer:
- Where does the tanker wait?
- Which information is missing when the wait begins?
- Which cleaning requirements create the greatest variation?
- Which approval or handoff delays the next customer commitment?
- How much capacity is lost to rework, empty movement, and unplanned arrivals?
- Which improvement will increase flow without compromising safety or compliance?
If you want to lead this type of cross-functional improvement, Lean 6 Sigma Hub offers CSSC-accredited, self-paced online Lean Six Sigma certification from White Belt through Master Black Belt. The courses use practical tools, end-to-end case studies, worked examples, dummy data, charts, and full DMAIC project applications so you can learn by doing.
Explore the Lean Six Sigma Green Belt Online Training to build the capability to lead structured improvement projects. For complex logistics networks and enterprise-wide transformation, review the Lean Six Sigma Black Belt Online Training.
Start your CSSC-accredited Lean Six Sigma certification and learn how to convert process data into safer, faster, more reliable flow.
Kaizen. Kai-Care. Kai-Done. Lean Six Sigma





