

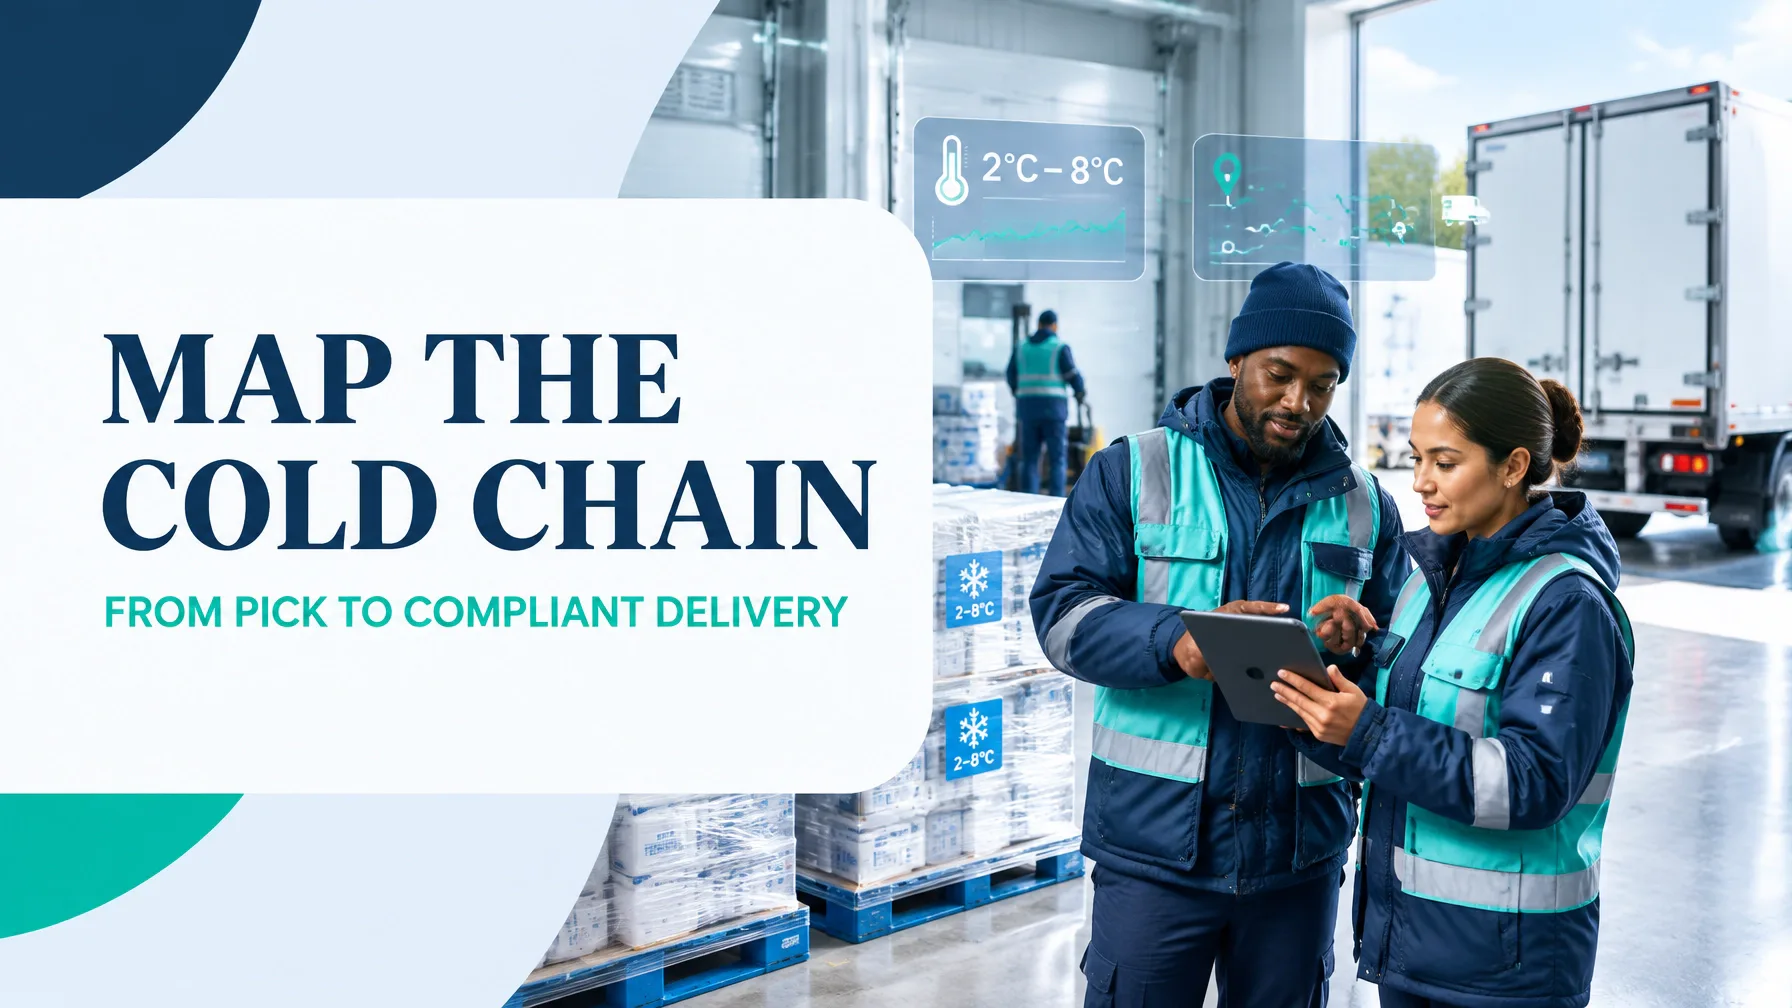
In the realm of temperature-controlled logistics, speed and compliance are inseparable. A chilled pallet is not delivering value simply because it reaches the customer; it must arrive on time, in full, traceable, and within its validated temperature range.
That is why Value Stream Mapping (VSM) applies so effectively to cold chain distribution. It makes the complete flow visible: order release, chilled picking, staging, loading, transport, delivery, documentation, and temperature control. The map shows where time is added, where it is lost, and where exposure risk accumulates.
This deep-guide example uses an illustrative distribution centre supplying 600 chilled pallets per day. The figures are hypothetical but operationally realistic and can be adapted to food, pharmaceutical, healthcare, or specialist grocery distribution.
1. Select the Scope Before Drawing the Map
The map starts at:
Chilled customer order released to the warehouse picking queue
It ends at:
Customer receipt confirmed, temperature record accepted, and delivery closed
This scope is deliberately specific. It includes the warehouse and transport handoffs where temperature excursions are most likely to occur, while avoiding unrelated upstream activities such as supplier production and downstream activities such as customer inventory replenishment.
The scope also follows the customer-facing outcome: a compliant chilled delivery.
Before mapping, establish a cross-functional team involving:
- Warehouse operations
- Picking and replenishment
- Quality assurance
- Transport planning
- Carrier management
- Dock supervisors
- Customer receiving teams
- Finance or commercial analysts
A clear boundary prevents the project from becoming too broad. For further guidance, see our article on how to define and manage project scope.
2. Current-State Map: Where Time and Temperature Risk Accumulate
The baseline below represents one standard chilled distribution lane.
| Process step | Process time | Waiting or dwell | Cold-chain observation |
|---|---|---|---|
| Order release to pick queue | – | 35 min | Orders released in batches |
| Chilled order picking | 18 min | – | Picker travels between three temperature zones |
| QA scan and documentation | 12 min | – | Manual verification and label checks |
| Move to dock staging | 5 min | – | Pallet transferred by forklift |
| Dock staging | – | 68 min | Carrier arrives before all orders are ready |
| Trailer pre-cooling | 45 min | – | Pre-cooling begins after trailer arrival |
| Loading | 22 min | – | Multiple door openings during mixed-route loading |
| Dispatch paperwork and seal | – | 20 min | Paperwork correction creates queue |
| Refrigerated transport | 240 min | – | Standard planned transit |
| Customer receiving queue | – | 30 min | Receiving bay unavailable on arrival |
| Unload and receipt confirmation | 4 min | – | Temperature data reviewed manually |
The elapsed lead time is:
35 + 18 + 12 + 5 + 68 + 45 + 22 + 20 + 240 + 30 + 4 = 499 minutes
That is approximately 8 hours and 19 minutes from order release to completed delivery.
For this example, customer-required process time includes picking, verification, internal movement, loading, transport, and receipt:
18 + 12 + 5 + 22 + 240 + 4 = 301 minutes
Therefore:
PCE = Value-added or customer-required time ÷ Total lead time
PCE = 301 ÷ 499 = 60.3%
This logistics PCE definition treats necessary transport and compliant handling as customer-required flow. Waiting, avoidable staging, paperwork queues, and receiving delays are excluded.

Temperature Exposure Baseline
The current-state study records:
- 600 pallets shipped per day
- Average picking rate: 33 pallets per labour hour
- Dock staging dwell: 68 minutes
- Trailer pre-cool time: 45 minutes
- Total door-open exposure per load: 47 minutes
- Temperature excursions: 9 per 600-pallet day
- Excursion rate: 1.5%
- Product written off: 4 pallets per day
- Average written-off product value: $1,850 per pallet
- Daily write-off value: $7,400
- On-time-in-full delivery: 92%
- Cost per delivered pallet: $38.40
Not every excursion creates a write-off. Product may remain within validated stability limits after quality assessment. However, every event requires investigation, documentation, and disposition. In regulated environments, the cost also includes labour, delayed release, customer communication, and potential reputation damage.
Guidance from the ASHP Cold-Chain Management Resource Guide reinforces the importance of documented monitoring, validated equipment, and defined excursion procedures.
3. Eight Wastes in the Cold Chain
The DOWNTIME framework helps translate observations into improvement opportunities.
| Waste | Cold-chain observation |
|---|---|
| Defects | Incorrect labels, incomplete temperature records, and excursion investigations |
| Overproduction | Picking pallets before carrier confirmation or customer demand is final |
| Waiting | Pallets wait 68 minutes in staging and 30 minutes at customer receiving |
| Non-utilised talent | Experienced operators spend time searching for paperwork or chasing carrier updates |
| Transportation | Pallets are moved from cold storage to temporary staging and then repositioned |
| Inventory | Excess work in process accumulates at the dock before trailer readiness |
| Motion | Pickers and forklift operators travel repeatedly between zones and loading positions |
| Extra-processing | Duplicate temperature checks, manual data entry, and corrected dispatch documents |
The most important insight is that these wastes overlap. For example, a late carrier creates waiting, increases inventory in process, generates additional motion, and increases temperature exposure.
A VSM should therefore show both time and risk. The highest-priority problem is usually not the slowest individual activity; it is the step where delay and temperature vulnerability intersect.
4. Analyse the Root Causes
The Analyse phase should combine visual and statistical evidence rather than relying on assumptions.
Useful analyses include:
- Pareto analysis of excursion locations, such as staging, loading, transport, and customer receiving.
- Time observation sheets recording every pallet’s removal time, staging start, loading start, trailer closure, and receipt.
- Box plots comparing dock dwell by shift, carrier, weekday, and temperature class.
- ANOVA to test whether average staging dwell differs significantly between shifts or carrier groups.
- Fishbone analysis covering people, methods, equipment, materials, measurement, and environment.
- Correlation analysis between door-open minutes and excursion events.
- Control charts for staging dwell, door-open duration, and temperature deviation.
Suppose the data shows that the afternoon shift has an average staging dwell of 82 minutes, compared with 51 minutes on the morning shift. A further comparison identifies that 64% of afternoon loads arrive before picking is complete. The root cause is not simply “slow picking”; it is a mismatch between carrier appointments, order release timing, and pick completion.
5. Future-State Design: Build Flow Around Temperature Control
The future-state map should reduce both elapsed time and exposure risk.
Design change 1: Synchronise order release and carrier appointments
Replace large batch releases with appointment-linked release windows. Orders are released 60 minutes before the confirmed loading slot, with a smaller final release for late changes.
Design change 2: Establish direct-flow chilled lanes
Create clearly marked lanes for:
- 2–8°C product
- Frozen product
- Controlled room-temperature product
- Quality hold or exception product
Where operationally suitable, move completed pallets directly from chilled picking to the loading position instead of placing them in general staging.
Design change 3: Pre-cool trailers before arrival at the dock
The future standard requires the trailer to reach the validated loading temperature before docking. A digital appointment status confirms “pre-cooled and ready” before the first pallet leaves controlled storage.
Design change 4: Set a dock-dwell limit
Set a standard of 15 minutes maximum staging dwell for chilled pallets. An Andon-style visual alert is triggered at 10 minutes, escalating to the dock supervisor at 15 minutes.
Design change 5: Reduce door-open exposure
Use load sequencing, a single loading team, sealed pallet manifests, and a door timer. The target is to reduce exposure from 47 minutes to 18 minutes per load.
Design change 6: Digitise temperature and dispatch confirmation
Use a calibrated data logger or real-time monitoring device linked to the shipment record. The system records:
- Product temperature
- Trailer temperature
- Door-open duration
- Seal time
- Delivery receipt
- Exception status
This reduces duplicate checks while preserving traceability. For additional cold-chain context, review best-practice guidance on reducing temperature excursions.

6. Current State Versus Future State
| Metric | Current state | Future-state target |
|---|---|---|
| Total lead time | 499 min | 362 min |
| Customer-required process time | 301 min | 281 min |
| PCE | 60.3% | 77.6% |
| Dock staging dwell | 68 min | 10 min |
| Door-open exposure | 47 min | 18 min |
| Temperature excursion rate | 1.5% | 0.33% |
| Temperature excursions per 600 pallets | 9 | 2 |
| On-time-in-full | 92% | 98% |
| Cost per delivered pallet | $38.40 | $34.90 |
| Daily write-off value | $7,400 | $1,850 |
The future state does not attempt to eliminate necessary cold-chain activities. It removes avoidable waiting, duplicate handling, and uncontrolled exposure while protecting the compliance requirements that define customer value.
7. A 90-Day Kaizen Sequence
Improvement should be sequenced rather than launched as a collection of disconnected actions.

Wave 1: Days 1–30, Measure and stabilise
Owners: Warehouse Manager, Quality Manager, Transport Planner
Actions:
- Confirm the current-state map with direct observation.
- Start recording staging dwell and door-open minutes by pallet.
- Standardise excursion definitions and escalation rules.
- Create temperature-class staging zones.
- Establish a daily 15-minute performance review.
Targets:
- 95% data completeness
- Baseline confirmed across at least 20 operating days
- 10% reduction in average dock dwell
- No undocumented temperature events
Wave 2: Days 31–60, Pilot the flow
Owners: Operations Improvement Lead, Dock Supervisor, Carrier Manager
Actions:
- Pilot appointment-linked order release on one major route.
- Require trailer pre-cooling before docking.
- Introduce load sequencing and digital seal confirmation.
- Install visual dwell alerts at 10 and 15 minutes.
- Test direct flow for selected high-volume chilled SKUs.
Targets:
- Dock dwell below 20 minutes
- Door-open exposure below 25 minutes
- OTIF above 96%
- Excursion rate below 0.7%
Wave 3: Days 61–90, Control and scale
Owners: Black Belt or Continuous Improvement Lead, Quality Governance Owner, Site Director
Actions:
- Validate the pilot using before-and-after data.
- Confirm that packaging and transport controls remain suitable.
- Implement control charts for dwell, temperature, and OTIF.
- Update standard work and training.
- Expand the design to additional routes and temperature classes.
Targets:
- Dock dwell at or below 15 minutes
- Door-open exposure at or below 18 minutes
- Excursion rate at or below 0.33%
- OTIF at or above 98%
- Cost per delivered pallet at or below $34.90
Build the Capability to Improve Cold Chain Performance
A cold chain VSM is more than a diagram. It is a structured way to connect customer requirements, process data, compliance controls, and financial outcomes.
A trained Green Belt can lead the measurement, root-cause analysis, pilot design, and daily improvement cadence. A Black Belt can manage the complex cross-functional programme, validate statistical conclusions, coach Green Belts, and establish control across sites and carriers.
Explore Lean Six Sigma Green Belt online training or Lean Six Sigma Black Belt online training through Lean 6 Sigma Hub. Our self-paced courses are CSSC-accredited and built around practical application, worked examples, tools, and end-to-end DMAIC thinking.
Start your Green Belt or Black Belt certification journey today and learn how to turn cold-chain variation, waiting, and excursion risk into measurable operational control.
Kaizen. Kai-Care. Kai-Done. Lean Six Sigma





