

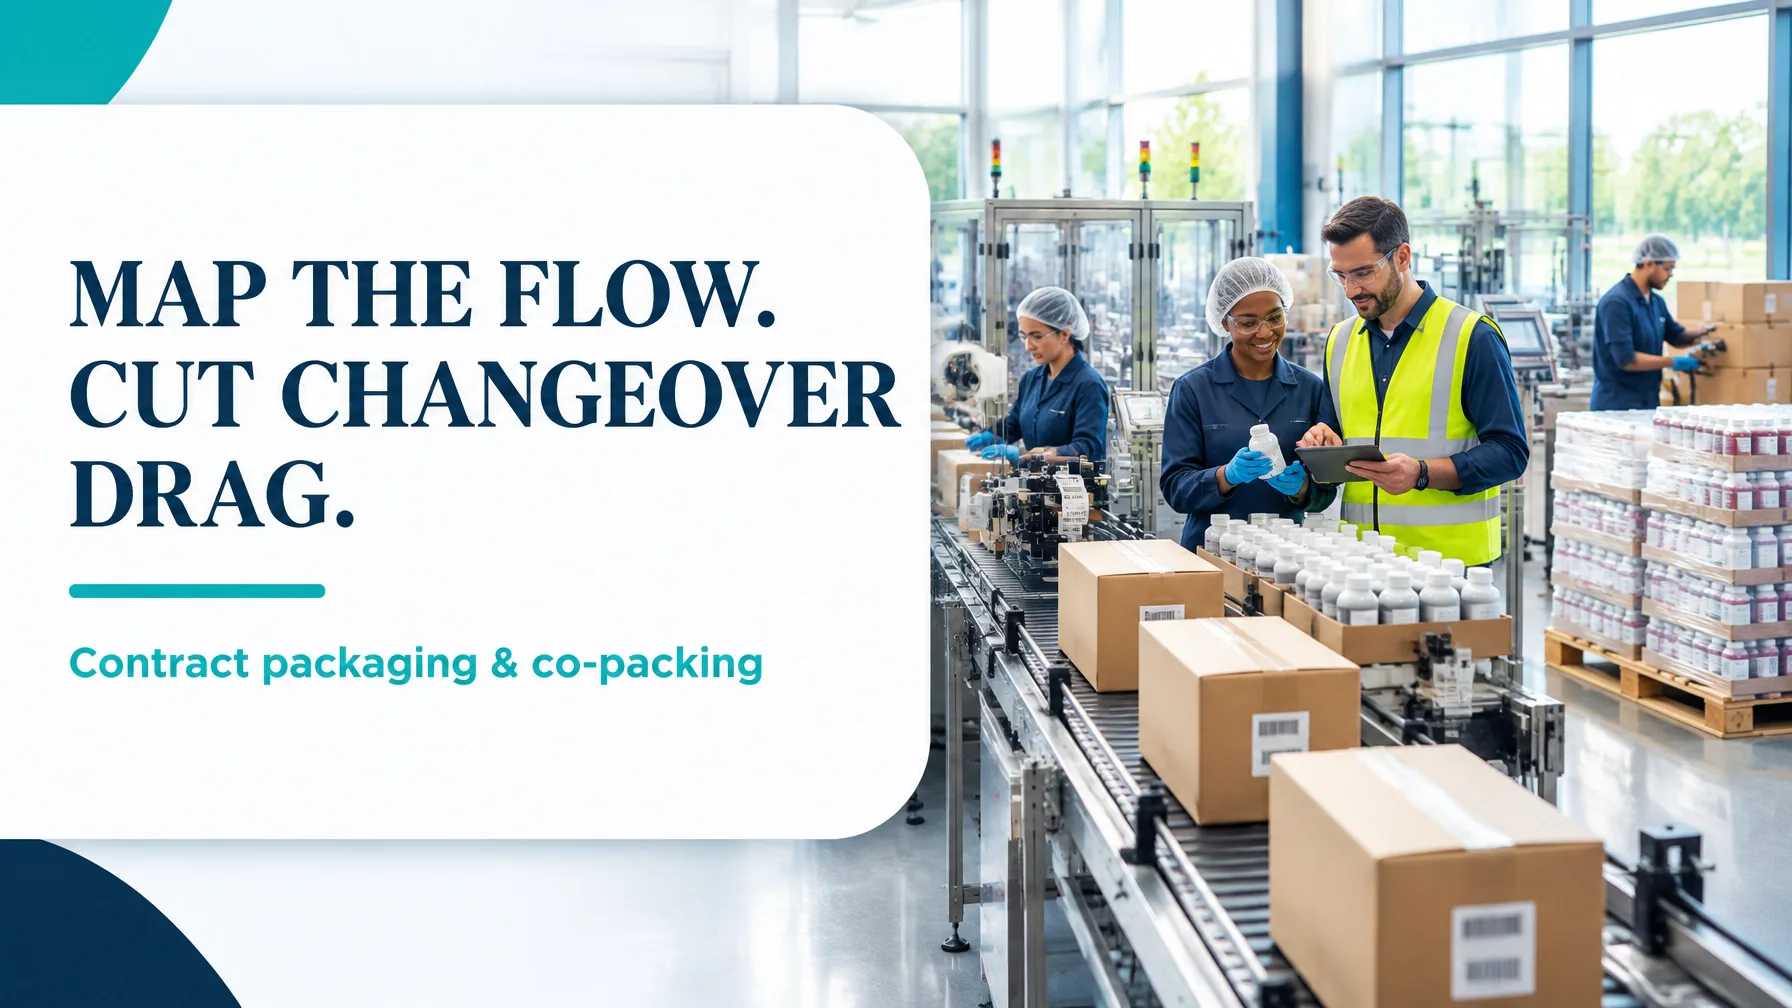
Contract packaging and co-packing operations must deliver reliable quality across multiple customers, formats and SKUs, often using the same filling, sealing, coding, labelling and palletising equipment.
That combination creates a difficult operating environment. A line may appear busy throughout the day while customer orders still experience long queues, frequent interruptions, excess work in process and delayed release. The fundamental purpose of Value Stream Mapping (VSM) is to make that entire system visible: material flow, information flow, waiting, approvals, inventory, quality checks and changeovers.
For a co-packer running 38 SKUs across four shared lines, VSM provides a practical way to see why a 12,500-unit run can consume substantially more elapsed time than the actual packaging work requires, and how to redesign the flow without sacrificing compliance or customer responsiveness.
1. Select the right value-stream scope
A useful map must be broad enough to expose the real sources of delay, but focused enough to support action.
For this example, the scope runs from:
Customer order and artwork approval → component receipt → line preparation → packaging → QA release → palletised finished goods at the despatch dock
The brief operating flow contains seven distinct control points, which can be grouped into six operating zones if necessary:
- Order and artwork approval
- Component and packaging material receipt
- Line setup and changeover
- Filling, sealing and coding
- Labelling, inspection, secondary packaging and palletising
- QA release and despatch
Do not begin by drawing a theoretical process. Walk the floor, review production records and follow one SKU from order entry to shipment. Capture:
- Average run size and demand frequency
- Changeover time by product family
- Component and finished-goods inventory
- Cycle time and staffing
- Downtime, minor stops and speed losses
- Scrap, rework and quality holds
- Artwork, customer and QA approval delays
- Information handoffs between planning, customer service, quality and production
The Lean Enterprise Institute’s VSM guidance describes this as mapping the material and information flows needed to bring a product from order to delivery. That distinction matters: a packaging line can be technically capable while the wider value stream remains slow.

2. Worked current-state example: where the time disappears
Assume the co-packer has:
- 38 active SKUs
- 4 shared packaging lines
- 12,500 units average run size
- 96-minute average changeover
- 61% OEE
- 4.2% line scrap
- 5.8 calendar days order-to-despatch lead time
- PCE below 9%
A representative current-state map may show the following:
| Process point | Typical observation | Primary delay or loss |
|---|---|---|
| Order and artwork approval | 1.4 days elapsed | Waiting for customer artwork sign-off and revision control |
| Component receipt and staging | 0.8 days elapsed | Labels, cartons or closures not synchronised with the schedule |
| Line setup and changeover | 96 minutes | Searching, cleaning, format-part adjustment and first-off checks |
| Filling and sealing | 2.4 seconds per unit | Stops caused by component variation and seal contamination |
| Coding, labelling and inspection | 3.1 seconds per unit | Code verification, label alignment and inspection holds |
| Secondary packaging and palletising | 0.7 days elapsed | WIP accumulation and unbalanced downstream work |
| QA release and despatch | 1.5 days elapsed | Batch-record review, approval queues and dock scheduling |
The packaging work itself may represent approximately 640 minutes of value-added activity. If the total lead time is 5.8 calendar days, or 8,352 elapsed minutes, then:
[
PCE = \frac{640}{8,352} \times 100 = 7.7%
]
That is consistent with a PCE below 9%. In other words, more than 92% of elapsed time is consumed by waiting, movement, queueing, approvals, inspection, storage or other non-value-added activity.
The map should also show where work in process accumulates. For example, 12,500 units may be completed at filling but wait for coding verification, or finished cases may wait for QA release even though the pallet is physically complete.
3. Identify all eight DOWNTIME wastes
A packaging-line VSM should make the eight wastes visible rather than treating them as generic manufacturing problems.
- Defects: Seal contamination, incorrect coding, misapplied labels, damaged cartons and pallet configuration errors.
- Overproduction: Producing short-dated stock ahead of confirmed demand or running a long campaign to avoid a changeover.
- Waiting: Delays for artwork sign-off, components, QA approval, maintenance support or a despatch slot.
- Non-utilised talent: Operators spending their expertise searching for change parts or manually reconciling avoidable paperwork.
- Transportation: Repeated movement of labels, cartons, film and finished pallets between storage and the line.
- Inventory: Excess packaging components, quarantined stock, WIP between operations and finished goods awaiting release.
- Motion: Walking to collect tools, retrieve labels, locate specifications or obtain signatures.
- Extra-processing: Duplicate inspections, repeated data entry, unnecessary relabelling and manual checks created by unclear standards.
A useful Affinity Diagram can group observations by natural relationships, for example, “approval delays,” “material readiness,” “changeover losses” and “quality-at-source.” This converts a large volume of shop-floor ideas into improvement themes that can be prioritised.
4. Use takt time and line balancing to design the future state
Takt time establishes the production rhythm required by customer demand:
[
\text{Takt Time} = \frac{\text{Available Production Time}}{\text{Customer Demand}}
]
Suppose a product family requires 50,000 units per week. With one line operating 7.5 productive hours per day for five days:
[
\text{Takt} = \frac{5 \times 7.5 \times 3,600}{50,000}
= 2.7 \text{ seconds per unit}
]
If filling and sealing operates at 2.4 seconds but coding and labelling requires 3.1 seconds, the downstream operation becomes the bottleneck. The future-state design may balance work by:
- Moving selected inspection tasks upstream.
- Reducing manual label verification through validated vision inspection.
- Adding parallel labelling capacity during peak demand.
- Setting a controlled supermarket between operations where continuous flow is not yet practical.
- Scheduling the pacemaker process to a levelled mix rather than releasing large batches.
The NIST Manufacturing Extension Partnership explains that VSM supports future-state design and provides a basis for tools such as continuous flow, Kanban and setup reduction.
5. Apply SMED to remove the line changeover drag
At 96 minutes, changeover is likely one of the largest constraints on a high-mix co-packing operation. **SMED, Single-Minute Exchange of Die, ** begins by separating internal work, which requires the line to stop, from external work, which can be completed while the line is running.
Externalise activities such as:
- Pre-staging verified labels, cartons, film and closures
- Preparing and checking format-part kits
- Printing the next job documentation
- Pre-cleaning accessible equipment
- Confirming artwork and coding specifications before the line stops
- Assigning clear roles for production, maintenance and quality
Then standardise the remaining internal work with visual positions, quick-release fixtures, centreline settings, a timed checklist and a first-off approval protocol.
A realistic future-state target might reduce average changeover from 96 minutes to 24 minutes. That releases 72 minutes per changeover. Across four lines and six weekly changeovers per line, this represents:
[
72 \times 4 \times 6 = 1,728 \text{ minutes}
]
That is 28.8 hours of additional weekly capacity before considering any OEE improvement.

6. Compare the current and future states
The following future-state targets are illustrative. They should be validated through a pilot, measurement-system checks and controlled implementation.
| Metric | Current state | Future-state target |
|---|---|---|
| Order-to-despatch lead time | 5.8 days | 3.2 days |
| Average changeover | 96 minutes | 24 minutes |
| OEE | 61% | 74% |
| Line scrap | 4.2% | 1.8% |
| First Pass Yield | 94.6% | 98.2% |
| Process Cycle Efficiency | 7.7% | 22% |
The improvement does not come from one isolated action. It comes from connecting several mechanisms:
- SMED reduces setup loss.
- Takt and line balancing align capacity with demand.
- Andon provides immediate visual signalling when a line encounters a problem.
- Autonomation, or Jidoka, enables equipment to detect abnormal conditions and stop or alert the team before defects multiply.
- Standardised artwork approval reduces information-flow delay.
- QA-at-source reduces release queues.
- A controlled pull system prevents excess WIP and overproduction.
7. A practical 90-day kaizen sequence

Days 1–30: Stabilise and measure
- Confirm the product family and map the complete current state.
- Validate cycle time, changeover, scrap, FPY and OEE definitions.
- Create a standard artwork and approval workflow.
- Establish material-readiness checks before line release.
- Use a daily Pareto of downtime, defects and waiting.
- Confirm measurement reliability for seal quality, coding and label inspection.
Days 31–60: Reduce changeover and rebalance work
- Film two complete changeovers from the operator’s perspective.
- Separate internal and external tasks.
- Build standard changeover kits and visual work instructions.
- Establish centreline settings for each format family.
- Rebalance coding, labelling and inspection against takt.
- Pilot Andon escalation rules and first-off approval at the line.
Days 61–90: Create pull and control the gains
- Select the pacemaker process.
- Introduce levelled scheduling by product family.
- Set maximum WIP quantities between key operations.
- Create a small finished-goods supermarket for controlled release.
- Link QA release to a standard digital or visual checklist.
- Review OEE, scrap, FPY, lead time and PCE weekly.
- Document the control plan and assign process ownership.
Turn the map into capability
Value Stream Mapping is not simply a drawing exercise. It is a structured way to connect customer demand, production capacity, quality governance and improvement priorities.
For a co-packer, the strongest results come when planning, customer service, quality, maintenance, warehouse and line operators build the map together. The cross-functional view exposes delays that are invisible when each department optimises only its own activity.
If you want to lead this type of transformation, Lean 6 Sigma Hub’s online Lean Six Sigma training provides a self-paced pathway from foundational concepts to advanced project leadership. The Green Belt programme is particularly relevant for professionals who need to analyse process data, facilitate kaizen activity and deliver measurable operational improvements.
Build the capability to map value, reduce changeover loss and lead measurable improvement, pursue Lean Six Sigma certification with Lean 6 Sigma Hub.
Kaizen. Kai-Care. Kai-Done. Lean Six Sigma.





