

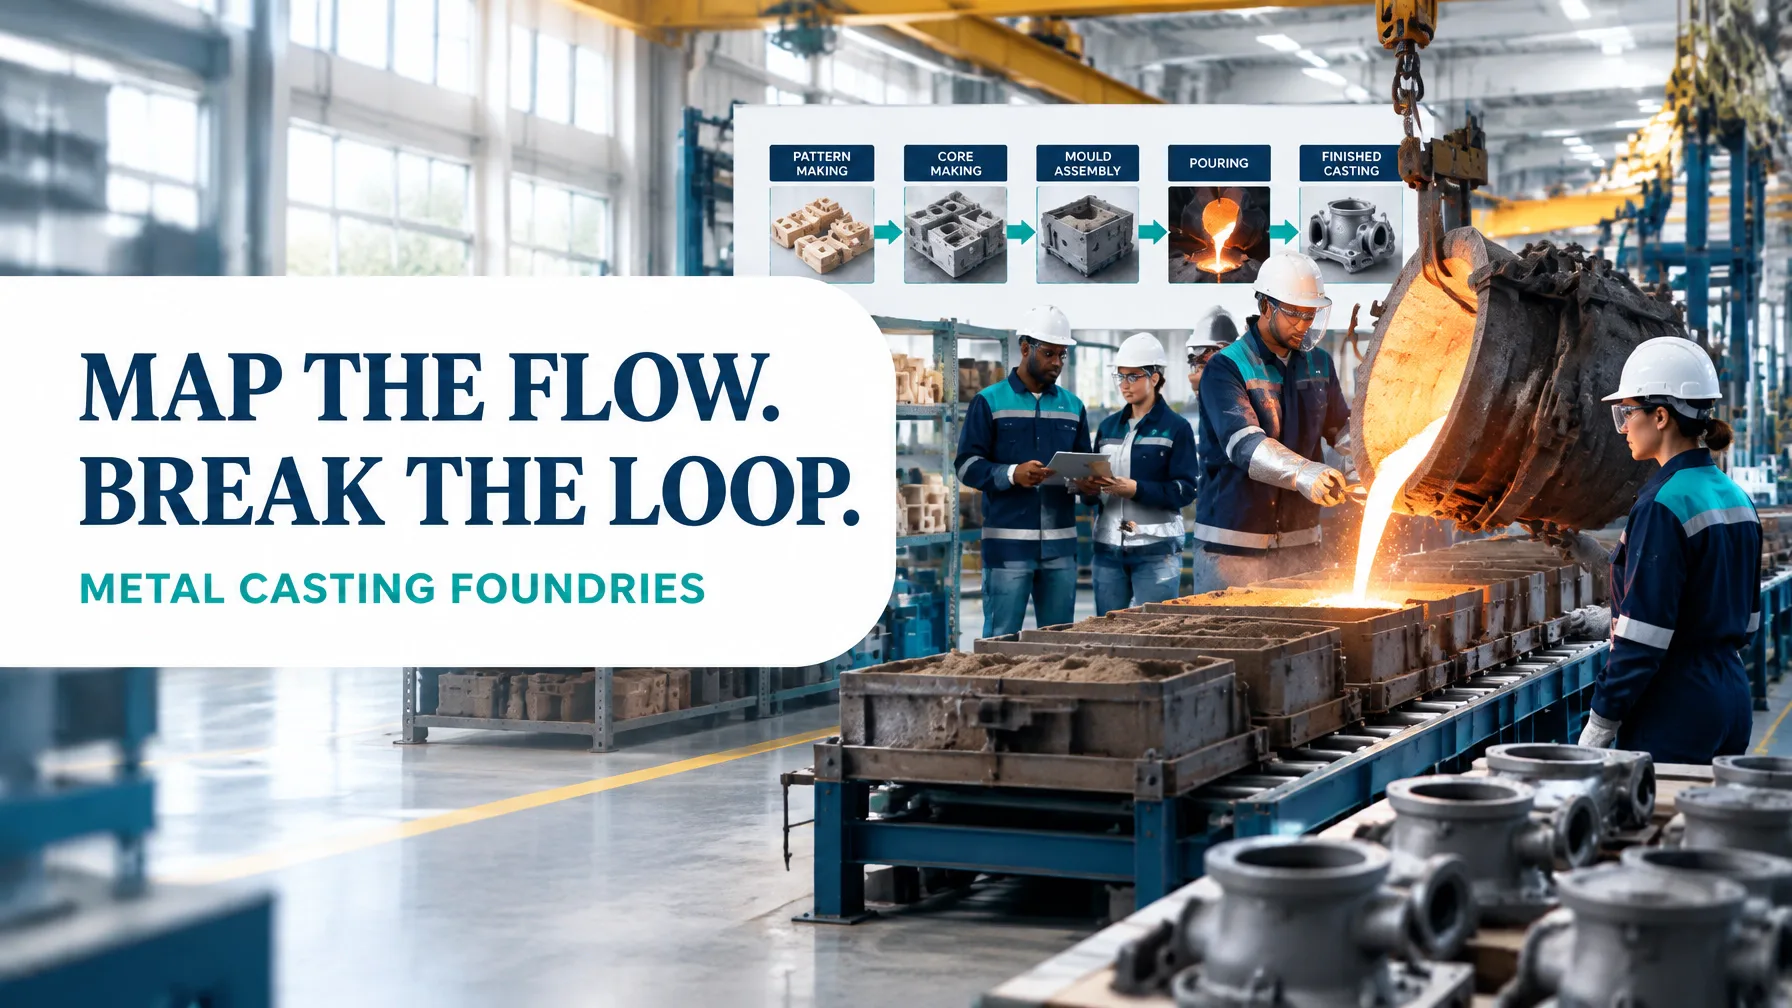
In the realm of metal casting, value stream performance depends on more than the speed of a single machine. A foundry must coordinate molten metal, sand moulds, cores, castings, furnace capacity, skilled labour and customer information across a connected system.
Value Stream Mapping (VSM) makes that system visible. It shows both:
- Material flow: pattern release, core making, moulding, melting, pouring, cooling, shakeout, fettling, heat treatment, inspection and dispatch.
- Information flow: customer orders, production release, pattern and core-box availability, heat schedules, inspection feedback and dispatch priorities.
This distinction matters because a casting may spend only minutes being transformed while waiting hours or days for a furnace slot, rework decision, dimensional check or shipment. A foundry VSM exposes those queues and connects them to scrap, rework, lead time and delivery performance.
The following worked example uses a hypothetical ductile iron jobbing foundry. The figures are realistic planning assumptions rather than universal benchmarks. Your own current-state map must be based on observed data.
1. Define the Value Stream and Its Boundary
For this example, the mapping boundary begins at pattern release and core making and ends when conforming castings are packed and dispatched.
In scope
- Pattern availability and release
- Core-box setup and core making
- Sand preparation and moulding
- Furnace charging, melting and metal treatment
- Pouring
- Cooling
- Shakeout
- Fettling and grinding
- Heat treatment
- NDT and dimensional inspection
- Packing and dispatch
For die casting, the same logic applies, although the process boxes would normally include die setup, holding furnace, shot cycle, trimming, machining and surface treatment.
Outside scope
The following activities remain outside the primary map but should be noted as upstream or downstream interfaces:
- Product design and pattern engineering
- Supplier purchasing and raw-material qualification
- Customer installation and field performance
- Long-term maintenance projects
- Finance, invoicing and commercial negotiation
The scope should be narrow enough to support action but broad enough to capture the scrap and rework loop. Excluding inspection feedback, furnace scheduling or pattern availability would produce a technically neat map that cannot explain delivery performance.

2. Current-State Map: Worked Foundry Example
The foundry produces 45 tonnes of ductile iron castings per week, operating five days per week. Average finished casting mass is approximately 7.5 kg, equivalent to:
- 45,000 kg ÷ 7.5 kg = 6,000 castings per week
- 6,000 ÷ 5 days = 1,200 castings per day
The plant operates two shifts. After planned breaks and routine meetings, available production time is 900 minutes per day.
Takt time
[
\text{Takt time}=\frac{\text{Available production time}}{\text{Customer demand}}
]
[
900\text{ minutes} \div 1,200\text{ castings}=0.75\text{ minutes}
]
The required customer rhythm is therefore 0.75 minutes, or 45 seconds, per casting.
Current-state process data
| Process | Observed data | Current condition |
|---|---|---|
| Core making | 3.8 min per core set | Four machines; average 2.5-hour queue |
| Moulding line | 0.55 min per mould | 45-minute pattern changeover |
| Melting | 2.5-tonne furnace batch; 95-minute batch cycle | 18 batches per week |
| Pouring | 75 moulds per hour average | Moulds frequently wait for metal |
| Cooling | 6–10 hours | Average 8-hour cooling queue |
| Shakeout | 0.7 min per casting | Batch release creates uneven flow |
| Fettling/grinding | 4.2 min per casting | Primary capacity constraint |
| Heat treatment | 6-hour batch cycle | Average 18-hour wait before loading |
| NDT and inspection | 2.5 min NDT; 1.5 min dimensional check | 3.2-hour average queue |
| Furnace changeover | 70 minutes per alloy or grade change | Weekly schedule disruption |
Fettling bottleneck arithmetic
The fettling area has six operators or benches, each with 900 available minutes per day.
[
6 \times 900=5,400\text{ available minutes per day}
]
At 4.2 minutes per casting:
[
1,200 \times 4.2=5,040\text{ required minutes per day}
]
The nominal loading is:
[
5,040 \div 5,400=93.3%
]
However, rework adds approximately 160 minutes per day. The effective requirement becomes 5,200 minutes, pushing loading to approximately 96.3%. Minor stops, tool searches and absenteeism therefore create a predictable queue before heat treatment.
Melt utilisation
The foundry melts approximately 47.7 tonnes per week to produce 45 tonnes of poured castings.
[
45 \div 47.7 \times 100=94.3%
]
The remaining 5.7% represents furnace heel, dross, transfer loss, runners, process loss and metal that does not become shipped product. Some runner metal is recyclable, but it still consumes energy and handling capacity.
Scrap and rework profile
The total current scrap rate is 6.4%. A quality filter added to the VSM attributes losses as follows:
| Operation | Scrap contribution | Typical defect |
|---|---|---|
| Core making and moulding | 1.1% | Core shift, mould damage, dimensional variation |
| Melting and pouring | 2.4% | Porosity, inclusions, misruns |
| Shakeout and fettling | 1.5% | Handling damage, excess grinding, cracks |
| Heat treatment | 0.6% | Hardness outside specification |
| Inspection and dimensional release | 0.8% | Non-conforming dimensions |
| Total | 6.4% | – |
A further 5.3% of castings enter rework, with porosity repair accounting for 3.2% and dimensional correction accounting for 2.1%. Rework does not always become scrap, but it consumes fettling, welding, inspection and supervisory capacity.
Lead time, value-added time and PCE
A typical order requires 6.5 days from release to dispatch. That equals approximately 9,360 minutes of elapsed time.
The observed value-added processing time per casting is approximately:
- Core making: 3.8 minutes
- Moulding and pouring allocation: 1.0 minute
- Shakeout: 0.7 minute
- Fettling: 4.2 minutes
- Heat-treatment allocation: 0.35 minute
- Inspection: 1.2 minutes
- Packing: 0.8 minute
Total value-added time: 12.05 minutes
[
\text{PCE}=\frac{12.05}{9,360}\times100=0.129%
]
The foundry is therefore spending less than 0.2% of order lead time on direct transformation. The remainder is waiting, queueing, movement, batching, inspection delay and rework. Use the Process Cycle Efficiency Calculator to structure this calculation with observed step data.
3. The Eight DOWNTIME Wastes in a Foundry
The DOWNTIME framework translates the map into practical observations:
- Defects: Porosity, sand inclusions, misruns, cracks and dimensional non-conformance create scrap and rework loops.
- Overproduction: Castings poured ahead of available heat-treatment capacity accumulate in cooling and staging areas.
- Waiting: Moulds wait for molten metal, castings wait for the furnace, and inspection queues wait for specialist availability.
- Non-utilised talent: Skilled moulders and fettlers spend time correcting recurring defects instead of improving standard work and process capability.
- Transportation: Moulds and castings travel between core, moulding, shakeout, fettling, heat treatment and inspection bays.
- Inventory: Work-in-process moulds, cooling castings, runners and unreleased batches conceal flow problems.
- Motion: Operators walk for sand, gauges, grinding wheels, PPE and hand tools.
- Extra processing: Unnecessary grinding, repeated inspection and duplicate documentation add cost without increasing customer value.
A VSM should show these wastes beside their measurable effects: minutes, kilograms, labour hours, energy or delayed orders.
4. Future-State Design and Kaizen Bursts
The future-state map should not simply reduce inventory. It should create a controlled flow aligned with demand and quality requirements.

Recommended kaizen bursts include:
- Standard work for pouring: Define ladle temperature, treatment timing, pour sequence, transfer limits and reaction plans for abnormal conditions.
- Sand quality at the source: Introduce hourly checks for moisture, compactability, permeability and green strength, with clear escalation limits.
- Quick-change pattern and core-box setup: Separate internal and external setup tasks, stage tools and use preset fixtures to reduce the 45-minute changeover.
- Pull-based cooling racks: Release castings to cooling capacity rather than pouring solely to an upstream schedule.
- In-station fettling: Place common tools, gauges and extraction close to the operator, and balance benches against takt demand.
- First-off inspection: Inspect the first casting after pattern, core, alloy or parameter changes before continuing the batch.
- Scrap Pareto and feedback loop: Code defects at the point of discovery, review the top categories daily and return information to moulding, core making and pouring.
- Heat-treatment supermarket: Use defined FIFO lanes and a visual pull signal so furnace loading matches downstream demand.

5. Current Versus Future-State Targets
| Metric | Current state | 90-day target |
|---|---|---|
| Scrap rate | 6.4% | 2.5% |
| Rework hours per week | 186 | 70 |
| Moulding-line OEE | 78.0% | 86.0% |
| Order-to-dispatch lead time | 6.5 days | 3.0 days |
| On-time delivery | 87% | 96% |
| Castings per labour hour | 18.4 | 23.5 |
| Process Cycle Efficiency | 0.13% | 0.27% |
| Energy per tonne poured | 780 kWh | 710 kWh |
These are improvement targets, not automatic outcomes. Each target requires a defined owner, measurement method and control response.
6. A 90-Day Kaizen Sequencing Plan
Days 1–30: Stabilise and measure
Owners: Operations Manager, Quality Manager and Foundry Supervisor
- Confirm the product family and validate the map through floor observation.
- Establish a defect coding standard and daily scrap Pareto.
- Audit sand testing, pouring parameters and first-off inspection.
- Record actual queues, batch sizes, changeovers and furnace utilisation.
- Implement 5S at fettling benches and point-of-use tool storage.
- Train team leaders on takt, standard work and abnormality escalation.
Days 31–60: Improve flow and constraint capacity
Owners: Production Engineering, Maintenance and Heat-Treatment Lead
- Run a quick-changeover event for patterns and core boxes.
- Rebalance fettling capacity around the 0.75-minute takt requirement.
- Introduce FIFO lanes and pull signals for cooling and heat treatment.
- Reduce furnace changeover through staged charge materials and standard recipes.
- Pilot in-station inspection and defect feedback at the moulding and pouring interface.
- Review OEE losses by availability, performance and quality rather than using one headline number.
Days 61–90: Control and sustain
Owners: Plant Manager, Process Owner and Continuous Improvement Lead
- Publish standard work combination sheets for critical operations.
- Establish daily tier meetings with visual measures for scrap, rework, OEE and delivery.
- Complete control plans for sand quality, pouring, heat treatment and inspection.
- Verify energy per tonne poured and melt utilisation.
- Conduct a 30-day capability review using before-and-after data.
- Replicate the method across the next casting family only after the first value stream is stable.
Build Capability to Lead the Improvement
A successful foundry VSM requires more than drawing process boxes. Teams must understand DMAIC, takt time, process capability, root-cause analysis, control plans, OEE, measurement systems and financial impact.
Lean 6 Sigma Hub offers CSSC-accredited, self-paced online training from White Belt through Master Black Belt. The courses use real-world simulations, dummy data, charts, worked examples and end-to-end DMAIC case studies so professionals can learn by doing.
Start with White Belt training for foundational awareness, progress to Yellow Belt to support improvement teams, or develop project leadership through Green Belt, Black Belt and Master Black Belt.
Choose the certification level that matches your role, build the capability to map the whole stream, and lead measurable improvements from molten metal to shipped casting.
Kaizen. Kai-Care. Kai-Done. Lean Six Sigma





