

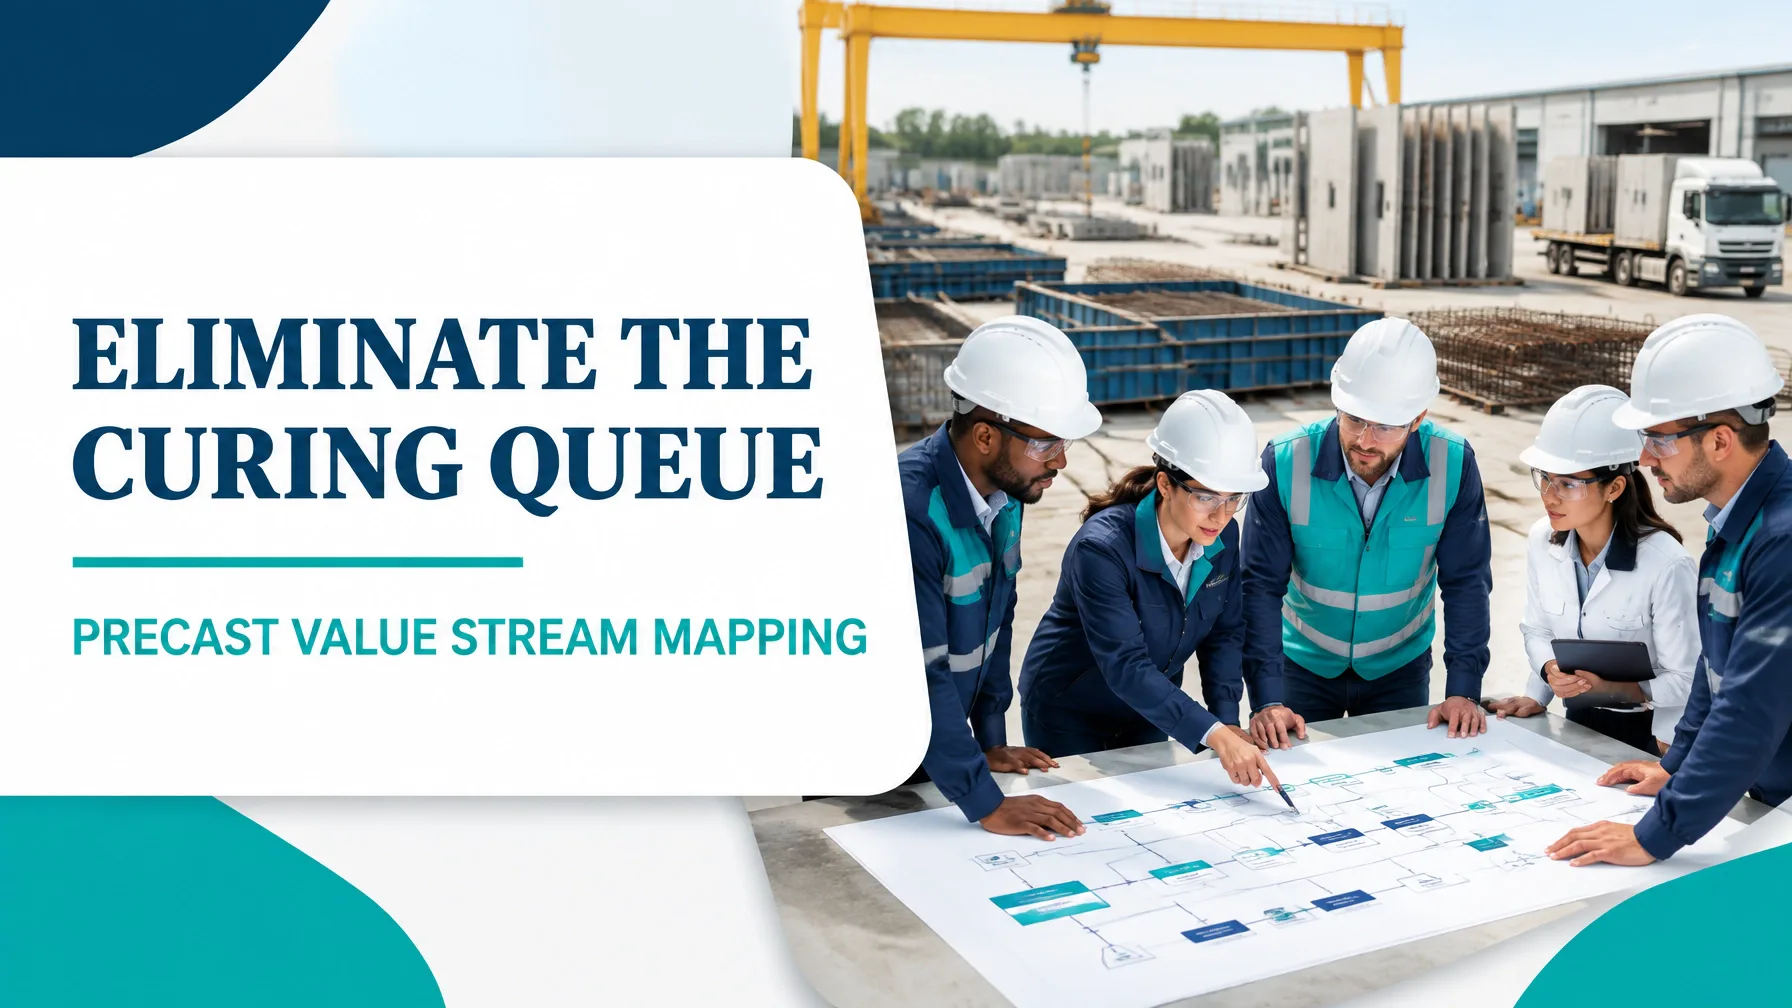
In precast concrete manufacturing, production speed is rarely determined by the time required to pour concrete alone. The customer experiences the entire value stream: drawings and approvals, mould preparation, steel fixing, pouring, curing, stripping, finishing, yard storage, loading, transport, and delivery to site.
Value Stream Mapping (VSM) makes that complete flow visible. It connects material movement with information flow, exposes queues between operations, and separates value-adding work from delay, handling, inspection, and rework.
This guide presents an illustrative current-state and future-state analysis for a precast panel product family producing 46 panels per week. The objective is specific: reduce the curing queue, improve delivery reliability, and create a controlled flow from mould setup to delivered panel.
Research from the Precast/Prestressed Concrete Institute and the Lean Construction Journal demonstrates why VSM is valuable in precast operations: local improvements to individual processes do not guarantee overall flow improvement. The entire value stream must be examined.
1. Define the Scope: One Product Family, One End-to-End Flow
A useful VSM begins with disciplined scope selection. Do not map every product, mould type, or customer segment at once. Select a representative product family with similar processing requirements.
For this case, the scope is:
- Steel fixing and reinforcement placement
- Mould cleaning, setup, and insert installation
- Pre-pour inspection
- Concrete batching and pour
- Curing and the curing queue
- Stripping and lifting
- Surface finishing and repair
- Yard storage and sequencing
- Loading and transport to site
The information flow includes customer demand, approved shop drawings, production releases, quality checkpoints, erection schedules, and transport bookings.
The fundamental purpose is to understand what the customer values. A delivered panel that meets dimensional, strength, finish, and installation requirements creates value. Waiting for a mould, moving a panel between distant areas, searching for inserts, repeating inspections, or repairing a preventable finish defect consumes resources without advancing the panel toward customer requirements.
2. Current-State Map: Where the 9.4 Days Go
The following figures are illustrative operating data for a 46-panel-per-week line. They should be validated through direct observation, time studies, production records, and interviews with operators, quality staff, schedulers, and transport coordinators.

| Process step | Value-adding touch time per panel | Queue or delay | Current-state observation |
|---|---|---|---|
| Steel fixing and reinforcement placement | 9.5 hours | 4 hours | Cages sometimes wait for mould availability |
| Mould cleaning and setup | 6.0 hours | 2 hours | Average changeover is 165 minutes |
| Pre-pour inspection | 1.5 hours | 3 hours | Release depends on inspector availability |
| Concrete pour and finishing | 7.0 hours | 2 hours | Batch timing is not fully aligned to mould readiness |
| Curing and curing queue | 24.0 hours | 28 hours | Panels wait for release, strength confirmation, or stripping capacity |
| Stripping and lifting | 5.5 hours | 5 hours | Crane and crew availability create interruptions |
| Surface finishing and repair | 14.0 hours | 8 hours | 12% of panels require surface-finish rework |
| Yard storage, loading, and transport | 9.3 hours | 88 hours | Panels wait for erection sequence and truck confirmation |
| Total | 76.8 hours / 3.2 days | 148.8 hours / 6.2 days | 9.4 days total throughput time |
The worked calculation
The total value-adding time is:
9.5 + 6.0 + 1.5 + 7.0 + 24.0 + 5.5 + 14.0 + 9.3 = 76.8 hours
Converting hours into days:
76.8 ÷ 24 = 3.2 days of value-adding work
The total throughput time is:
9.4 days × 24 = 225.6 hours
Therefore, non-value-adding time is:
225.6 − 76.8 = 148.8 hours, or 6.2 days
The percentage of total throughput time that is value-adding is:
76.8 ÷ 225.6 × 100 = 34.0%
The principal constraint is not necessarily the concrete pour. It is the combined effect of curing release, stripping capacity, yard sequencing, and transport coordination. The curing queue alone contributes 28 hours of waiting per panel, while the 165-minute mould changeover reduces flexibility and encourages larger production batches.
Current delivery performance is 74% on time. Surface-finish rework affects 12% of panels, which creates additional handling, inspection, and yard disruption.
3. Identify the Eight DOWNTIME Wastes
The DOWNTIME framework provides a practical lens for analysing the map:
- Defects: Honeycombing, pinholes, damaged edges, incorrect inserts, dimensional variation, and surface-finish rework. With 12% rework, the plant is paying for finishing activity more than once.
- Overproduction: Casting panels before the site erection sequence is confirmed, creating excess finished goods in the yard.
- Waiting: Panels waiting for curing release, cranes, inspectors, approved drawings, trucks, or transport documentation.
- Non-utilised talent: Operators who understand recurring mould, reinforcement, and finish problems are not consistently involved in root-cause analysis or standard-work design.
- Transportation: Moving reinforcement cages, mould components, and finished panels across long distances between production, finishing, storage, and loading areas.
- Inventory: Work in process between steel fixing and mould setup, panels occupying curing positions, and finished panels held in the yard.
- Motion: Searching for tools, inserts, drawings, lifting accessories, release agent, or repair materials.
- Extra-processing: Repeated inspections, unnecessary surface treatment, duplicate data entry, and finishing beyond the customer specification.
This analysis should not become a list of isolated complaints. Each waste should be connected to a measurable process condition. For example, “waiting for curing release” should be separated into strength-test delay, fixed curing policy, stripping-crew availability, and mould scheduling. Each cause requires a different countermeasure.
4. Build the Future State: Flow Before Extra Capacity

A future-state map should be designed around customer demand, process capability, and controlled release, not simply faster individual activities.
Future-state design principles
-
Reduce mould changeover using SMED thinking.
Stage inserts, tools, drawings, and release agent before the previous panel leaves the mould. Separate external preparation from internal changeover work and standardise the sequence. -
Create a controlled curing release rule.
Use verified strength and product requirements to define the earliest safe stripping point. Display mould occupancy, pour time, curing status, and release readiness visually. -
Balance stripping with mould and finishing capacity.
The curing area should not become a hidden storage zone. A daily plan should match available crane time, stripping crews, finishing capacity, and yard space. -
Move from production push to site-driven pull.
Use confirmed erection requirements to trigger final production and transport sequencing. Limit finished-panel inventory to a defined supermarket or FIFO lane. -
Build quality into the source.
Use first-piece checks, insert-location templates, mould condition checks, controlled vibration standards, and clear finish acceptance criteria to prevent defects before finishing. -
Connect information flow to the physical flow.
Approved drawings, revision status, quality release, curing status, and delivery sequence should be visible at the point of use.
5. Current Versus Future-State Targets
| Metric | Current state | 90-day future-state target | Improvement logic |
|---|---|---|---|
| Weekly output | 46 panels | 50 panels | Increase effective capacity through flow |
| Total throughput time | 9.4 days | 5.8 days | Remove queues and reduce yard dwell |
| Value-adding time | 3.2 days | 3.0 days | Preserve transformation while simplifying work |
| Curing queue | 28 hours/panel | 8 hours/panel | Strength-based release and visual scheduling |
| Mould changeover | 165 minutes | 90 minutes | Standard work, staging, and SMED |
| Surface-finish rework | 12% | 5% | Source controls and defect prevention |
| Finished-panel yard inventory | 5.5 days | 2.0 days | Pull sequencing and FIFO lanes |
| On-time delivery | 74% | 93% | Integrate production, erection, and transport plans |
| First Pass Yield | 88% | 95% | Improve right-first-time quality |
| Average truck waiting time | 42 minutes | 15 minutes | Pre-release documents and loading windows |
The future-state throughput calculation becomes:
5.8 days × 24 = 139.2 hours
If value-adding time is maintained at approximately 72 hours, then non-value-adding time falls to:
139.2 − 72 = 67.2 hours
That represents a reduction of:
148.8 − 67.2 = 81.6 hours, or 3.4 days
The objective is not to remove necessary curing time or safety controls. It is to eliminate avoidable queue time surrounding curing and ensure that panels are released, finished, stored, and transported according to demand.
6. A 90-Day Kaizen Sequencing Plan

Days 1–30: Stabilise the current process
- Confirm the product family and map boundaries.
- Validate cycle times, queues, WIP, rework, and delivery data.
- Establish daily visual management for mould status and curing release.
- Introduce a standard mould setup checklist.
- Record every surface-finish defect by type, location, and likely cause.
- Create a baseline dashboard for throughput time, First Pass Yield, changeover, and on-time delivery.
Days 31–60: Improve flow at the constraint
- Run a focused changeover kaizen to reduce the 165-minute setup.
- Stage tools, inserts, drawings, and release materials.
- Trial a curing release system based on verified readiness criteria.
- Balance stripping, finishing, and crane resources against the daily plan.
- Define maximum WIP between steel fixing, mould setup, curing, and finishing.
- Introduce FIFO lanes for finished panels and delivery sequencing.
Days 61–90: Control and sustain the gains
- Standardise the future-state operating method.
- Audit mould setup, curing release, finish quality, and loading readiness.
- Review weekly performance against the 5.8-day throughput target.
- Use Pareto analysis for recurring defects and delivery misses.
- Assign process owners for changeover, curing, quality, yard control, and transport.
- Conduct a formal tollgate review to confirm benefits, risks, and the next improvement cycle.
Turn the Map into Measurable Capability
Value Stream Mapping is most powerful when it moves beyond a wall chart. In the realm of precast manufacturing, the map should become a management system for capacity, quality, delivery, and improvement.
To develop the capability to lead this work, explore Lean Six Sigma Green Belt online training or Black Belt online training from Lean 6 Sigma Hub. The courses are CSSC-accredited, fully self-paced, and built around practical application with worked examples, charts, simulations, templates, and end-to-end DMAIC case studies.
Whether you are a production supervisor, process engineer, project manager, or operations leader, certification can help you translate queues and variation into structured improvement projects, and convert a current-state map into reliable customer flow.
Start your CSSC-accredited Lean Six Sigma training today and learn how to design a faster, more reliable precast concrete value stream.
Kaizen. Kai-Care. Kai-Done. Lean Six Sigma





