

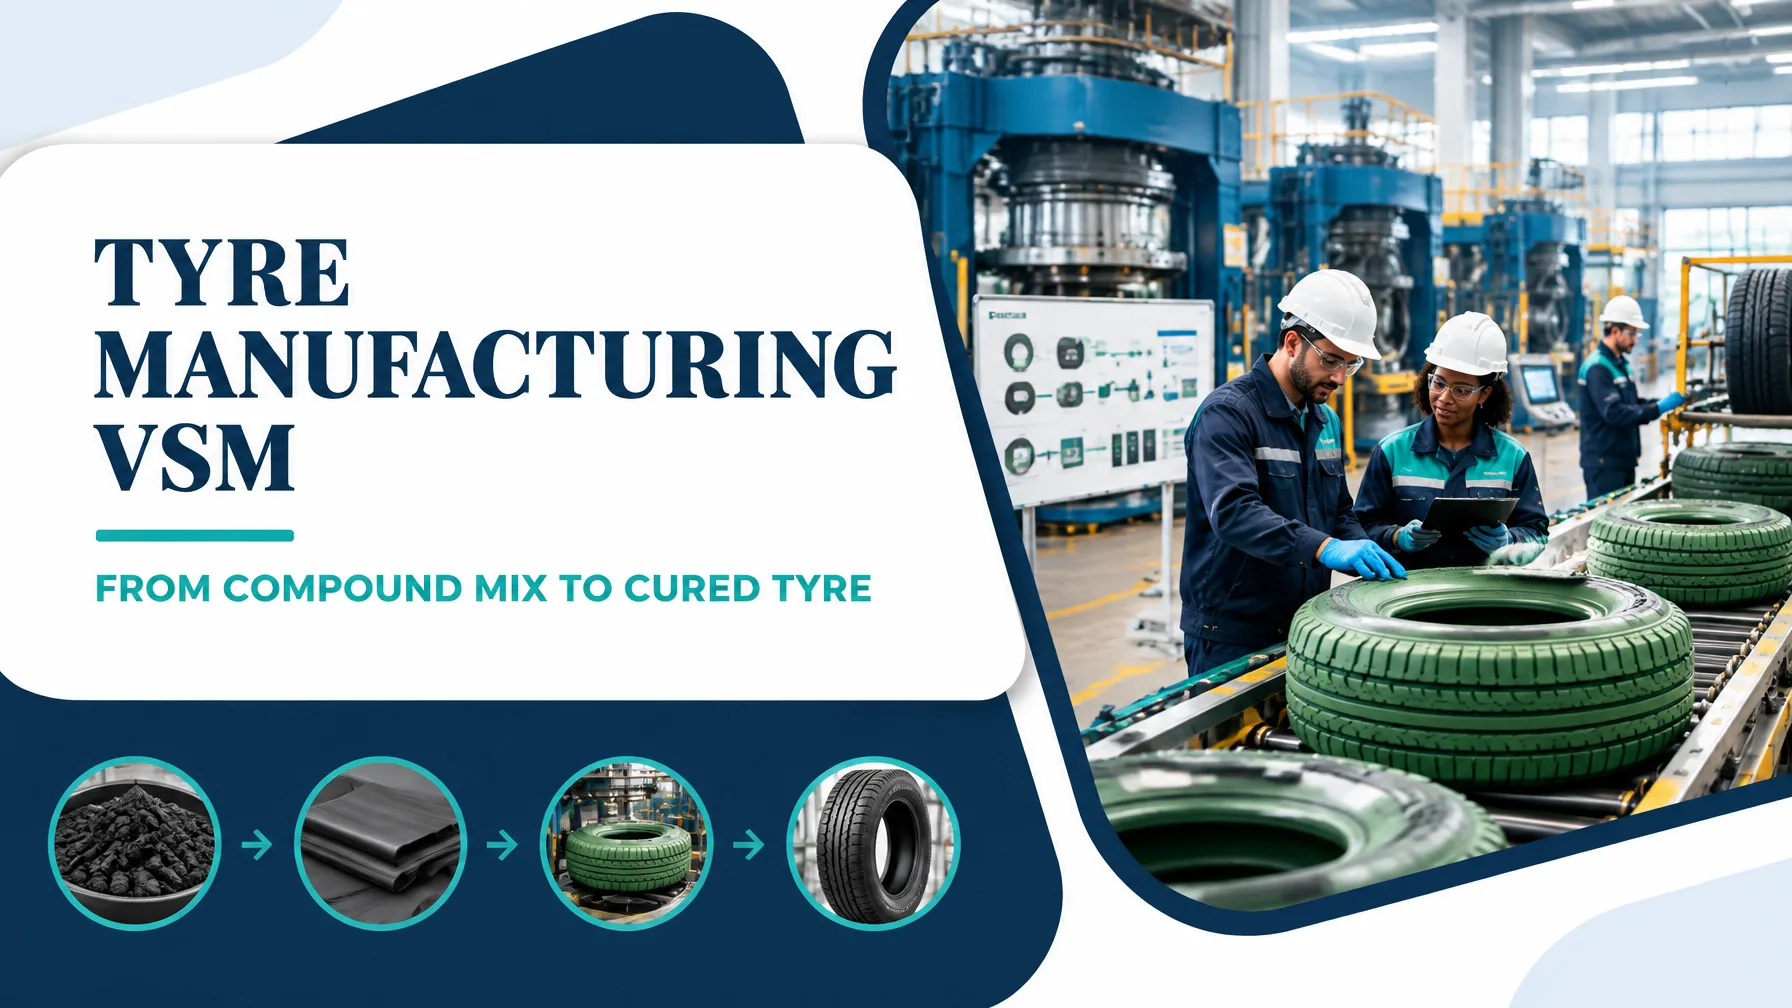
In a tyre plant, value does not flow in a straight line simply because materials move from one department to another. The stream runs from raw rubber, carbon black and chemicals through compounding, component preparation, tyre building, curing, inspection and dispatch. Between these stages, queues often accumulate: compound waits to mature, tread waits for building, green tyres wait for a curing press, and finished tyres wait for release.
Value Stream Mapping (VSM) makes this complete material and information flow visible. Rather than optimising one machine in isolation, it connects customer demand, takt time, throughput, inventory, quality and scheduling across the entire product family.
This worked example uses a representative plant producing 18,000 passenger tyres per day. The figures are illustrative, but the method can be applied directly during a gemba-based improvement study. For supporting calculations, Lean 6 Sigma Hub’s Process Cycle Efficiency Calculator can help compare value-added time with total lead time.
1. Define the Mapping Boundary
The selected value stream begins when raw rubber and carbon black enter the mixing area and ends when inspected tyres are released to warehouse dispatch.
The scope includes:
- Carbon black, natural rubber and synthetic rubber preparation.
- Banbury compound mixing, cooling and maturation.
- Tread and sidewall extrusion.
- Calendered fabric and steel-ply preparation.
- Bead preparation.
- Tyre building.
- Green tyre buffering.
- Curing presses and mould changes.
- Uniformity, balance and X-ray inspection.
- Warehouse release and dispatch.
This boundary is broad enough to expose the relationship between upstream batching and the curing press queue, while remaining focused on one product family: passenger tyres of similar construction and size.
2. Current-State Map: Follow the Queue

The plant receives a daily customer requirement of 18,000 tyres. With 24 calendar hours available, the demand takt is:
Takt time = 86,400 seconds ÷ 18,000 tyres = 4.8 seconds per tyre
This does not mean each individual process must have a 4.8-second cycle. Batch operations, parallel machines and two-cavity curing presses must be converted into an equivalent per-tyre capacity.
Current-state data
| Process | Representative current data |
|---|---|
| Compound mixing | 1,200 kg batch; 14-minute mix cycle |
| Cooling and maturation | 30-minute cooling; 8-hour maturation wait |
| Tread extrusion | 1,050 kg/hour; approximately 3.0 kg tread per tyre |
| Calendering | 42-second equivalent per tyre; 6-hour fabric WIP |
| Bead preparation | 18 seconds per bead set; 2-hour queue |
| Tyre building | 24 machines; 88 seconds per green tyre |
| Building quality | 92% first-pass yield; 8% rework or scrap |
| Green tyre buffer | 4,000 tyres; average dwell of 5.3 hours |
| Curing | 90 presses; 12-minute cycle; two tyres per cycle |
| Mould changeover | 75 minutes; approximately eight events per day |
| Press OEE | 84%; cure scrap and rework of 2.5% |
| Inspection | 18 seconds per tyre; uniformity, balance and X-ray checks |
| Raw material to dispatch lead time | 5.2 days |
| Value-added processing time | Approximately 14.5 minutes per tyre |
| Process Cycle Efficiency | 0.19% |
The curing department’s theoretical capacity is:
90 presses × 2 tyres × 60 minutes ÷ 12 minutes × 24 hours = 21,600 tyres per day
At 84% OEE, effective good output is approximately:
21,600 × 0.84 = 18,144 tyres per day
That leaves only 144 tyres of daily capacity margin against demand. A small rise in downtime, cure defects or mould-change activity can therefore create a queue.
The building department produces approximately:
24 machines × 3,600 seconds ÷ 88 seconds × 20 scheduled hours = 19,636 green tyres per day
At 92% first-pass yield, this represents approximately 18,065 acceptable green tyres before rework. Building is therefore scheduled slightly ahead of curing, causing the 4,000-tyre buffer to remain persistently high.
The average press consumption is:
18,000 tyres ÷ 24 hours = 750 tyres per hour
Therefore, the green tyre buffer represents:
4,000 ÷ 750 = 5.3 hours of press demand
The buffer protects curing from short interruptions, but it also conceals variation, increases handling and creates a visible queue before the constraint.
What the map reveals
The primary constraint is not necessarily the machine with the longest nominal cycle time. It is the combined effect of curing capacity, mould changes, downtime and quality losses. This is a Theory of Constraints problem: improving upstream building output without improving the constraint increases Work in Process rather than throughput.
The map should also distinguish:
- Value: features the customer is willing to pay for, such as correct construction, durability and consistent performance.
- Voice of the Customer: requirements translated into measurable CTQs such as uniformity limits and dimensional compliance.
- Voice of the Business: safe capacity, margin, delivery reliability and asset productivity.
- Voice of the Process: actual cycle time, variation, scrap and downtime data.
A Time Observation Sheet should record operator movement, component retrieval, inspection and waiting. An average cycle time alone can hide substantial variation, so use run charts, an X-bar chart and an R chart to identify shifts and trends. Box plots can show skewness and outliers in mould-change or curing time.
3. The Eight DOWNTIME Wastes in Tyre Manufacturing
- Defects: building splice errors, misplaced components, cure blisters and uniformity failures.
- Overproduction: building green tyres ahead of the available curing capacity.
- Waiting: green tyres waiting for a free press, operators waiting for components, or information waiting for approval.
- Non-utilised talent: experienced builders spending time on reactive troubleshooting rather than standardising work.
- Transportation: repeated movement of compound, ply, tread and green tyres between bays.
- Inventory: excess compound, component WIP, green tyres and finished stock.
- Motion: operators walking to retrieve beads, labels, tools or inspection records.
- Extra processing: repeated inspection passes, unnecessary handling or over-curing.
The fundamental purpose of VSM is not to remove every buffer immediately. It is to establish the right buffer, at the right location, with a defined FIFO rule and replenishment signal.
4. Future-State Design: Build Flow, Not Queues

The future-state map should connect building output to curing demand rather than allowing each department to optimise its own schedule.
Priority kaizen bursts
-
SMED for mould and component changeovers
Separate internal and external work, pre-stage moulds and tools, standardise connections and use a changeover checklist. Reducing mould changeover from 75 to 30 minutes across eight daily events reduces lost press time from 600 to 240 press-minutes. At two tyres per 12-minute cycle, this recovers approximately 60 tyre positions per day. -
Level the building schedule
Use a heijunka-style schedule that releases green tyres in line with press capacity, product mix and customer demand. Stop building ahead simply to maximise local machine utilisation. -
Create FIFO green tyre lanes
Replace random storage with marked lanes sized for a controlled buffer. A pull signal should identify tyre family, quantity, priority and maximum dwell time. -
Batch compound to the schedule
Match mixing batches to extrusion, calendering and building requirements. Reduce maturation variability through standard temperature, time and release criteria. -
Place defect escape points at building
Use poka-yoke for component placement, splice verification and barcode recipe confirmation. Attribute data such as Pass/Fail can trigger immediate containment, while variable data supports capability analysis. -
Apply TPM to curing presses
Use planned maintenance, condition checks and autonomous inspection to improve availability. An Andon signal should alert maintenance and supervision when a press fault, temperature deviation or cycle interruption occurs. -
Use statistical confirmation
ANOVA can compare cure quality across presses, shifts or mould families. Bartlett’s Test can assess whether group variances are sufficiently similar before applying ANOVA. Bias studies should confirm that uniformity, X-ray and dimensional measurements are reliable.
The process relationship can be expressed as Y = f(x): finished tyre quality is a function of inputs such as compound temperature, component position, building pressure, cure time and mould condition. Controlling critical inputs is more effective than relying exclusively on final inspection.
5. Current Versus Future State
| Metric | Current state | 90-day target |
|---|---|---|
| Press utilisation | 83% | 90% |
| Press OEE | 84% | 91% |
| Raw-material-to-dispatch lead time | 5.2 days | 2.1 days |
| Green tyre inventory turns per day | 4.5 | 12.0 |
| First-pass yield | 88.2% | 96.5% |
| Cure scrap | 2.5% | 1.0% |
| Tyres per labour hour | 21 | 25 |
| Process Cycle Efficiency | 0.19% | 0.48% |
These targets support a Zero Defects direction: doing the work correctly the first time, as promoted by Philip Crosby, while recognising that process capability and error-proofing must support the ambition.
6. A 90-Day Kaizen Sequencing Plan

Days 0–30: Establish the baseline
Owners: Value Stream Manager, Production Manager, Quality Manager and Finance Business Partner.
- Confirm product family, demand and takt.
- Collect 10 days of cycle, downtime, WIP, scrap and changeover data.
- Validate measurement systems and check for bias.
- Map the current state at the gemba.
- Confirm the business case, including changeover cost and quality loss.
- Set green tyre FIFO lanes and maximum quantities.
Days 31–60: Pilot the constraint loop
Owners: Curing Manager, Maintenance Manager, Building Manager and Lean Facilitator.
- Pilot SMED on two representative presses.
- Introduce levelled building releases.
- Install pull signals and Andon escalation rules.
- Add building defect checks before green tyres enter the buffer.
- Trial TPM checks on the lowest-OEE presses.
- Review daily X-bar, defect and queue data.
Formal approval checkpoints should protect recipe, safety and quality governance. However, approvals must have clear decision rights and response times; otherwise, they become an administrative bottleneck.
Days 61–90: Stabilise and scale
Owners: Plant Manager, Supply Chain Manager, HR Capability Lead and Black Belt.
- Compare pilot results with the future-state targets.
- Reduce the green tyre buffer in controlled steps.
- Standardise the best changeover method across press families.
- Update production control rules and operator standards.
- Train Yellow Belts to sustain local improvements and assign a Black Belt to mentor project teams.
- Use the project scope boundary calculator and Cost of Poor Quality Calculator to support the next improvement wave.
A White Belt can understand the principles and DMAIC awareness needed to participate. Yellow Belts support focused improvements, while Black Belts lead complex projects using statistical analysis, structured experimentation and governance.
Build Capability Beyond the Map
A VSM becomes valuable when it changes decisions: what to schedule, where to place inventory, how to respond to variation and which constraint deserves investment. To build that capability, pursue CSSC-accredited self-paced Lean Six Sigma training with practical simulations, dummy data, charts and end-to-end DMAIC case studies.
Explore the Lean 6 Sigma Hub training catalogue and begin at the level that matches your role, from White Belt through Master Black Belt. Build the skills to map flow, remove queues and lead measurable operational improvement.
Kaizen. Kai-Care. Kai-Done. Lean Six Sigma





