

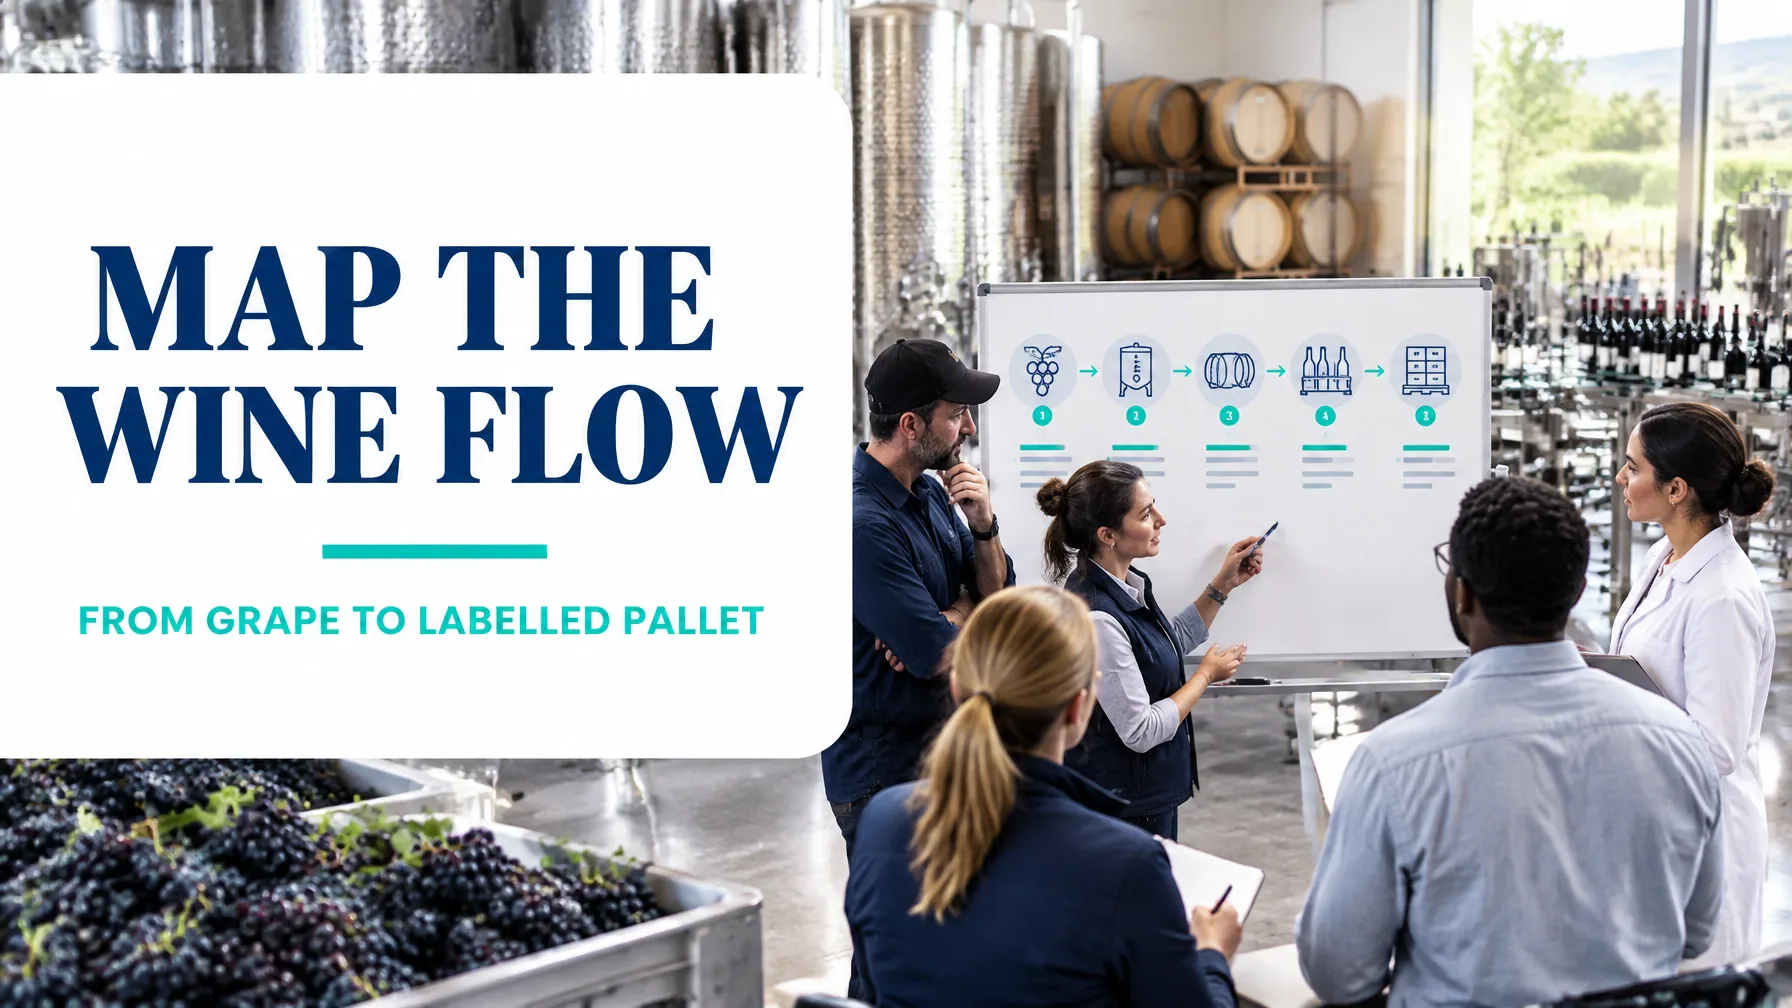
In the realm of winery production, a long lead time is not automatically a problem. Fermentation, maturation and stabilisation require time. The operational question is more precise:
Which elapsed time is essential to wine quality, and which time is created by queues, unclear release rules, rework or disconnected decisions?
Value Stream Mapping (VSM) answers that question by connecting material flow and information flow from the first physical input to the customer-ready output. It is a recognised Lean method for creating a current-state map, designing a future-state map, and sequencing improvement work. The Lean Enterprise Institute’s VSM guidance emphasises that the purpose is to see the entire value stream, not merely optimise isolated process steps.
This guide applies that thinking to a 240,000-case annual winery running two distinct production streams:
- A premium barrel program
- An entry-tier tank program
The value stream begins with grape intake and crush and ends with labelled pallet release.
Scope Selection: Why Start at Grape Intake and End at Labelled Pallet Release?
A useful VSM scope must be wide enough to expose system constraints but specific enough to support reliable data collection.
Starting at grape intake captures the seasonal constraint created by fruit arrivals, weighbridge decisions and crush capacity. Ending at labelled pallet release captures the final quality, packaging and logistics requirements that determine whether wine is genuinely available to the customer.
The map therefore includes:
- Grape arrival, weighing and quality acceptance
- Crushing and must transfer
- Fermentation
- Barrel maturation or tank holding
- Blending and bench trials
- Filtration and stabilisation
- Bottling, corking and labelling
- Pallet inspection and release
This boundary also makes the information flow visible: intake appointments, lab results, sensory decisions, bottling schedules, release approvals and ERP records.
Current-State Map: The Flow Behind 47 Days of Elapsed Time
The baseline covers 1,420 tonnes of fruit across a 46-day harvest window.
Fruit arrival
  ↓
Weighbridge and crush
  • Crush capacity: 38 tonnes/hour
  • Peak arrival rate: 52 tonnes/hour
  • Average peak truck queue: 3.4 hours
  ↓
Fermentation
  • 18% of ferments require intervention
  • Average intervention attention: 4.7 days
  ↓
Barrel maturation / tank program
  • 620 barrels in premium program
  • Average maturation: 11 months
  • Past-readiness hold: 27% of barrels
  • Average excess hold: 34 days
  ↓
Blending
  • 14 blends per season
  • Average bench-trial iterations: 3.6
  ↓
Filtration and stabilisation
  • Average elapsed time: 9.2 days
  • Machine time: 2.4 days
  • Queue and waiting exposure: 6.8 days
  ↓
Bottling and labelling
  • 12 campaign changeovers
  • Average changeover: 104 minutes
  • Bottled volume held for defects: 2.1%
  ↓
Labelled pallet release
  • Average bottling-to-release time: 47 days
The bottling campaign demand is framed at 960 cases per hour across a six-hour window. This produces a takt time of:
60 minutes ÷ 960 cases = 0.0625 minutes per case, or 3.75 seconds per case.
Takt is not a target for every cellar activity. It is the customer-demand rhythm that the bottling and release system must ultimately support.
The contrast between processing and elapsed time is substantial. The winery records approximately 118 minutes of true value-adding cellar and line time per case, compared with 47 days from bottling to released pallet. On the stated baseline, process cycle efficiency is close to 1%.
All Eight DOWNTIME Wastes in the Winery Value Stream
The eight DOWNTIME wastes provide a practical diagnostic structure.
| Waste | Winery example | Baseline quantification |
|---|---|---|
| Defects | Stickies, label errors, fill-height issues, cork defects and re-blends | 2.1% of bottled volume held; approximately 5,040 case-equivalents across 240,000 cases |
| Overproduction | Wine held beyond sensory readiness and additional blending to protect volume | 27% of 620 barrels, or approximately 167 barrels, held an average 34 days; about 5,692 barrel-days |
| Waiting | Truck queues, ferment interventions, lab turnaround, stabilisation queues and bottling changeovers | 3.4-hour crush queue; 6.8 days of stabilisation elapsed time beyond machine time; 47 days bottling-to-release |
| Non-utilised talent | Winemakers spending time on administration, barrel logistics and duplicated status updates | At least 180 intervention-days per 100 ferments when 18% require 4.7 days of attention |
| Transportation | Barrel movements between cellars and tank-to-line transfers | The premium flow exposes 620 barrels to movement planning; quantify barrel-moves, transfer distance and handling time by lot |
| Inventory | Wine in tanks and barrels, held pallets, dry goods and unreleased bottled stock | 620 barrels, plus WIP across fermentation, stabilisation and a 47-day release pipeline |
| Motion | Store-to-line retrieval of labels, corks, bottles and other dry goods | Motion is embedded in 12 changeover events, representing 1,248 minutes of current changeover windows |
| Excess processing | Repeat laboratory analysis and duplicated manual tank records in the ERP | 50.4 seasonal bench-trial iterations at the current average of 3.6 across 14 blends; duplicated records should be counted by transaction and minutes |
This analysis distinguishes necessary wine-making time from avoidable delay. For example, the 11-month maturation period may be appropriate for the premium range. However, a barrel that is sensory-ready and then held for another 34 days represents a planning and release problem rather than a quality requirement.
Future-State Design: Replace Guesswork with Controlled Flow

The future-state map should not attempt to eliminate every batch or every approval. Wine production has legitimate biological, sensory and regulatory requirements. The objective is to create controlled flow around those requirements.
1. Level grape intake against crush capacity
Create intake appointments that reflect the 38-tonne-per-hour crush rate rather than allowing arrivals to build toward the 52-tonne-per-hour peak. At the weighbridge, introduce a fruit-quality gate covering:
- Variety and vineyard block
- Arrival condition
- Temperature
- Weight and documentation
- Acceptance or hold decision
This turns the weighbridge into an early quality control point and targets a reduction in the peak queue from 3.4 hours to 0.6 hours.
2. Establish ferment-health signals
Track daily fermentation trends using defined measures such as temperature, sugar depletion and intervention status. Create an early-warning trigger before a ferment becomes stuck or sluggish.
A daily visual trend can move the process from reactive attention to planned intervention, reducing the proportion of affected ferments and the associated 4.7-day average attention period.
3. Manage barrels to sensory milestones
Replace open-ended barrel holding with a milestone plan:
- Fill date and planned maturation window
- Scheduled sensory review
- Readiness decision
- Release or corrective action
- Quarterly release window
This preserves the premium barrel program while targeting past-readiness holding from 34 days to 7 days. The release window also creates governance without requiring a new approval for every routine movement.
4. Standardise blending decisions
Use a single bench-trial template that records:
- Objective and blend composition
- Sensory criteria
- Analytical results
- Decision owner
- Required iteration and rationale
- Final approval
The target is to reduce average iterations from 3.6 to 1.8, or from approximately 50.4 to 25.2 iterations per season across 14 blends.
5. Run stabilisation to a fixed lead-time window
The future state should treat stabilisation as a planned lead-time window rather than a queue. Capacity, laboratory response time and release criteria should be visible on a shared schedule.
The objective is to reduce average elapsed time from 9.2 days toward the 2.4-day machine-time requirement, while maintaining product specifications.
6. Apply SMED to bottling changeovers
Sequence campaigns longest-run-first where demand and quality requirements allow. Then separate internal and external work:
- Prepare labels, bottles, corks and tools before shutdown
- Use standard settings and visual setup sheets
- Pre-stage dry goods at point of use
- Assign clear changeover roles
- Record each of the 12 changeovers by element
The future-state target is a reduction from 104 minutes to 51 minutes per changeover.
7. Create a release pacemaker
Use labelled pallet release as the final control point. Connect bottling, quality, laboratory and logistics through a visible release board or digital workflow. This prevents wine from being physically complete but administratively unavailable.

Current Versus Future Performance
| Measure | Current state | Future-state target |
|---|---|---|
| Peak crush queue | 3.4 hours | 0.6 hours |
| Past-readiness barrel hold | 34 days | 7 days |
| Bottling changeover | 104 minutes | 51 minutes |
| Bottling-to-release | 47 days | 18 days |
| Bottled defect hold | 2.1% | 0.7% |
| Blend-trial iterations | 3.6 | 1.8 |
| Cellar process cycle efficiency | Approximately 1% | 3.4% |
| Release-date adherence | 61% | 94% |
The PCE target should be governed using one consistent definition of value-added time, batch-to-case conversion and elapsed-time denominator. A measurement system review is essential before declaring improvement.
30/60/90-Day Kaizen Sequencing
Days 1–30: Establish the baseline
Owners: Harvest Manager, Cellar Manager, Quality Manager and Continuous Improvement Lead
- Pilot the intake appointment model
- Implement the weighbridge fruit-quality gate
- Create the barrel readiness baseline for all 620 barrels
- Build a defect Pareto covering labels, fill height, corks and stickies
- Confirm definitions for queue time, value-added time and release adherence
Days 31–60: Improve process signals and setup
Owners: Winemaking Lead, Laboratory Manager, Bottling Manager and Maintenance Lead
- Introduce ferment-health trend monitoring and early-warning triggers
- Launch the standard bench-trial template
- Run SMED workshops on the two worst bottling changeovers
- Measure internal versus external changeover tasks
- Establish a daily visual management review
Days 61–90: Stabilise and control the future state
Owners: Operations Director, Quality Manager, Planning Manager and Finance Business Partner
- Launch quarterly barrel release windows
- Set the stabilisation fixed lead-time window
- Implement control charts for changeover time and defect holds
- Review release-date adherence weekly
- Validate working-capital and recovered-capacity benefits
- Update standard work, training and escalation rules
Annualised Benefit: Released Working Capital and Recovered Case Capacity
The defect target alone represents a potential recovery of approximately:
(2.1% − 0.7%) × 240,000 cases = 3,360 case-equivalents per year.
The changeover improvement releases 53 minutes per changeover. Across 12 changeovers, that is 636 minutes, or 10.6 hours, of campaign capacity. At 960 cases per hour, the theoretical capacity opportunity is approximately 10,176 case slots, subject to demand, staffing and equipment constraints.
For working capital, the barrel opportunity is approximately 5,692 barrel-days removed from past-readiness holding. Finance can convert this into a monetary benefit using the fully loaded carrying cost per barrel-day. The same approach can be applied to the reduction from 47 to 18 days of bottling-to-release inventory.
Build the Capability to Lead the Improvement
A winery VSM is not a one-time drawing. It is a management system for connecting customer demand, quality decisions, cellar capacity, bottling rhythm and release governance.
To lead this work effectively, professionals need practical capability in process mapping, takt time, root-cause analysis, statistical process control, changeover reduction and project governance. Lean 6 Sigma Hub’s CSSC-accredited Green Belt training includes practical process improvement tools, data collection, analysis, piloting and control planning. Professionals leading broader transformation may also benefit from CSSC-accredited Black Belt training.
Enrol in CSSC-accredited Lean Six Sigma training and build your capability through Lean Six Sigma Green Belt training. Learn to map the whole value stream, quantify the opportunity and convert kaizen activity into sustained operational results.
Kaizen. Kai-Care. Kai-Done. Lean Six Sigma.





