1. Introduction to ANOVA
Analysis of Variance (ANOVA) is a statistical technique used to determine if there are significant differences between the means of three or more groups. It extends the t-test, which is limited to comparing two groups, by analyzing multiple groups simultaneously.
ANOVA helps determine whether the variations observed in a process are due to actual differences between groups or just random fluctuations. This makes it a critical tool in Lean Six Sigma projects where process improvements and data-driven decisions are necessary.
2. Importance of ANOVA in Lean Six Sigma
Lean Six Sigma focuses on reducing process variations to improve quality and efficiency. ANOVA plays a vital role in process optimization, quality control, and cost reduction.
3. Types of ANOVA
1. One-Way ANOVA: Compares means of one independent variable across multiple groups.
2. Two-Way ANOVA: Analyzes the effect of two independent variables simultaneously.
3. Repeated Measures ANOVA: Compares means when the same subjects are measured under different conditions.
4. When to Use ANOVA
Use ANOVA when you need to compare three or more groups, your data is continuous, and the groups are independent.
5. Step-by-Step Guide to Conducting ANOVA
Step 1: Define the Problem
Step 2: Collect Data
Step 3: State the Hypotheses
Step 4: Perform ANOVA Calculation
Step 5: Analyze the Results
6. Case Study: Reducing Defect Rates in a Manufacturing Plant
Problem Statement
A manufacturing company wants to analyze defect rates in three different production shifts (Morning, Afternoon, and Night). The goal is to determine whether a particular shift has a significantly higher defect rate.
Data Collection
| Day | Morning Shift | Afternoon Shift | Night Shift |
| 1 | 4.5% | 5.2% | 6.1% |
| 2 | 4.8% | 5.5% | 6.0% |
| 3 | 4.6% | 5.1% | 6.3% |
| 4 | 4.7% | 5.3% | 6.2% |
| 5 | 4.9% | 5.4% | 6.5% |
| 6 | 4.4% | 5.0% | 6.1% |
| 7 | 4.3% | 5.3% | 6.0% |
| 8 | 4.6% | 5.2% | 6.4% |
| 9 | 4.5% | 5.1% | 6.3% |
| 10 | 4.7% | 5.4% | 6.2% |
ANOVA Analysis
F-statistic: 228.85
P-value: 1.17e-17
Since the p-value is extremely small, we reject the null hypothesis and conclude that there is a statistically significant difference in defect rates between shifts.
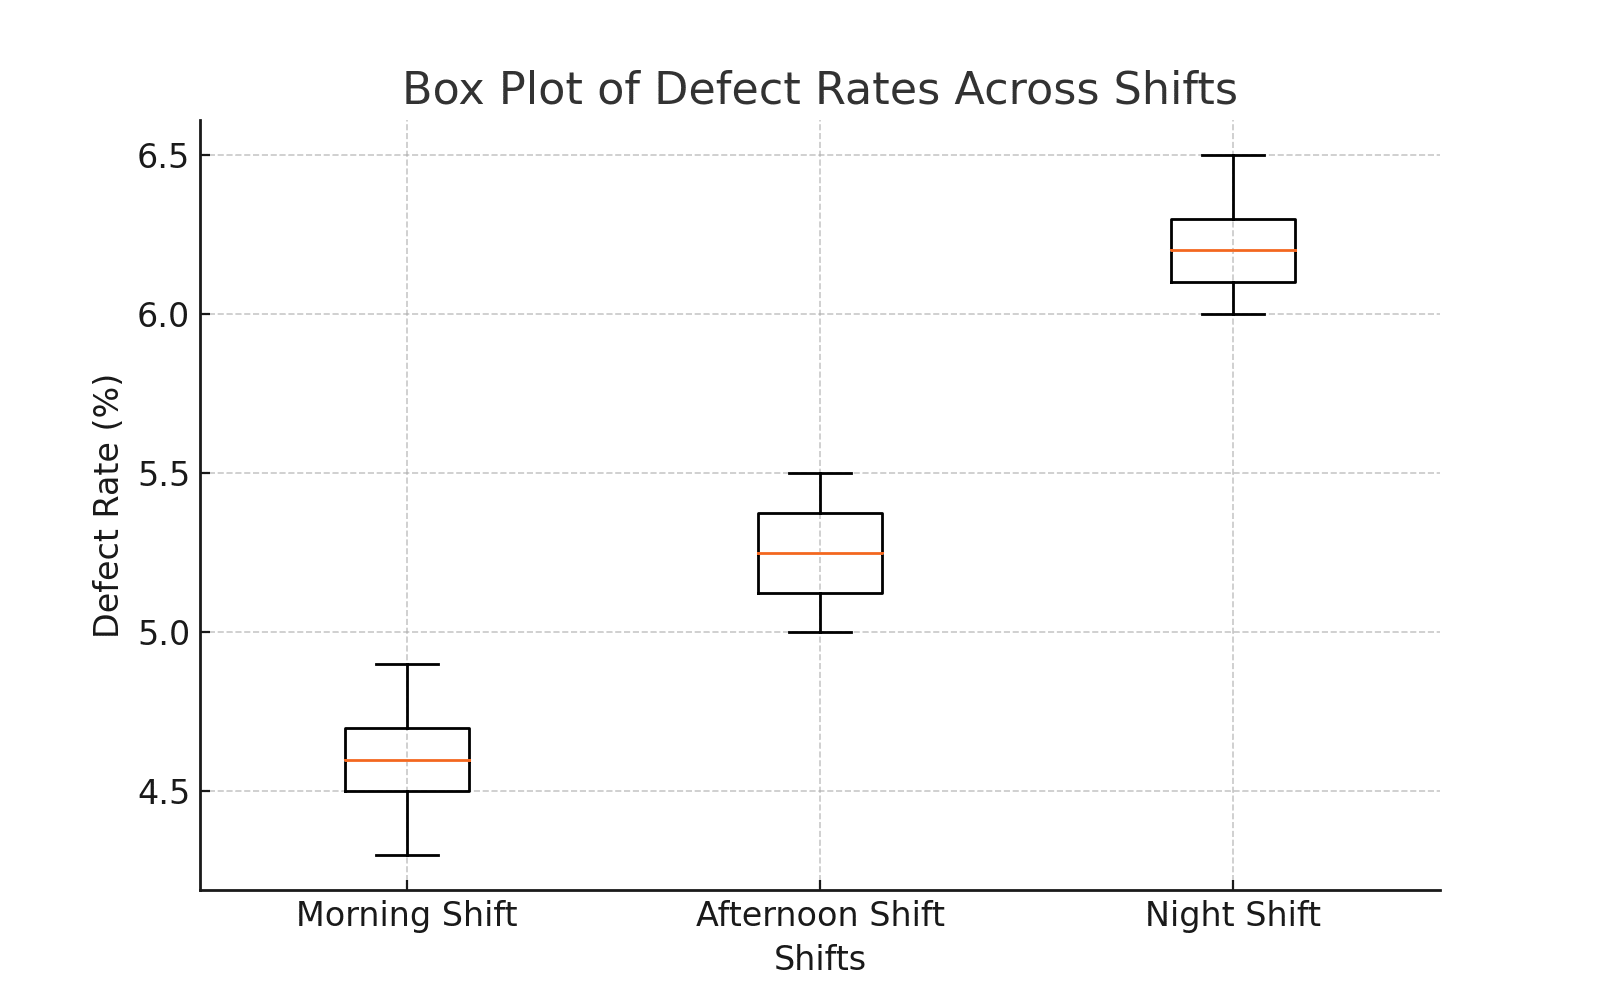
Visualization of ANOVA Results
The following box plot shows the distribution of defect rates across different shifts:
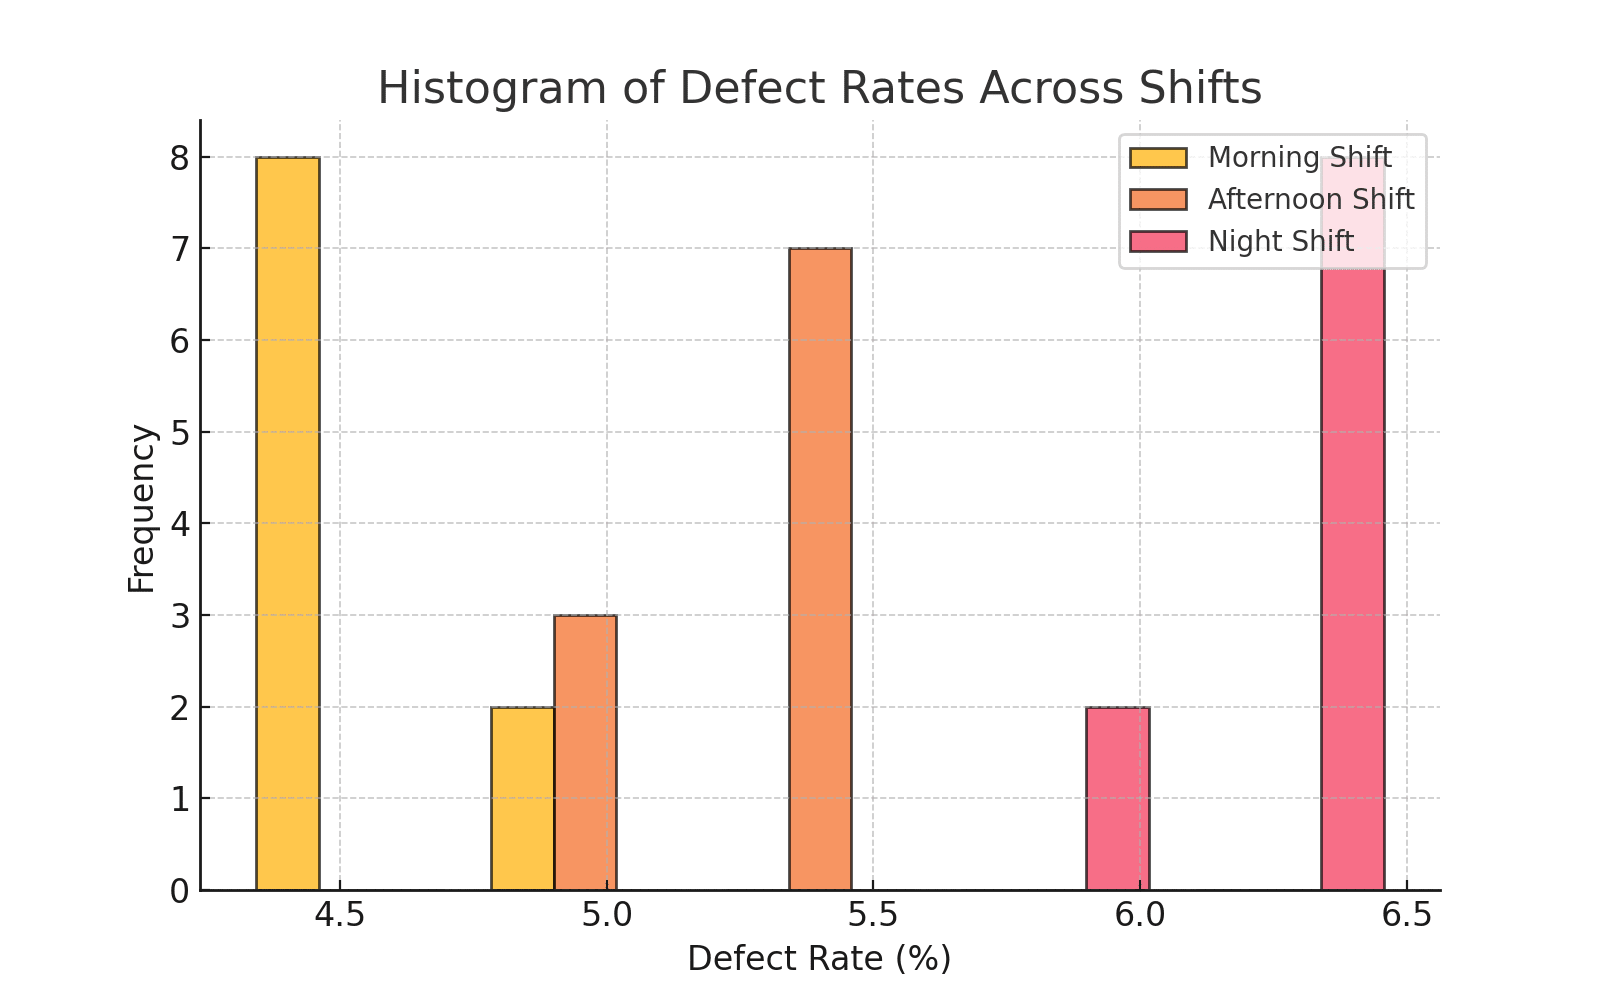
The histogram provides a frequency distribution of defect rates:
8. Common Mistakes and How to Avoid Them
1. Assuming Normality Without Checking.
2. Ignoring Homogeneity of Variance.
3. Performing Multiple t-tests Instead of ANOVA.
9. Conclusion
ANOVA is a powerful Lean Six Sigma tool for detecting differences in process performance. In our case study, we found a significant difference in defect rates across shifts. The Night Shift had the highest defect rates, indicating the need for process improvement.
10. FAQs
Q1: What is the minimum sample size for ANOVA?
A: A minimum of 6-10 samples per group is recommended, though larger samples provide more reliable results.
Q2: Can ANOVA be used for non-normal data?
A: If data is not normally distributed, consider using a Kruskal-Wallis test.
Q3: How does ANOVA differ from regression analysis?
A: ANOVA compares group means, while regression models relationships between variables.