Blog

How to Conduct Kaizen Events: A Complete Guide to Continuous Improvement
Kaizen events are intensive, short-term projects that deliver rapid, measurable improvements in organizational processes. This comprehensive how-to guide walks you through every step of planning, executing, and sustaining successful Kaizen events, from selecting the right opportunity and assembling cross-functional teams to implementing changes and measuring results.
How to Successfully Close and Recognize Your Lean Six Sigma Projects: A Complete Guide
Closing a Lean Six Sigma project properly ensures sustainability and team motivation. This comprehensive guide walks you through seven essential steps for effective project closure and recognition, complete with real-world examples and data-driven strategies that create lasting organizational impact.
How to Implement Effective Labelling Standards in Your Organization: A Comprehensive Guide
This comprehensive guide walks you through implementing effective labelling standards in your organization, from initial assessment to continuous improvement. Learn how proper labelling reduces errors, improves efficiency, and supports operational excellence while discovering how Lean Six Sigma methodology enhances labelling initiatives.

D7 Preventive Measures: A Complete How-To Guide for Sustainable Problem Prevention
D7 Preventive Measures represent the critical seventh step in the 8D problem-solving framework, focusing on preventing similar problems from occurring across an organization. This comprehensive how-to guide provides step-by-step instructions, real-world examples, and practical validation metrics to help you implement effective preventive actions that create lasting organizational improvement and competitive advantage.
Complete Guide to Floor Marking: How to Implement Effective Visual Management in Your Workplace
This comprehensive guide provides detailed instructions for implementing effective floor marking systems that enhance workplace safety and operational efficiency. Learn the step-by-step process from planning and design through application and maintenance, including practical examples and measurable results.
D6 Implementation: A Complete How-To Guide for Successful Process Improvement
D6 Implementation transforms theoretical solutions into tangible process improvements. This comprehensive guide walks you through eight critical steps for successful implementation, from detailed planning and pilot testing to performance monitoring and transition to control, complete with practical examples and sample datasets.

How to Create a Visual Workplace: A Complete Guide to Improving Efficiency and Safety
A visual workplace transforms organizational efficiency by communicating critical information through visual signals rather than written or verbal communication. This comprehensive guide provides step-by-step instructions for implementing visual workplace strategies, complete with real-world examples and measurable outcomes that demonstrate significant improvements in quality, productivity, and safety.
D5: How to Implement Permanent Corrective Actions in Problem-Solving
Discover how to implement D5: Permanent Corrective Actions in the 8D problem-solving methodology. This comprehensive guide provides step-by-step instructions, practical examples, and proven strategies for creating lasting solutions that eliminate root causes and prevent problem recurrence in your organization.

The Lean Executive: 3 Habits that Separate Top-Tier Leaders from the Rest
In the realm of high-performance business, there is a distinct line between a manager who...

Does a Six Sigma White Belt Really Matter in 2026? (Plus a Free Practice Test)
In the realm of modern organizational excellence, the question often arises: is an entry-level...

7 Mistakes You’re Making With Your Lean Six Sigma Black Belt Online Training
In the realm of operational excellence, the Lean Six Sigma Black Belt is more than just a title;...
Struggling For Clarity? 25 Good Problem Statement Examples to Kickstart Your Project
In the realm of organizational excellence, the most critical failure point of any improvement...
Voice of Process Secrets Revealed: How Quality 4.0 Makes Your Data Talk Back
In the realm of modern organizational efficiency, there is a silent narrator constantly telling...
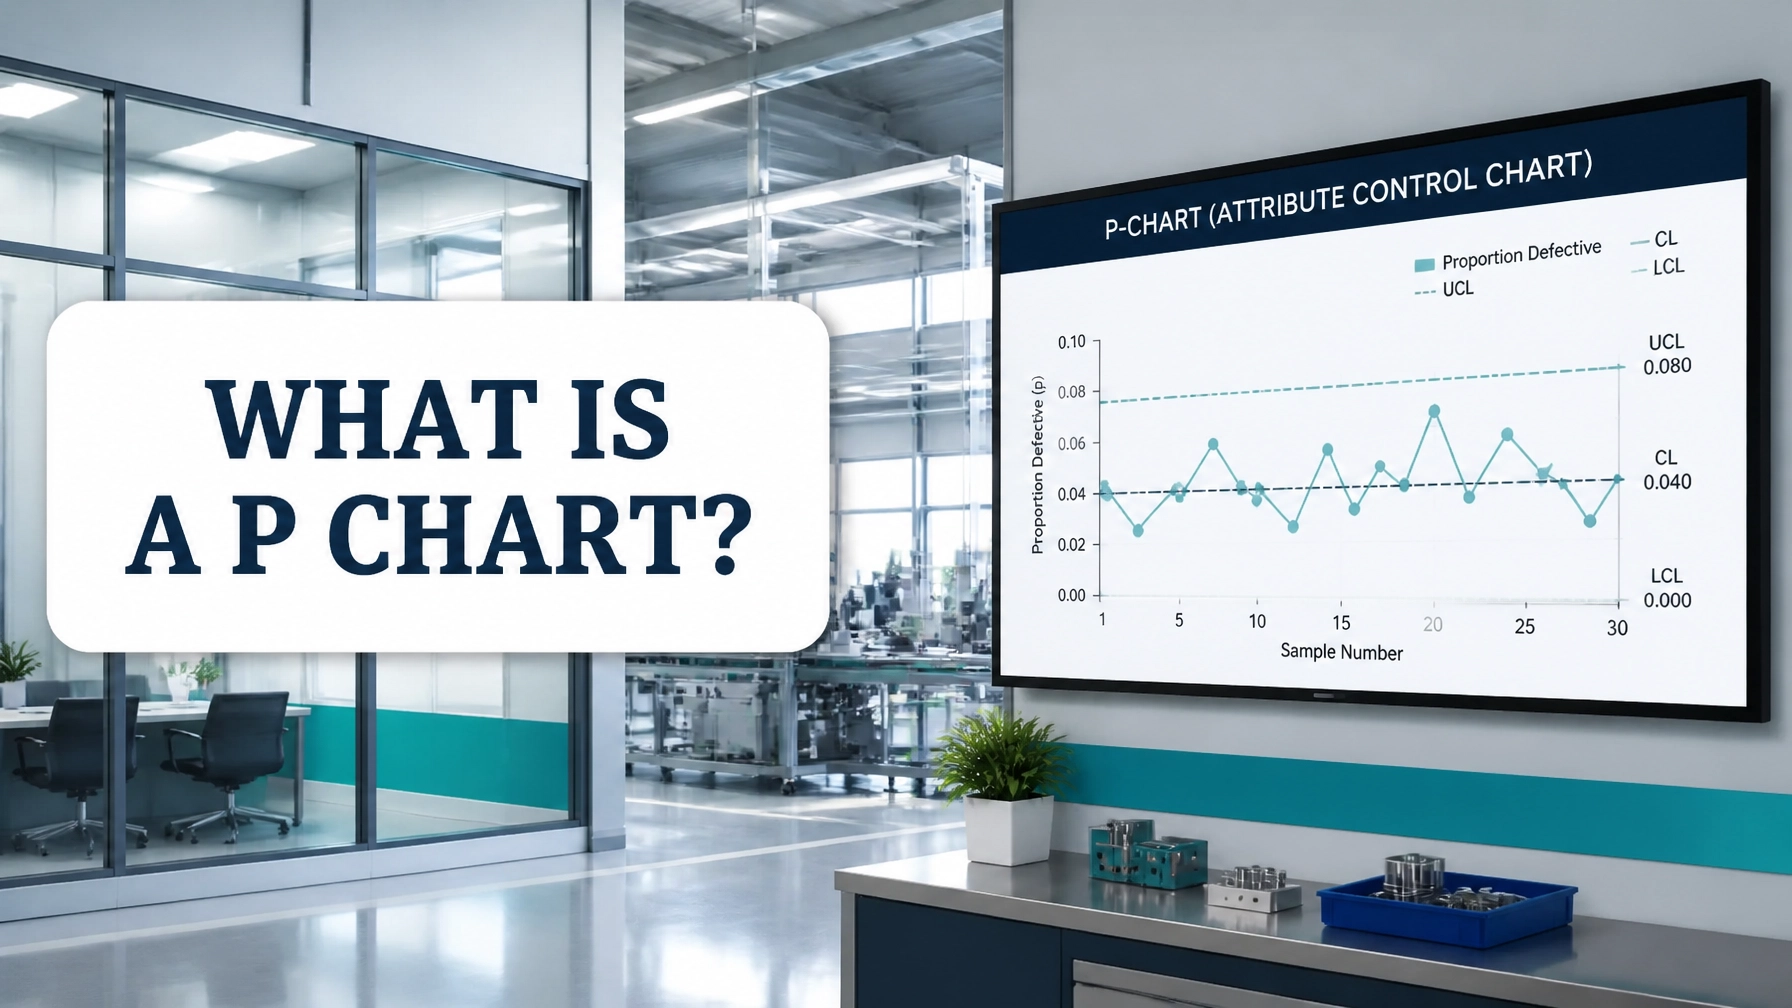
What is a P Chart? Explained in Under 3 Minutes (With Real-World Examples)
In the realm of process improvement, data is the only currency that matters. If you aren't...

How to Implement Shadow Boards: A Complete Guide to Visual Workplace Organization
Shadow boards are powerful visual management tools that eliminate wasted time searching for equipment while improving safety and reducing costs. This comprehensive guide provides step-by-step instructions for implementing shadow boards in your workplace, complete with real-world examples and measurable data demonstrating returns on investment exceeding $64,000 annually for typical facilities.

How to Master D4 Root Cause Analysis: A Complete Guide to Problem-Solving in Six Sigma
D4 Root Cause Analysis is a critical step in the 8D problem-solving methodology that identifies the fundamental reasons why problems occur. This comprehensive guide walks you through essential techniques including the Five Whys and Fishbone Diagrams, complete with practical examples and real data sets to help you master effective root cause identification and drive lasting improvements in your organization.

Red Tag Strategy: A Complete How-To Guide for Workplace Organization and Waste Reduction
The Red Tag Strategy offers a systematic approach to identifying and eliminating unnecessary items from the workplace through visual management. This comprehensive guide provides step-by-step implementation instructions, practical examples, and sample data demonstrating how organizations can transform cluttered workspaces into streamlined, productive environments using this powerful Lean Six Sigma tool.

D3 Interim Containment: A Complete How-To Guide for Problem-Solving Success
D3 Interim Containment is a critical step in the 8D problem-solving methodology that protects customers while you develop permanent solutions. This comprehensive how-to guide walks you through implementing effective containment actions with real-world examples and practical steps you can apply immediately.

How to Implement Sustain (Shitsuke): A Complete Guide to the Fifth S in 5S Methodology
Sustain (Shitsuke) represents the crucial fifth step in 5S methodology that transforms temporary workplace improvements into permanent organizational habits. This comprehensive guide provides practical steps for implementing Sustain, including establishing metrics, conducting audits, creating visual controls, and building recognition systems that ensure lasting success.
How to Write an Effective D2 Problem Description in DMAIC: A Complete Guide
The D2 Problem Description is a critical component of the DMAIC methodology that sets the foundation for successful process improvement projects. This comprehensive guide provides practical steps, real-world examples, and sample datasets to help you craft clear, data-driven problem descriptions that lead to measurable results.
How to Implement Standardise (Seiketsu): A Complete Guide to the Fourth Pillar of 5S
Standardise (Seiketsu) is the fourth pillar of the 5S methodology that transforms temporary workplace improvements into permanent practices. This comprehensive guide walks you through implementing standardization with practical examples, detailed procedures, and proven strategies to ensure lasting organizational change and operational excellence.
How to Build High-Performing Teams: A Complete Guide to DMAIC Team Formation
Forming effective teams represents a critical success factor in Lean Six Sigma projects. This comprehensive guide walks you through the essential steps for strategic team formation during the Define phase of DMAIC, covering roles, selection criteria, and proven methodologies for building high-performing improvement teams.

How to Master Shine (Seiso): A Complete Guide to the Third Pillar of 5S Workplace Organization
Shine (Seiso) represents the third pillar of the 5S methodology and serves as a critical driver of operational excellence. This comprehensive how-to guide provides practical, step-by-step instructions for implementing Shine in any workplace, complete with real-world examples and measurable results that demonstrate how systematic cleanliness transforms into proactive inspection, prevention, and continuous improvement.

D0 Prepare: A Complete Guide to Launching Your Six Sigma Problem-Solving Journey
The D0 Prepare phase serves as the critical foundation for Six Sigma project success, establishing clear problem definitions, stakeholder alignment, and resource allocation before formal project launch. This comprehensive guide demonstrates how proper preparation transforms vague concerns into structured improvement opportunities that deliver measurable business results.

Beyond the Practice Test: The Raw Reality of Master Black Belt Training
In the realm of professional process improvement, there is a distinct and formidable line between...
Paper Belts vs. Performance: The Truth About Lean Six Sigma Certification
In the realm of modern business, the term "certification" has become a double-edged...

Killer Problem Statement Examples: Stop Solving the Wrong Problems
In the realm of process improvement, there is a hard truth that many practitioners learn too late:...
The Stealth Kaizen Roadmap How do you transition from "Corporate Fluff" to a Stealth...

The OEE Lie: Why “World Class” 85% is Just a Number
In the realm of modern manufacturing and process optimization, there is a number that has been...

Set in Order (Seiton): A Complete Guide to Organizing Your Workplace for Maximum Efficiency
Set in Order (Seiton) is the second pillar of the 5S methodology that transforms clean workspaces into organized, efficient environments where every item has a designated place. This comprehensive guide provides step-by-step instructions, real-world examples, and practical strategies to implement Seiton principles in any workplace, reducing wasted time and improving productivity.

How to Master the 8D Methodology: A Complete Guide to Problem-Solving Excellence
The 8D methodology offers a systematic approach to solving complex organizational problems permanently. This comprehensive guide walks you through all eight disciplines with practical examples, sample data sets, and actionable strategies to implement this powerful problem-solving framework in any industry.

How to Master Sort (Seiri): A Complete Guide to the First Step of 5S Methodology
Sort (Seiri) forms the critical first step in the 5S methodology, enabling organizations to eliminate clutter and create efficient workspaces. This comprehensive guide walks you through implementing Sort systematically, from defining your workspace to measuring results, with real-world examples demonstrating how proper sorting transforms productivity and safety.

How to Master Problem Solving Methods: A Complete Guide for Better Decision Making
Learn proven problem solving methods that deliver real results. This comprehensive guide covers step-by-step frameworks including the Five Step Method, DMAIC, and 8D approach, complete with practical examples and data-driven techniques to help you tackle challenges effectively in any professional setting.

How to Implement the 5S Methodology: A Complete Guide to Workplace Organization and Efficiency
The 5S methodology offers a systematic approach to workplace organization that improves efficiency, reduces waste, and enhances productivity. This comprehensive guide walks you through implementing each of the five steps—Sort, Set in Order, Shine, Standardize, and Sustain—with practical examples and measurable results from real-world applications across various industries.

SMED Excellence: How to Slash Changeover Times and Boost Agility
In the realm of modern manufacturing and high-velocity service environments, the ability to pivot...
Six Sigma Data Visualization: Telling a Story That Moves the Boardroom
In the realm of organizational excellence, the ability to analyze data is only half the battle....
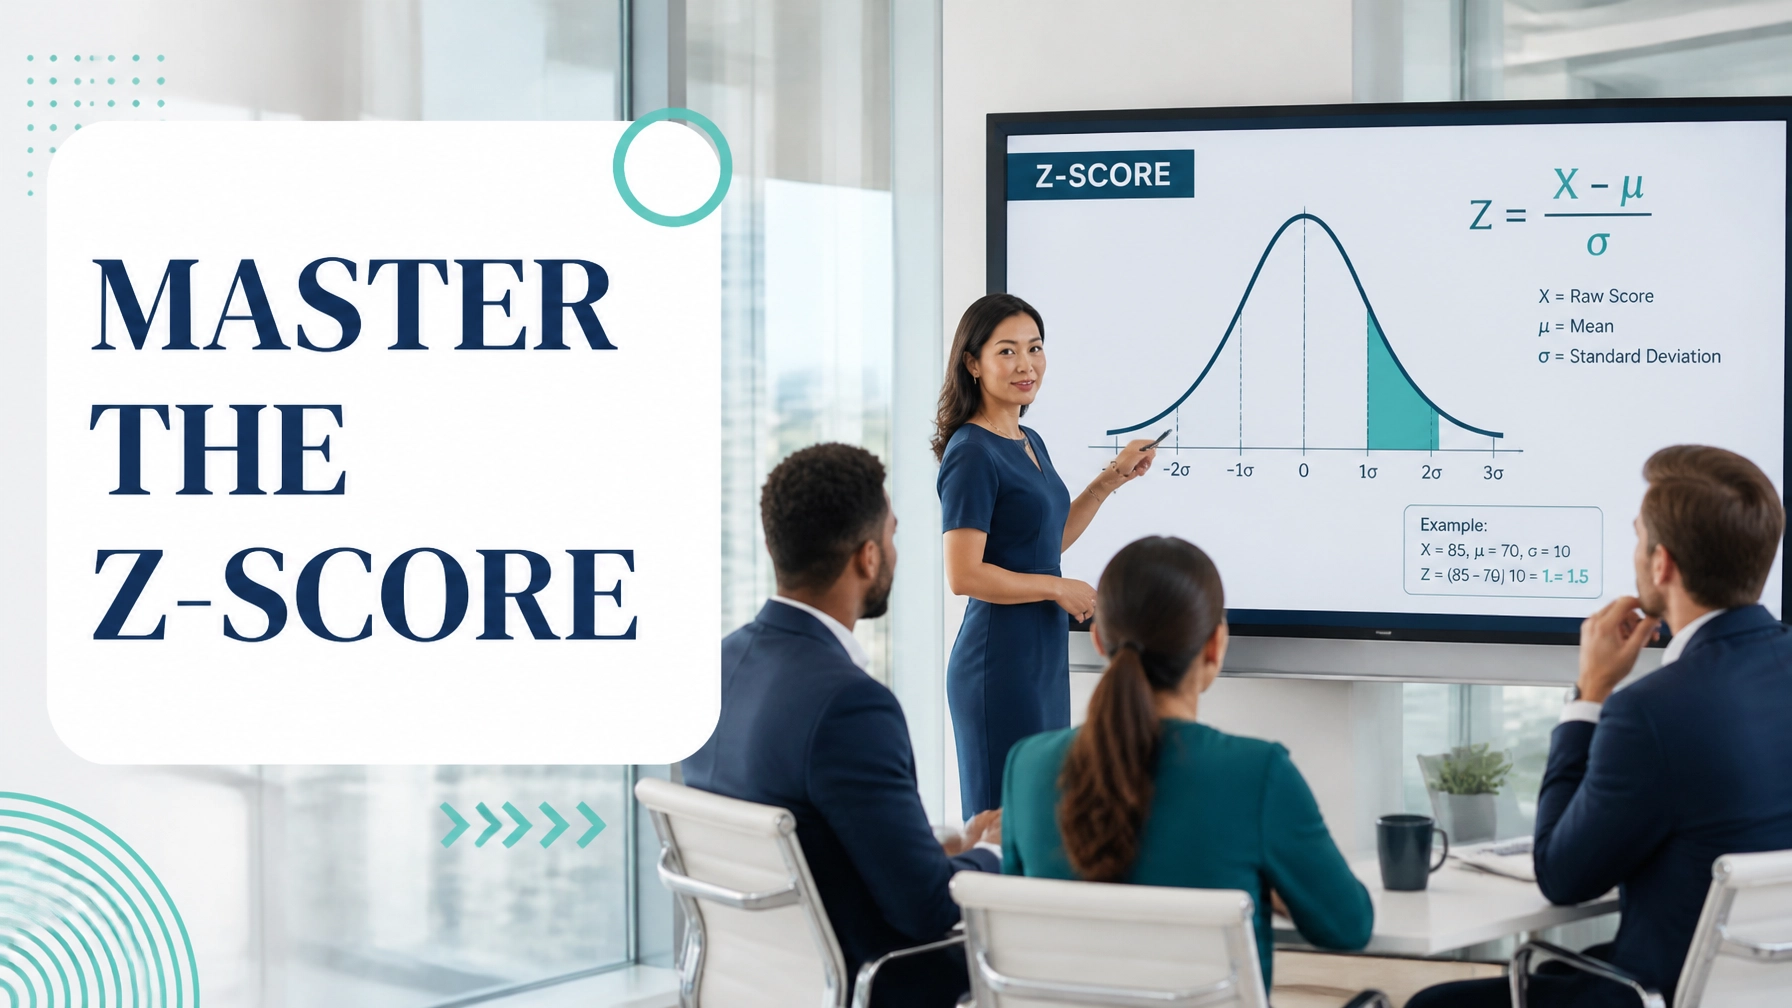
The Power of the Z-Score: Mastering Global Process Benchmarking
In the realm of organizational excellence, leaders often face a daunting challenge: how do you...

The Critical Alignment: Bridging the Gap Between VOC and Voice of the Process
In the realm of operational excellence, the most dangerous distance is not the physical space...

Agile Lean Six Sigma: The Hybrid Framework for Rapid Organizational Transformation
In the realm of modern organizational design, the friction between speed and stability is often...
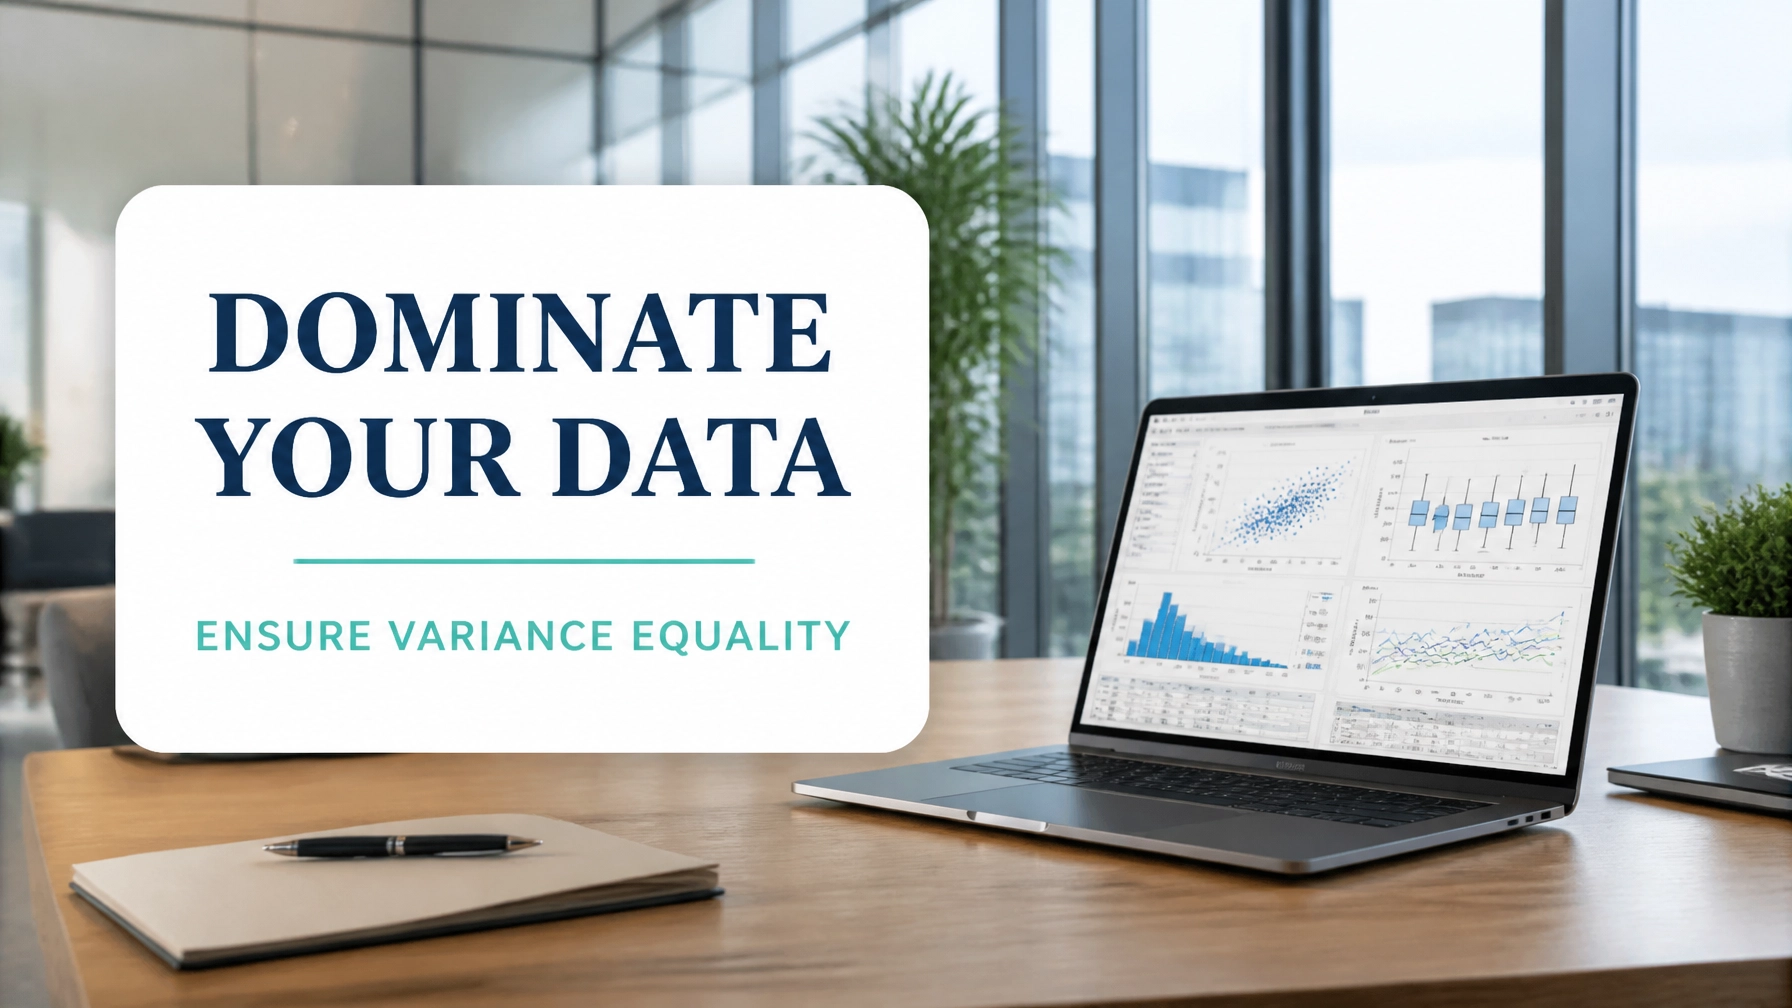
Statistical Supremacy: Why Bartlett’s Test is Non-Negotiable for ANOVA
In the realm of high-stakes process improvement, the difference between a project that saves...
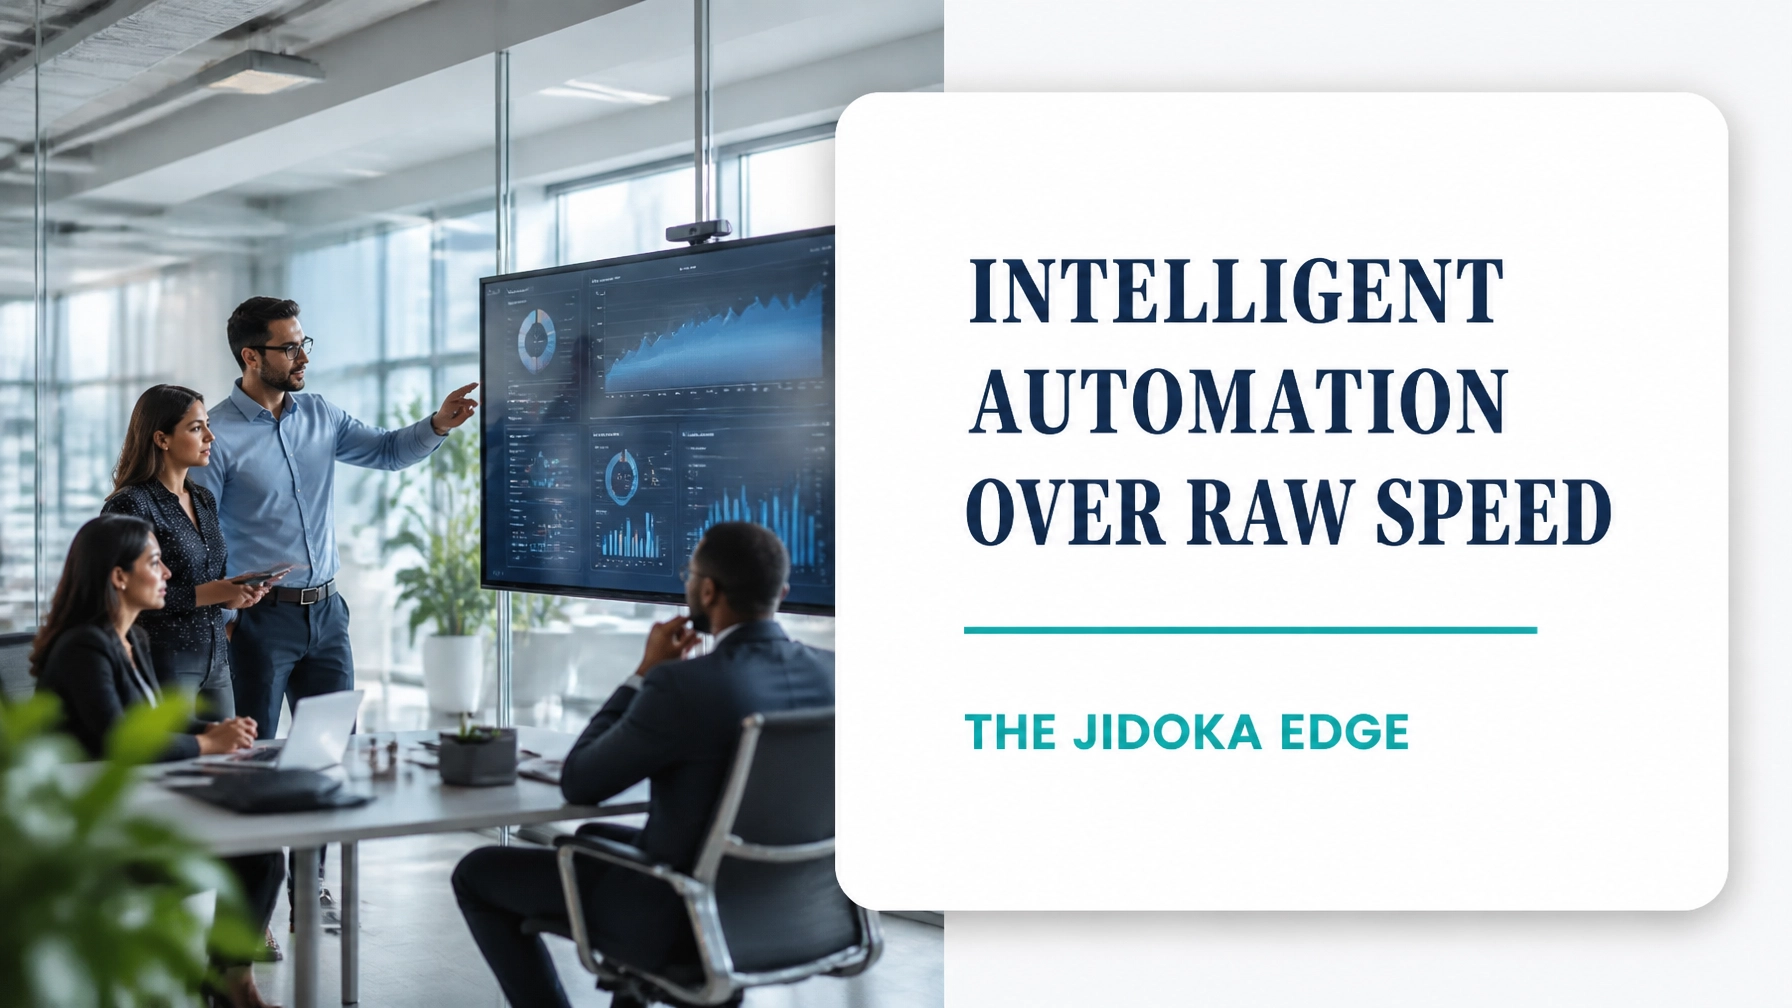
The Jidoka Edge: Why Intelligent Automation Trumps Raw Speed
In the realm of modern process improvement, there is a dangerous misconception that speed is the...
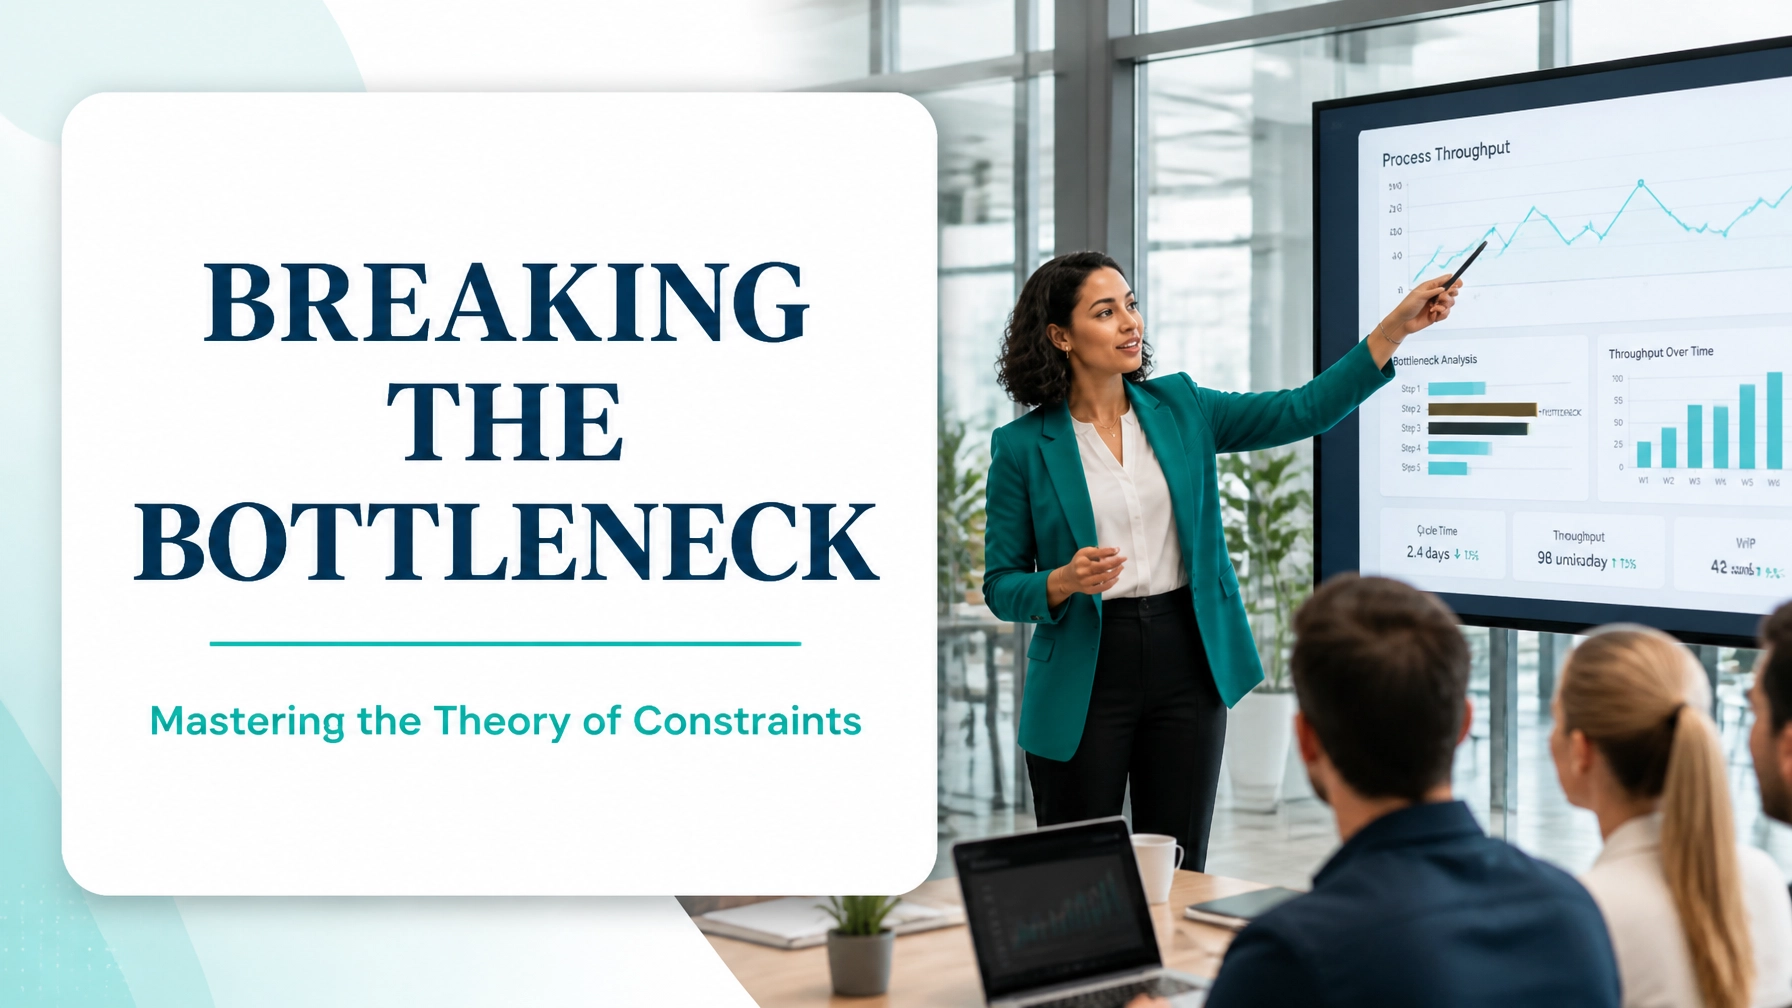
The Theory of Constraints: Breaking the Bottleneck to Unlock Exponential Throughput
In the realm of operational excellence, efficiency is often mistaken for local optimization. Many...

The 8th Waste: Unlocking the Untapped Power of Your People’s Talent
In the realm of process improvement, the traditional framework of Lean: originally developed...

Heijunka Mastery: The Secret to Leveling Demand in a Volatile Market
In the realm of operational excellence, most organizations are perpetually stuck in a reactive...
How to Use Little’s Law to Transform Your Business Operations: A Complete Guide
Little’s Law provides a powerful framework for understanding the relationship between work in progress, throughput, and cycle time in any business process. This comprehensive guide demonstrates how to apply this fundamental principle using real-world examples and practical steps to transform your operational performance.

How to Implement Essential Lean Tools to Transform Your Business Operations
This comprehensive guide explains how to implement essential lean tools to transform business operations. Learn practical applications of Value Stream Mapping, 5S, Kaizen, Kanban, and other proven methodologies with real-world examples and actionable steps for eliminating waste and improving efficiency.
How to Conduct Time Value Analysis: A Complete Guide to Optimizing Your Business Processes
Time Value Analysis is a powerful methodology for identifying waste and optimizing business processes. This comprehensive guide walks you through eight essential steps to conduct effective analysis, complete with practical examples and sample data that demonstrate how to calculate process cycle efficiency and identify improvement opportunities.
How to Organize Your Workplace for Maximum Efficiency and Productivity
Discover proven methodologies for transforming your workplace into an organized, efficient environment. This comprehensive how-to guide provides practical steps, real-world examples, and measurable strategies for dramatically improving workspace productivity and reducing wasted time through systematic organization.
How to Implement an Effective Performance Rating System in Your Organization
Performance rating is essential for organizational success, yet many companies struggle with implementation. This comprehensive guide walks you through creating an effective performance rating system using clear criteria, objective data, and practical examples to drive employee development and business results.

How to Achieve Perfect Quality in Your Organization: A Comprehensive Guide to Excellence
Perfect quality represents the ideal state where products and services consistently meet customer expectations without defects. This comprehensive guide provides a step-by-step approach to achieving near-perfect quality through clear standards, statistical process control, root cause analysis, and continuous improvement culture, demonstrating how organizations can dramatically improve quality performance through systematic methodologies.
How to Calculate and Apply Allowance Factors in Work Measurement: A Comprehensive Guide
Allowance factors are essential for creating realistic work standards that account for personal needs, fatigue, and unavoidable delays. This comprehensive guide explains how to calculate and apply allowance factors effectively, complete with practical examples and sample datasets to help you implement accurate work measurement systems in your organization.
How to Improve Resource Efficiency in Your Organization: A Comprehensive Step-by-Step Guide
Resource efficiency is essential for maintaining competitive advantage and ensuring sustainable operations. This comprehensive guide provides step-by-step instructions for improving resource efficiency in your organization, complete with real-world examples, sample data sets, and actionable strategies that deliver measurable results.

How to Calculate and Apply Normal Time in Work Measurement: A Complete Guide
Normal time calculation is a fundamental skill in operations management and industrial engineering. This comprehensive guide provides step-by-step instructions for calculating normal time, complete with practical examples and real data sets that demonstrate how to establish accurate work standards for any task or process.

How to Master Flow Efficiency: A Complete Guide to Streamlining Your Process Performance
Flow efficiency measures how much time actually adds value versus total process time. Most organizations operate at only 5-15% flow efficiency, meaning 85-95% of time is waste. This comprehensive guide teaches you how to measure, analyze, and dramatically improve flow efficiency using practical examples and proven methodologies.

How to Accurately Measure and Analyze Observed Time in Process Improvement
This comprehensive guide explains how to measure and analyze observed time in any process, providing practical steps, real-world examples, and sample datasets. Learn to transform time data into actionable insights that drive operational excellence and business results.
How to Identify and Manage Required Non-Value Added Activities in Your Business Process
Required non-value added activities do not directly create customer value but are necessary for operations, compliance, or quality assurance. This comprehensive guide explains how to identify, analyze, and optimize these activities to improve efficiency while maintaining necessary standards and controls.

How to Calculate and Implement Standard Time in Your Organization: A Complete Guide
Standard time calculation is essential for establishing productivity benchmarks and driving operational efficiency. This comprehensive guide walks you through the step-by-step process of calculating standard time, complete with practical examples and implementation strategies for your organization.
How to Identify and Maximize Business Value Added in Your Organization
Business Value Added represents activities essential for running your business but not directly valued by customers. This comprehensive guide explains how to identify, measure, and optimize BVA activities to improve operational efficiency and profitability through systematic process analysis and proven improvement strategies.

How to Conduct a Time Motion Study: A Complete Guide for Process Improvement
A time motion study is a powerful tool for analyzing work processes and identifying improvement opportunities. This comprehensive guide provides step-by-step instructions for conducting effective time motion studies, complete with practical examples and sample datasets that demonstrate how to measure, analyze, and optimize task performance in any workplace setting.
The Executive’s Guide to Hoshin Kanri: Aligning Vision with Tactical Excellence
In the realm of modern enterprise management, the most pervasive challenge is not a lack of...
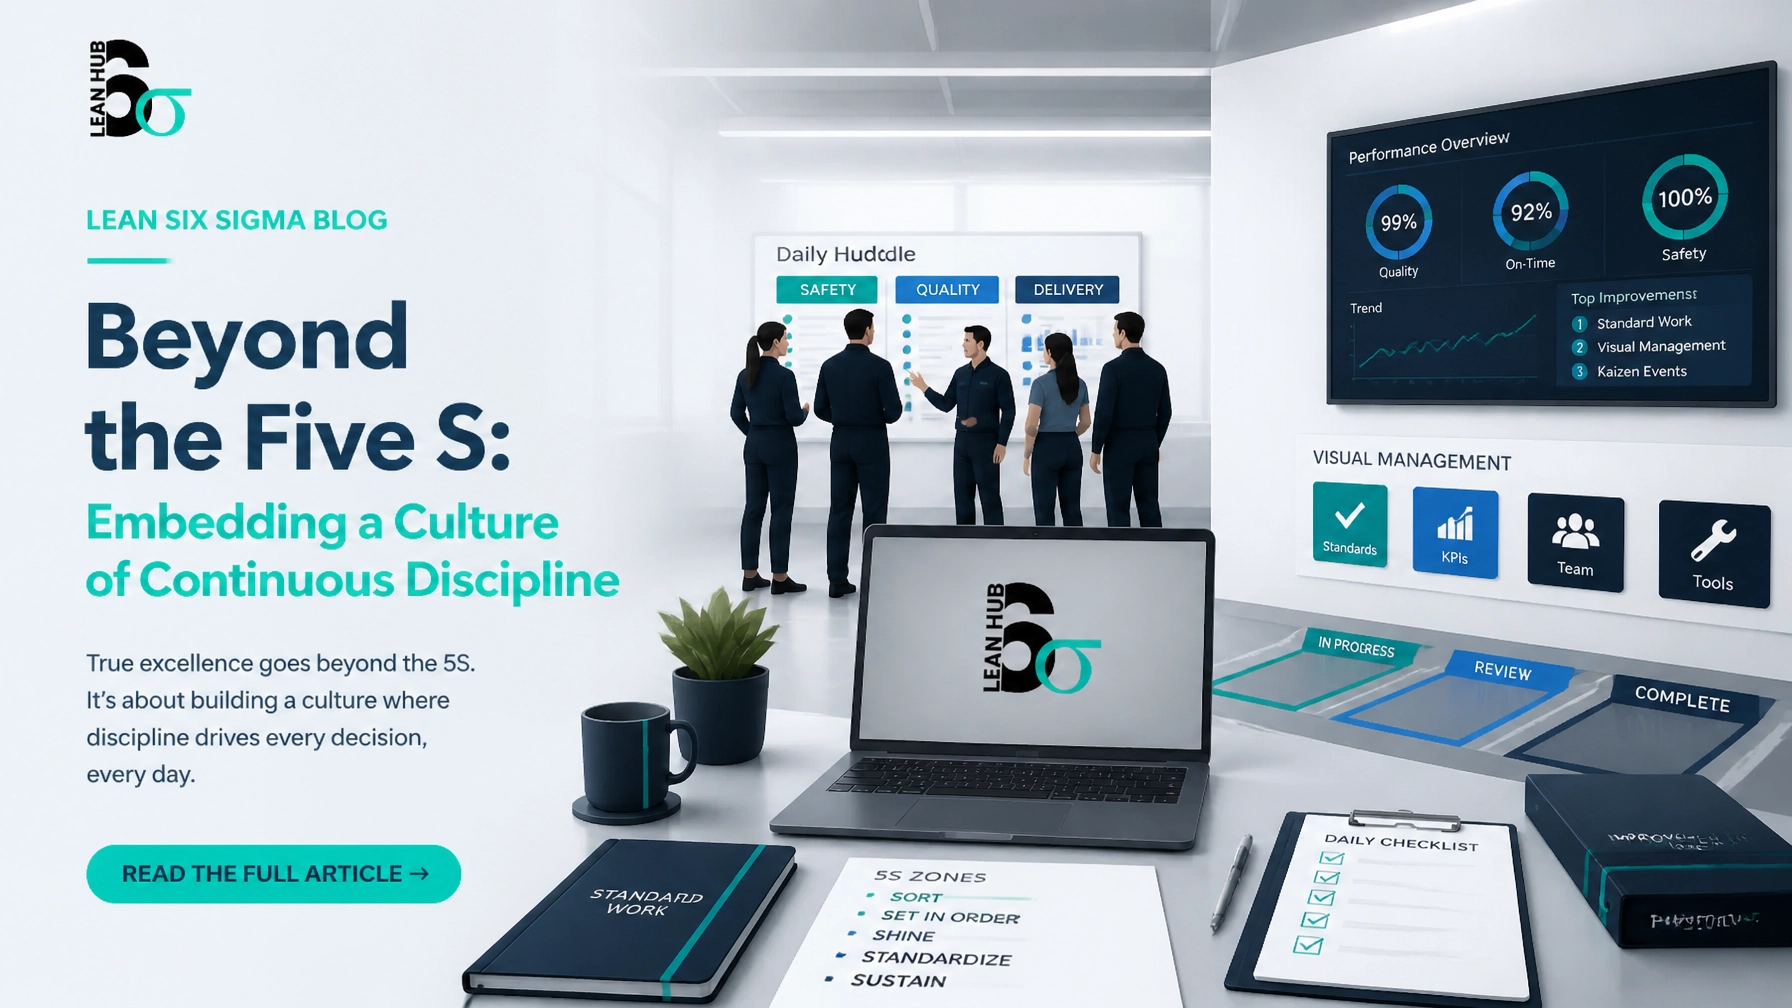
Beyond the Five S: Embedding a Culture of Continuous Discipline
In the realm of operational excellence, the 5S methodology is frequently misunderstood as a simple...

Financial Impact Mapping: Translating Six Sigma Wins into Boardroom Metrics
In the realm of operational excellence, there is a recurring tragedy: a Black Belt delivers a...

Lean Logistics: The Hidden Lever for Scaling Global Operations
In the realm of global commerce, the ability to scale operations is often the primary...

The Master Black Belt Mindset: Orchestrating Enterprise-Level Transformation
In the realm of operational excellence, there exists a profound cognitive divide between the...

How to Identify and Eliminate Non-Value Added Time in Your Business Processes
Non-value added time represents a significant hidden cost in business operations, often consuming over 90% of total process time. This comprehensive guide explains how to systematically identify, measure, and eliminate waste in your processes using proven Lean methodologies, complete with practical examples and actionable strategies for immediate implementation.

How to Conduct Work Sampling: A Complete Guide to Improving Workplace Efficiency
Work sampling is a statistical technique that helps organizations analyze how employees spend their time and identify opportunities for improvement. This comprehensive how-to guide provides step-by-step instructions for conducting work sampling studies, complete with practical examples and sample datasets to help you optimize workplace efficiency.
How to Define Value in Lean Six Sigma: A Complete Guide for Process Improvement
Defining value is the foundation of successful Lean Six Sigma initiatives. This comprehensive guide walks you through seven essential steps for identifying what customers truly value, translating needs into measurable requirements, and categorizing process activities to drive meaningful improvements in your organization.
How to Conduct a Time Study: A Complete Guide to Improving Workplace Efficiency
A time study is a systematic method for analyzing work activities and determining the most efficient way to complete tasks. This comprehensive guide walks you through conducting effective time studies with practical examples, sample data sets, and step-by-step instructions for improving workplace efficiency and establishing reliable performance standards.

How to Maximize Customer Value: A Complete Guide to Building Long-Term Business Success
Maximizing customer value is essential for sustainable business success. This comprehensive guide provides step-by-step instructions for identifying customer segments, measuring value delivery, eliminating waste, and implementing continuous improvements that enhance customer satisfaction and drive profitability.
How to Calculate and Optimize Customer Demand Rate: A Complete Guide for Business Success
Customer demand rate determines the pace at which you must produce or deliver services to meet customer needs without waste. This comprehensive guide provides step-by-step instructions for calculating demand rate, real-world examples with sample data, and practical strategies for applying this critical metric to improve operational efficiency and customer satisfaction.
How to Remove Overburden (Muri) from Your Workplace: A Complete Guide to Lean Manufacturing Excellence
Muri, or overburden, silently undermines organizational performance by pushing people, equipment, and processes beyond sustainable limits. This comprehensive guide provides a step-by-step approach to identifying, analyzing, and eliminating overburden from your workplace, complete with real-world examples and practical implementation strategies that deliver measurable results.
How to Calculate and Maximize Available Work Time: A Complete Guide to Operational Efficiency
Available work time is a critical metric for operational excellence that directly impacts productivity and profitability. This comprehensive guide teaches you how to accurately calculate available work time, avoid common mistakes, and implement optimization strategies that drive continuous improvement in any organizational setting.

How to Reduce Variation (Mura) in Your Operations: A Complete Guide to Process Optimization
Variation in business processes creates hidden costs and inefficiencies that undermine operational performance. This comprehensive guide explains how to identify, measure, and reduce Mura using proven Lean methodologies, complete with practical examples and actionable strategies for creating more stable, predictable workflows.
How to Calculate Pitch: A Complete Guide for Accurate Roof and Screw Thread Measurements
This comprehensive guide explains how to calculate pitch for various applications including roofing and mechanical threads. Learn step by step methods with practical examples and sample datasets to ensure accurate measurements and professional quality results.

How to Eliminate Waste (Muda) in Your Business: A Comprehensive Guide to Lean Efficiency
Discover how to systematically identify and eliminate the seven types of waste (Muda) in your organization using proven Lean methodology. This comprehensive guide provides practical examples, real-world data, and actionable strategies for improving efficiency and reducing costs across any industry.

How to Calculate Takt Time: A Complete Guide to Manufacturing Efficiency
Master the art of takt time calculation with this comprehensive guide. Learn the formula, avoid common mistakes, and discover how to use takt time to synchronize production with customer demand through detailed examples and practical applications.
How to Implement Continuous Improvement (Kaizen) in Your Organization: A Practical Guide
Discover how to implement Kaizen continuous improvement methodology in your organization through this comprehensive guide. Learn the five core principles, follow step-by-step implementation instructions with real-world examples, and understand how small, incremental changes create remarkable long-term results across any industry.
How to Optimize Travel Time in Business Operations: A Comprehensive Guide to Process Efficiency
Travel time represents one of the most significant opportunities for improvement in business operations. This comprehensive guide provides a step-by-step methodology for measuring, analyzing, and reducing travel time using proven process improvement techniques, complete with real-world examples and sample data demonstrating measurable results.
How to Cultivate Respect for People in the Workplace: A Comprehensive Guide to Building Better Organizations
Respect for people forms the foundation of organizational excellence and sustainable competitive advantage. This comprehensive guide provides practical, step-by-step strategies for embedding genuine respect into your workplace culture, complete with real-world examples and measurable implementation approaches that transform both human experience and business results.

How to Calculate and Reduce Rework Time: A Complete Guide to Process Improvement
Rework time drains organizational productivity and profitability across all industries. This comprehensive how-to guide provides practical steps for measuring, analyzing, and reducing rework time using proven methodologies, complete with real-world examples and actionable strategies that deliver measurable results.

How to Build a Lean Culture: A Comprehensive Guide to Transforming Your Organization
Building a lean culture requires more than implementing tools and techniques; it demands a fundamental transformation in how organizations think, work, and solve problems. This comprehensive guide provides a step-by-step approach to establishing and sustaining lean culture, from securing leadership commitment to measuring progress and overcoming common challenges.
How to Calculate and Reduce Inspection Time: A Complete Guide to Quality Control Efficiency
Inspection time is a critical metric that impacts production efficiency and quality control. This comprehensive how-to guide explains how to measure your current inspection time, analyze the data for improvement opportunities, and implement proven strategies to reduce inspection duration while maintaining or improving quality standards.
How to Transform Your Business into a Lean Enterprise: A Comprehensive Guide
Discover how to transform your organization into a lean enterprise through systematic waste elimination and value creation. This comprehensive guide provides step-by-step instructions, real-world examples, and practical strategies for implementing lean principles that reduce costs, improve quality, and enhance customer satisfaction across any industry.

How to Calculate and Reduce Delay Time: A Complete Guide to Process Optimization
Delay time represents one of the most significant factors affecting operational efficiency and customer satisfaction. This comprehensive guide teaches you how to accurately calculate delay time in your processes and provides actionable strategies to minimize delays, improve throughput, and enhance overall performance through systematic process optimization techniques.
How to Implement the Toyota Production System: A Complete Guide to Lean Manufacturing Excellence
The Toyota Production System has revolutionized manufacturing and business processes worldwide. This comprehensive how-to guide walks you through the fundamental principles and practical steps to implement TPS in your organization, from identifying waste and establishing Just-In-Time production to building quality into processes and fostering continuous improvement through kaizen.

How to Reduce Changeover Time: A Complete Guide to Faster Production Transitions
Changeover time represents one of the most significant opportunities for operational improvement in manufacturing. This comprehensive guide provides step-by-step instructions for reducing changeover time, complete with practical examples and real-world data demonstrating how organizations achieve dramatic productivity gains and cost savings through systematic changeover reduction initiatives.
How to Implement Lean Thinking in Your Organization: A Comprehensive Guide to Eliminating Waste and Maximizing Value
This comprehensive guide walks you through the essential principles and practical implementation of lean thinking, a powerful methodology for eliminating waste and maximizing customer value. Learn step-by-step processes, explore real-world case studies with measurable results, and discover how to transform your organization’s operations through systematic application of lean principles.

How to Reduce Setup Time in Manufacturing: A Complete Guide to Optimizing Production Efficiency
Setup time reduction represents one of the most significant opportunities for improving manufacturing efficiency and profitability. This comprehensive guide provides practical, step-by-step instructions for measuring, analyzing, and reducing setup time using proven methodologies from Lean Six Sigma, complete with real-world examples and sample data.

How to Master Voice of Process (VOP) Analysis: A Complete Guide for Process Improvement
Voice of Process (VOP) represents what your processes can actually deliver versus what customers expect. This comprehensive guide walks you through capturing and analyzing VOP using systematic data collection, statistical analysis, and visualization techniques to identify improvement opportunities and bridge the gap between process capability and customer requirements.

How to Reduce Processing Time: A Complete Guide to Improving Operational Efficiency
Processing time directly impacts customer satisfaction, operational costs, and competitive advantage. This comprehensive guide walks you through essential steps to analyze, measure, and reduce processing time using proven methodologies, real-world examples, and practical data-driven strategies that deliver measurable results.