In the realm of modern organizational efficiency, there is a silent narrator constantly telling the story of your business's health. While most leaders focus exclusively on the high-level financial metrics or the occasional customer complaint, the true architects of excellence are listening to something much deeper. To fully appreciate the mechanics of a world-class operation, one must master the Voice of the Process (VOP).
The fundamental purpose of listening to the VOP is to decode the statistical behavior of your workflows. It is the raw, unfiltered data that reveals how a process is actually performing compared to how you think it should perform. In the dawn of Quality 4.0, this "voice" has transformed from a stuttering series of manual logs into a high-definition, real-time stream of actionable intelligence. If you are not leveraging this data, you are essentially flying a jet in a storm without a radar.
Decoding the Language of Your Process
Before we dive into the high-tech wizardry of Industry 4.0, we must ground ourselves in the core philosophy of Lean Six Sigma. At its heart, every process is governed by the equation Y = f(x). This simple yet profound principle states that your output (Y) is a function of your critical inputs (x). To control the outcome, you must identify and control the variables.
In a traditional setting, a White Belt practitioner learns to recognize the basic existence of these variables, while a Yellow Belt supports larger projects by monitoring these inputs. However, the true "secret" of the VOP lies in understanding Variation. Every process fluctuates, but the key is distinguishing between "Common Cause" variation: the noise inherent in any stable system: and "Special Cause" variation, which signals a specific problem that requires immediate corrective action.
The Trinity of Voices: VOC, VOB, and VOP
To achieve organizational harmony, you must balance three distinct signals:
- Voice of the Customer (VOC): Structured feedback that translates into measurable critical-to-quality (CTQ) requirements. You can learn more about maximizing customer value here.
- Voice of the Business (VOB): The internal priorities, such as profitability and market share, that must be balanced with customer needs.
- Voice of the Process (VOP): The data that reveals whether your performance actually meets the expectations set by the other two voices.
When the VOP says your process is out of control, no amount of marketing (VOB) or customer service (VOC) can save you from the inevitable erosion of Value.
How Quality 4.0 Enhances the Voice of Process
We have moved past the era where data collection was a manual chore involving a clipboard and a stopwatch. Quality 4.0: the intersection of traditional quality methodologies and digital transformation (AI, IoT, Big Data): has given the VOP a megaphone.

In a Quality 4.0 environment, the Analyse Phase of a DMAIC project becomes a playground of high-velocity data. Instead of taking periodic samples, sensors on the floor provide a continuous stream of Attribute Data and variable data. This allows for Autonomation (Jidoka), where intelligent systems detect issues in real-time and respond before a single defect is produced.
Imagine a production line equipped with Andon signals that are not just lights on a pole, but digital alerts pushed directly to a Black Belt's smartwatch. This is the reality of a modern Lean enterprise.
Statistical Supremacy: Tools for the Modern Practitioner
To make sense of this mountain of data, you need the right statistical arsenal. The Average (Mean) is a starting point, but it rarely tells the whole story. To detect subtle shifts and trends, savvy practitioners look to the X-bar Chart alongside an R chart. These tools allow you to visualize the process average and range over time, ensuring that common cause variation hasn't evolved into a systemic failure.
When comparing multiple groups or machines, we employ ANOVA (Analysis of Variance) to see if there are significant differences between means. However, a seasoned pro knows to run a Bartlett's Test first to ensure that the variances are equal. If they aren't, your results might be skewed by Bias.
For a more visual summary, the Box Plot is indispensable. It provides a five-number summary (minimum, first quartile, median, third quartile, and maximum) that reveals spread, skewness, and outliers in a single glance. By calculating a Z-Score, we can standardize these distributions, enabling us to compare performance across entirely different processes or industries.
Optimizing Flow and Eliminating Waste
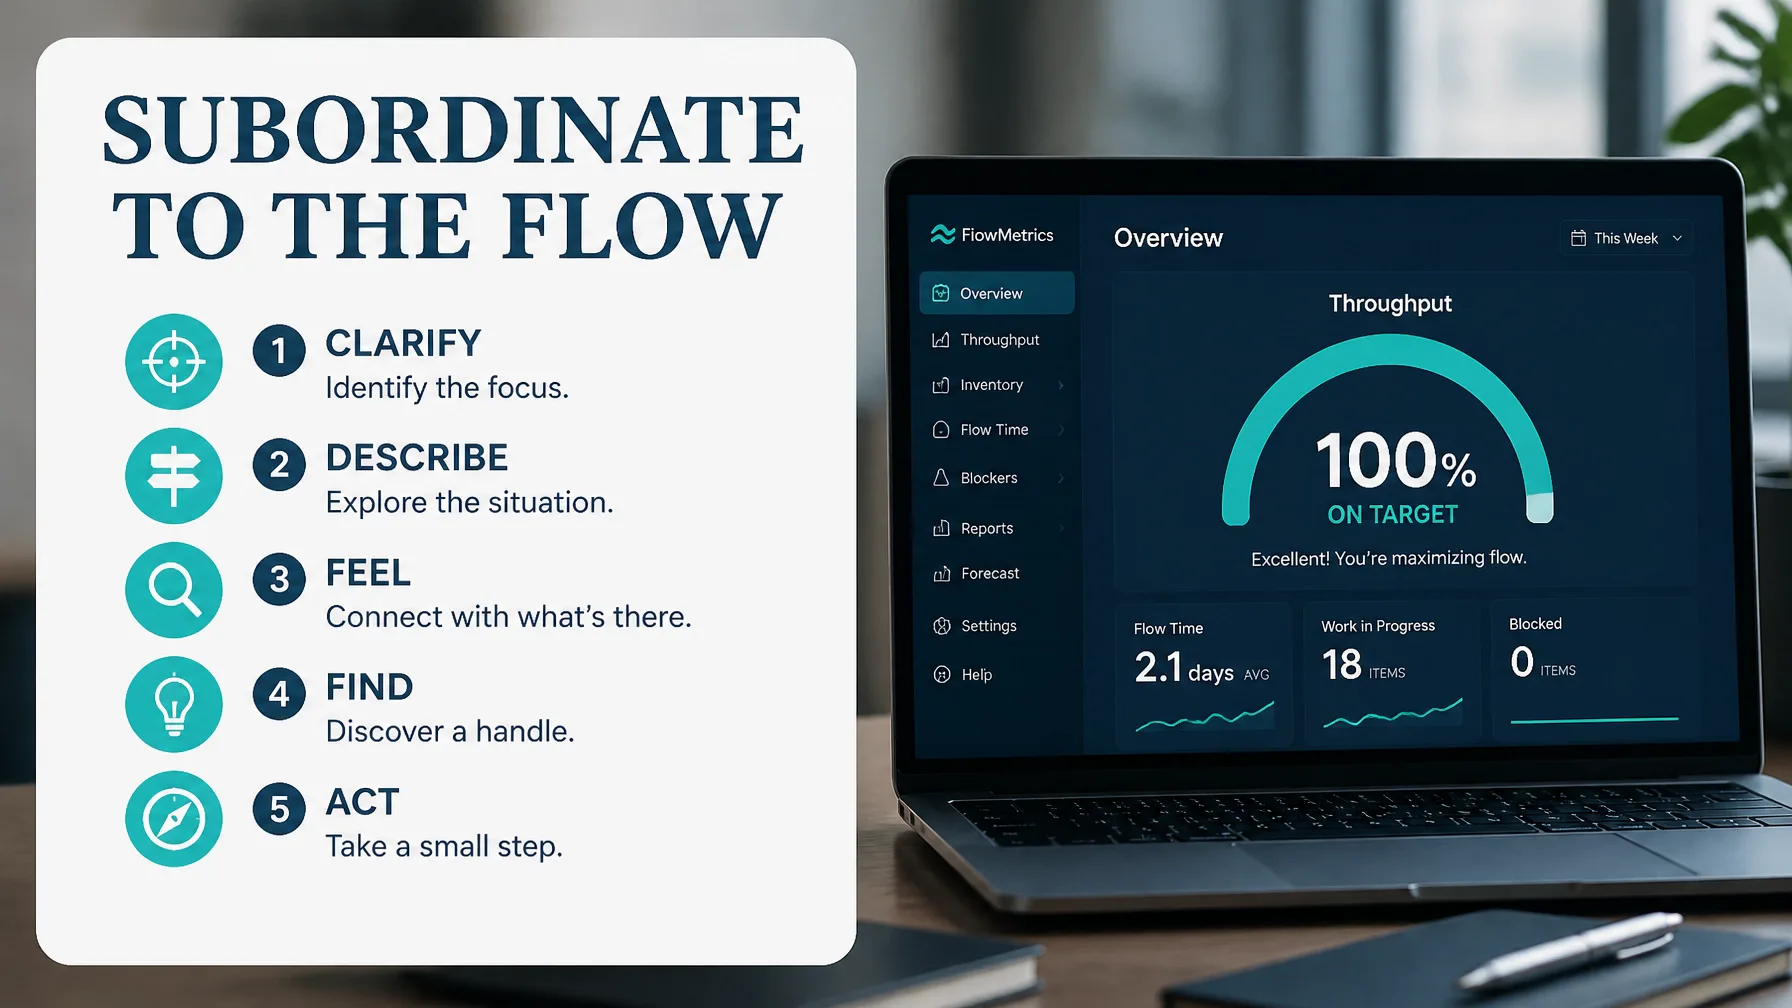
The ultimate goal of listening to the VOP is to improve Throughput and reach the pinnacle of Zero Defects. This requires a ruthless focus on eliminating Waste (Muda). Whether it is Waiting, overproduction, or excess Work in Process (WIP), waste is the friction that slows your engine.
You can identify these friction points by creating a Value Stream Map (VSM). A current state map highlights where the material and information flow is stalled, while a future state map serves as your North Star for improvement. By using a Time Observation Sheet, you can record actual step times to separate value-added work from the non-value-added "muck" that clogs your system.
Managing the Pulse of Production
- Takt Time: Dividing your available production time by customer demand sets the rhythm. If your process "heartbeat" is faster or slower than Takt Time, you have a problem.
- Theory of Constraints (TOC): Every system has a Bottleneck. Systematically improving that limiting factor is the only way to lift overall capacity.
- Yield: We track First Pass Yield (FPY) and Rolled Throughput Yield (RTY) to understand exactly how much of our output is defect-free without rework.

The Human Element: Building Enterprise Capability
While the data is vital, the people who interpret it are the true drivers of change. In a complex organization, ideas often arrive in a chaotic flood. Tools like the Affinity Diagram help teams organize large volumes of ideas into meaningful categories, allowing for a structured approach to problem-solving.
Furthermore, the modern workplace is increasingly adopting Agile methodologies. This flexible, iterative approach perfectly complements Lean Six Sigma. While LSS provides the statistical rigor, Agile ensures that we are moving at the speed of the market.
To secure the resources for these improvements, you must be able to craft a compelling Business Case. This document justifies the project by linking process improvements to the bottom line: often through a Break-Even Analysis: to secure leadership Approval.
Why Your Career Depends on This Knowledge
The transition to Quality 4.0 isn't just an organizational shift; it's a personal one. The demand for professionals who can bridge the gap between "big data" and "lean action" is skyrocketing. Whether you are leading complex projects as a Black Belt or mentoring the next generation as a Master Black Belt, your value is defined by your ability to make the data talk back.

At Lean 6 Sigma Hub, we specialize in lean six sigma online training that isn't just about passing a test. Our CSSC-accredited courses are built on real-world simulations and end-to-end case studies. We don't just teach you what a Box Plot is; we teach you how to use it to save your company six figures.
The era of "guessing" is over. The Voice of Process is calling: are you ready to listen?
Take the first step toward mastering the future of quality. Enroll in our accredited Lean Six Sigma Online Training today and become the data-driven leader your industry demands.