Introduction: What is to Value Stream Mapping (VSM)?
Value Stream Mapping (VSM) is a Lean Six Sigma tool that visually represents the flow of materials and information through a process. It is widely used to analyze, design, and improve business processes by identifying inefficiencies and eliminating waste. VSM is particularly effective in manufacturing, healthcare, and service industries, where optimizing workflows can significantly impact productivity and customer satisfaction.
Key Objectives of Value Stream Mapping
- Identify non-value-added activities (waste)
- Improve process flow efficiency
- Enhance lead times and reduce bottlenecks
- Standardize and streamline workflows
- Enable continuous process improvement
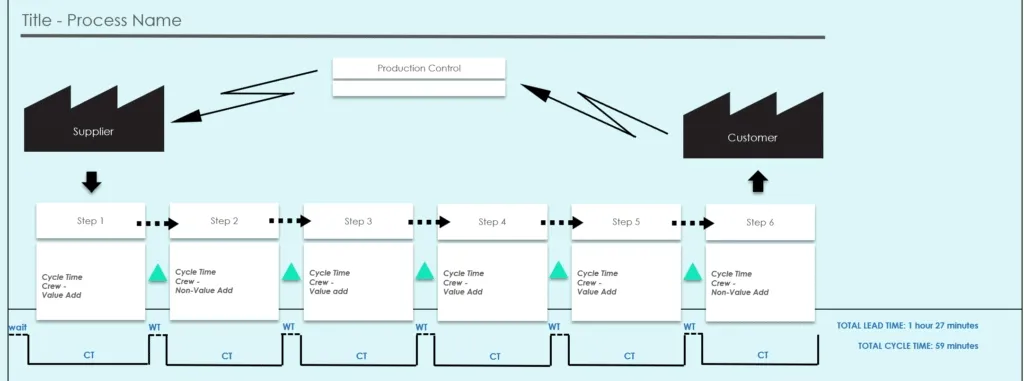
Understanding the Components of a Value Stream Map
A VSM consists of several key components:
- Customer Requirements: The map begins with customer demand and expectations.
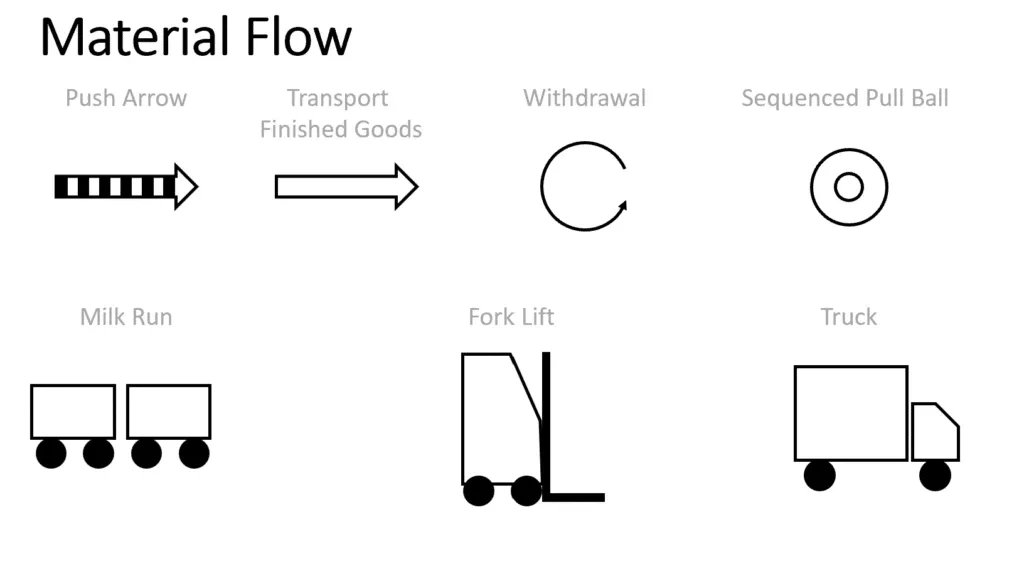
- Material Flow: Shows how raw materials move through the process.
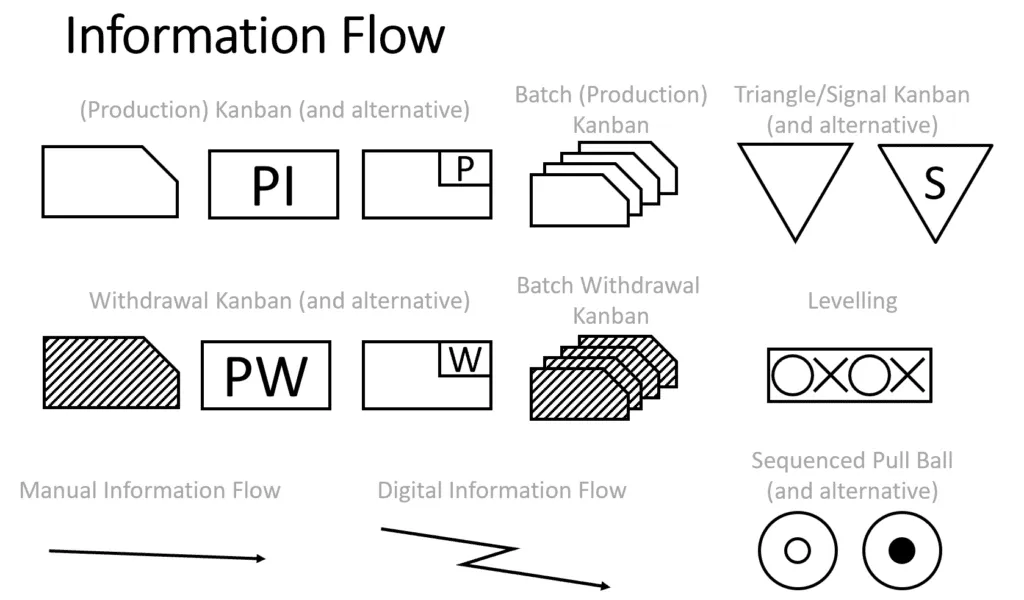
- Information Flow: Illustrates how information (e.g., orders, schedules) is transmitted.
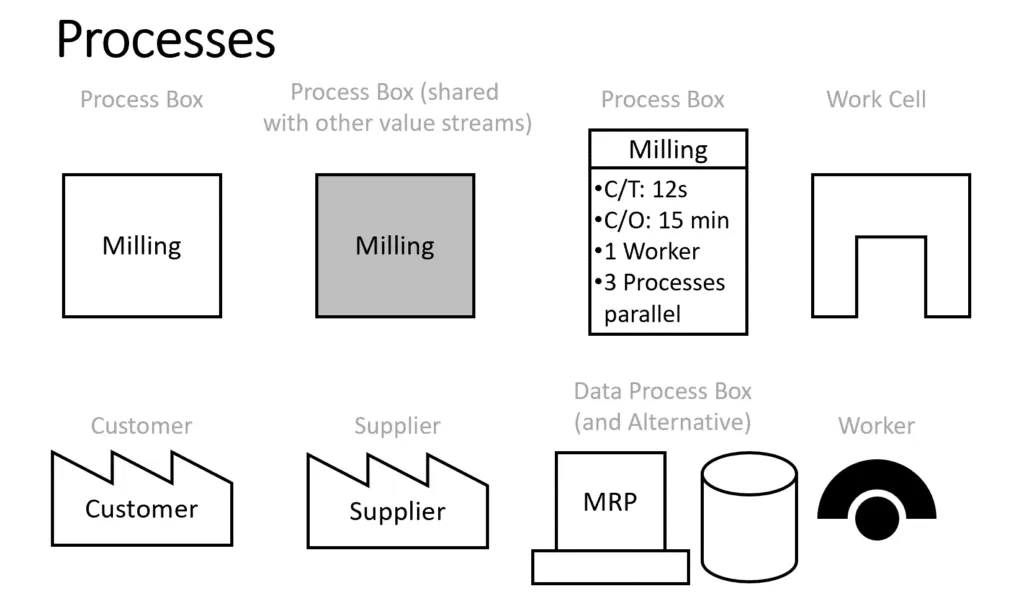
- Process Steps: Identifies each operation and activity within the process.
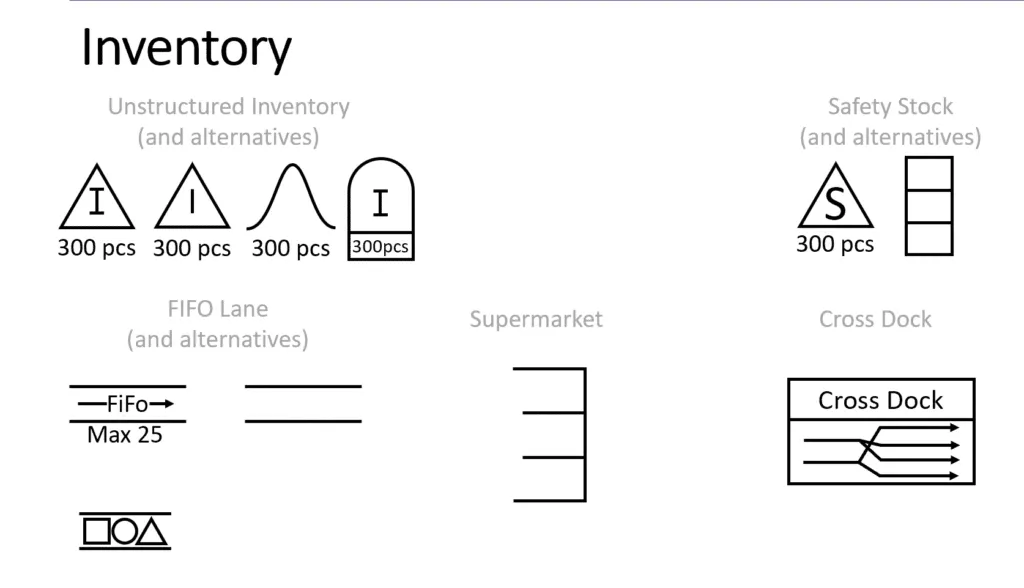
- Inventory Levels: Highlights storage and waiting areas where materials accumulate.
- Lead Time and Cycle Time: Measures the time taken for each step and the overall process.
- Value-Added vs. Non-Value-Added Time: Distinguishes productive activities from waste.
Step-by-Step Guide to Creating a Value Stream Map
Step 1: Select a Process to Map
Choose a specific process that requires improvement. Focus on a critical area with inefficiencies or waste.
Step 2: Define the Scope
Clearly outline the start and end points of the process. Define the level of detail required.
Step 3: Gather Data
Collect key data points, including:
- Cycle time (CT)
- Changeover time (CO)
- Work-in-progress (WIP)
- Lead time (LT)
- Inventory levels
Step 4: Create the Current State Map
The current state map represents the existing workflow, highlighting inefficiencies such as:
- Bottlenecks
- Delays
- Excessive handoffs
- Unnecessary rework
Step 5: Identify Waste and Areas for Improvement
Using Lean principles, categorize waste into the 8 Wastes of Lean:
- Defects: Errors requiring rework
- Overproduction: Producing more than needed
- Waiting: Delays in processing
- Non-Utilized Talent: Inefficient use of workforce
- Transportation: Unnecessary movement of materials
- Inventory: Excess stock causing inefficiencies
- Motion: Unnecessary movement of workers
- Extra Processing: Steps that add no value
Step 6: Design the Future State Map
A future state map represents an optimized process flow with reduced waste and improved efficiency. This may include:
- Streamlining communication
- Reducing batch sizes
- Implementing automation
- Improving workstation layouts
Step 7: Develop an Action Plan
Convert findings into an action plan using Kaizen events and PDCA (Plan-Do-Check-Act) cycles.
Hypothetical Case Study: Applying Value Stream Mapping in a Manufacturing Process
Scenario: Reducing Lead Time in an Automotive Assembly Line
A car manufacturing company struggles with a high lead time in their assembly line due to inefficiencies in material flow and bottlenecks in production.
Step 1: Collect Data
| Process Step | Cycle Time (CT) | Inventory (WIP) | Lead Time (LT) |
|---|---|---|---|
| Raw Material Storage | 5 min | 200 units | 1 day |
| Cutting | 10 min | 100 units | 2 days |
| Welding | 15 min | 50 units | 3 days |
| Painting | 20 min | 30 units | 2 days |
| Assembly | 25 min | 20 units | 1 day |
| Inspection | 10 min | 10 units | 1 day |
Step 2: Current State Analysis
- Long lead time (9 days)
- High work-in-progress (WIP)
- Bottlenecks in welding and painting
- Excessive waiting time in storage
Step 3: Future State Map Improvements
- Reduce WIP by implementing Just-in-Time (JIT)
- Introduce parallel processing in welding and painting
- Standardize work instructions to minimize errors
Step 4: Implement Changes
- Adjust material flow using Kanban systems
- Optimize workstation layouts to minimize movement
- Reduce batch sizes to lower inventory levels
Step 5: Measure Results
| Process Step | Cycle Time (CT) | Inventory (WIP) | Lead Time (LT) |
|---|---|---|---|
| Raw Material Storage | 5 min | 50 units | 0.5 day |
| Cutting | 8 min | 50 units | 1 day |
| Welding | 12 min | 20 units | 1.5 days |
| Painting | 15 min | 10 units | 1 day |
| Assembly | 20 min | 5 units | 0.5 day |
| Inspection | 8 min | 5 units | 0.5 day |
Data Visualization: Before and After Improvements
Lead Time Reduction Chart
I’ll generate a visualization comparing lead times before and after VSM implementation.
Lead Time Reduction Before and After VSM Implementation
The chart above illustrates the reduction in lead time for each process step after implementing Value Stream Mapping (VSM). The significant improvements in welding and painting indicate the effectiveness of the applied lean strategies.
Key Takeaways from VSM Implementation
✔ Reduced Lead Time – Overall process lead time reduced from 9 days to 4.5 days
✔ Lower Inventory Levels – Decreased WIP, leading to smoother production flow
✔ Eliminated Bottlenecks – Optimized welding and painting stations improved efficiency
✔ Enhanced Process Visibility – Clear mapping of material and information flow increased operational transparency
FAQs on Value Stream Mapping
1. How is Value Stream Mapping different from Process Mapping?
VSM focuses on the entire process flow, including material and information flow, while process mapping typically highlights task sequences without emphasizing waste elimination.
2. What industries benefit the most from VSM?
VSM is widely used in manufacturing, healthcare, logistics, and service industries to optimize workflows and reduce inefficiencies.
3. How often should VSM be performed?
VSM should be conducted whenever major process inefficiencies arise or as part of continuous improvement initiatives in Lean Six Sigma.
Conclusion
Value Stream Mapping is a powerful tool in Lean Six Sigma that helps organizations visualize, analyze, and improve their processes. By systematically identifying and eliminating waste, VSM enhances efficiency, reduces lead times, and improves overall productivity.
For more insights into Lean Six Sigma tools, visit Lean6SigmaHub.com.