When it comes to improving processes and reducing defects, Six Sigma stands as a trusted methodology. One of its powerful tools is the Z-score, a statistical measure that helps us understand how data points relate to the mean. It’s not just about numbers—it’s about uncovering insights that drive better decisions and outcomes.
By using Z-scores, we can assess process performance, identify outliers, and measure variations with precision. This makes it an essential part of Six Sigma projects, where the goal is to achieve near-perfection. Whether we’re analyzing customer satisfaction or production efficiency, Z-scores give us the clarity we need to stay on track.
Let’s dive into the connection between Z-scores and Six Sigma, exploring how this simple yet effective tool empowers us to achieve consistent, measurable improvements.
Understanding Z-Score
Z-scores represent a vital statistical measurement in Six Sigma, helping quantify how far a data point deviates from the process mean in terms of standard deviations. This metric aids in analyzing process performance and determining variability.
What Is a Z-Score?
A Z-score, also called a standard score, indicates how many standard deviations a value is from the mean of a dataset. Positive values signify points above the mean, while negative values indicate points below it. By standardizing data, Z-scores enable comparisons across different datasets and process benchmarks.
For example, in a production process where the mean defect rate is 3% with a standard deviation of 1%, a Z-score of +2 indicates a defect rate 2 standard deviations above the mean, i.e., 5%.
How Is a Z-Score Calculated?
We calculate a Z-score using the formula:
Z = (X – μ) / σ
Where:
- X is the individual data point
- μ is the population mean
- σ is the standard deviation
Using this calculation, measuring relative performance becomes straightforward. For instance, in a Six Sigma initiative evaluating cycle time, if a process mean is 10 minutes with a standard deviation of 2 minutes, and one cycle took 14 minutes, the Z-score would be:
Z = (14 – 10) / 2 = 2, which reflects a performance lag 2 standard deviations away from the norm.
By translating raw data into standardized scores, the formula streamlines identifying deviations and improving process stability.
Basics Of Six Sigma
Six Sigma is a data-driven methodology aimed at improving process performance and reducing defects. It focuses on achieving measurable quality improvements by identifying and eliminating variability.
Overview Of Six Sigma Methodology
Six Sigma follows a structured framework centered on the DMAIC phases: Define, Measure, Analyze, Improve, and Control. In the Define phase, project goals align with customer needs. In the Measure phase, we assess current performance and identify critical metrics. Analyze focuses on finding root causes of defects using data. Improve implements solutions to address identified issues. Control sustains improvements using monitoring and standardization.
The methodology relies on setting specific objectives, such as reducing the defect rate to no more than 3.4 defects per million opportunities (DPMO). This approach uses tools like process mapping, Pareto charts, and hypothesis testing to achieve desired outcomes.
Importance Of Statistical Tools In Six Sigma
Statistical tools are essential for understanding process behavior and ensuring data-driven decisions. Tools like Z-scores quantify variations and measure how a process performs relative to the desired target. These ensure proper identification of process deviations.
Control charts, regression analysis, and capability indices (Cp, Cpk) also improve precision in Six Sigma projects. For example, control charts help monitor stability in critical processes by identifying trends and anomalies over time. Without robust statistical tools, critical areas for improvement remain unaddressed, limiting potential gains.
Role Of Z-Score in Six Sigma
Z-scores play a crucial role in improving process efficiency and maintaining quality standards in Six Sigma projects. This statistical tool supports in-depth analysis and data-driven improvements.
Identifying Process Variations
Z-scores quantify deviations in individual data points from the process mean, allowing us to assess process stability. Higher absolute Z-scores indicate significant deviations, signaling potential variations or anomalies. For instance, in manufacturing, a Z-score of 3 denotes a defect occurring three standard deviations from the mean, helping identify areas for corrective action. By highlighting variances, Z-scores facilitate pinpointing inconsistencies in outputs.
Assessing Process Capability
Z-scores evaluate how well a process aligns with specifications by comparing the spread of data to process limits. When processes maintain high Z-scores, they demonstrate capability in meeting Six Sigma standards, such as producing fewer than 3.4 defects per million opportunities (DPMO). For example, a process with a Z-score of 6 shows near-perfect performance, aligning with the primary goal of Six Sigma. This measurement highlights areas requiring improvement to meet targeted benchmarks.
Enhancing Decision-Making
Z-scores improve decision-making by providing objective metrics. They bridge data interpretation and actionable insights, supporting decisions in prioritizing performance adjustments. In customer service, for example, Z-scores identify outliers in satisfaction levels, aiding in resource allocation to enhance customer experience. Since decisions rely on understanding process performance, Z-scores streamline planning and optimize outcomes.
Practical Applications Of Z-Score in Six Sigma Projects
Z-scores play a critical role in enhancing process efficiency and maintaining quality within Six Sigma projects. They empower teams to make data-driven decisions by quantifying deviations, ensuring processes stay aligned with defined performance metrics.
Quality Control and Improvement
Z-scores are vital for monitoring process stability and quality control. By identifying data points that deviate significantly from the mean, we can detect variations that may indicate process inefficiencies or quality issues. For example, if a Z-score exceeds ±3, it signifies an anomaly that warrants immediate investigation. This enables us to proactively implement corrective measures to enhance stability and minimize defects.
Analyzing Defects and Errors
Using Z-scores, we evaluate the distribution of defects or errors in a process. This analysis identifies patterns, such as frequent deviations during specific time periods or in certain process phases. For instance, a production process showing consecutive high or low Z-scores signals recurring defects in that phase. We can pinpoint root causes of these errors using this insight, resulting in targeted process improvements that address problem areas effectively.
Setting Performance Benchmarks
Z-scores help define clear, measurable performance benchmarks aligned with Six Sigma standards. Calculating Z-scores for historical performance data establishes a baseline for comparison, emphasizing areas requiring improvement. For example, achieving a Z-score of 6 corresponds to a Six Sigma level, ensuring performance reaches a 3.4 DPMO defect rate. This metric facilitates continuous improvement by setting achievable goals and monitoring progress systematically.
Advantages Of Using Z-Score In Six Sigma
Z-scores bring significant advantages to Six Sigma projects by improving the precision of analysis and supporting data-driven decision-making. They enhance the ability to assess process performance and drive effective solutions.
Improved Accuracy in Data Analysis
Z-scores measure deviations from the mean in units of standard deviation, ensuring comparative accuracy across datasets. This precision aids in identifying outliers, understanding process variability, and detecting trends in performance. For example, a Z-score of ±3 indicates a rare event that may highlight critical process anomalies. By quantifying these deviations, we minimize errors in detecting process inefficiencies or quality issues, enabling more reliable conclusions for improving operations.
Data-Driven Problem Solving
Z-scores support objective evaluations of process performance, aligning actions with quantifiable metrics. They help pinpoint root causes of defects or variations by detecting patterns in data points that deviate significantly from the mean. For instance, consistent negative Z-scores in production output can reveal systematic underperformance, prompting targeted corrective measures. This data-centric approach facilitates informed decision-making that drives efficient problem-solving and aligns process improvements with Six Sigma goals.
Limitations And Challenges
Although Z-scores are powerful tools in Six Sigma projects, there are limitations and challenges that can impact their effectiveness. Addressing these challenges is critical to ensure accurate insights and reliable decision-making.
Misinterpretation Of Z-Score
Misinterpreting Z-scores can lead to incorrect conclusions about process performance. Inexperienced users might misunderstand what positive or negative values imply, mistakenly associating these scores with good or bad performance without context. For instance, a high positive Z-score might reflect a favorable outcome in certain cases, while in others, it could signal an undesirable deviation from the mean. Clear understanding of specifications is essential to avoid misleading interpretations.
Dependency On Accurate Data
Z-scores rely entirely on the accuracy of the input data. Errors in data collection, measurement, or processing can distort Z-score calculations and undermine subsequent analyses. For example, inconsistent sampling techniques or incorrect standard deviation values can result in flawed assessments of process stability. Dependable data sources and rigorous validation processes are crucial to maintain reliability when applying Z-scores in Six Sigma initiatives.
Key Takeaways
- Z-scores are vital in Six Sigma for measuring how far data points deviate from the mean, enabling process performance evaluation and variability analysis.
- Calculating Z-scores standardizes data, allowing comparisons across datasets and identifying anomalies or outliers effectively.
- In Six Sigma projects, Z-scores help identify process variations, assess capability, and enhance decision-making through objective insights.
- Z-scores drive quality control, defect analysis, and performance benchmarking, supporting continuous improvement efforts aligned with Six Sigma goals.
- Leveraging Z-scores improves data accuracy and problem-solving but requires accurate input and proper interpretation to avoid misleading conclusions.
Hypothetical Scenario: Manufacturing Precision Parts
Let’s imagine a manufacturing company that produces parts for medical devices. These parts need to have a very specific diameter of 10 centimeters (cm). Any significant deviation from this target diameter can render the part unusable.
They implement a Six Sigma initiative to improve the consistency and quality of their production process. They collect data on the diameter of 1,000 manufactured parts. The mean diameter is 10 cm, and the standard deviation is 0.2 cm.
They then calculate the Z-score for each part. This allows them to:
- Visualize the Distribution: By plotting the Z-scores, they can see how the part diameters are distributed around the mean. This helps them understand the variability in their process.
- Identify Problematic Parts: Parts with Z-scores far from zero (e.g., greater than 2 or less than -2) are flagged as potential outliers. These parts might need to be inspected more closely or reworked.
- Monitor Process Stability: By tracking Z-scores over time, they can monitor if their manufacturing process remains stable or if it starts to drift away from the target mean.
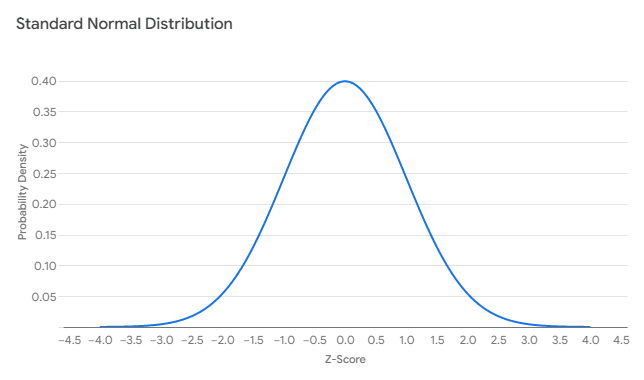
Here’s a visualization of the standard normal distribution
In this graph, the probability density is highest for values close to the mean (where the Z-score is 0) and decreases for values further away from the mean.
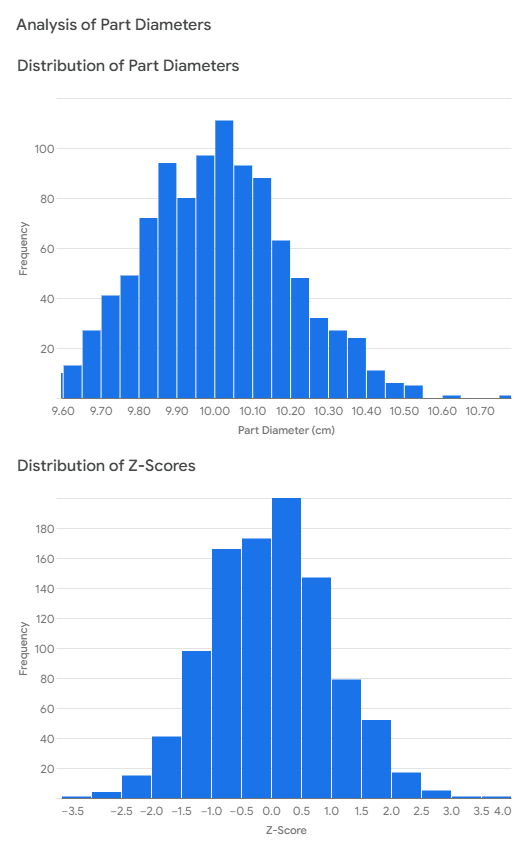
Let’s take a look at the distribution of the part diameters and their corresponding Z-scores
The distribution of part diameters gives us a general overview of the process variability. The Z-score distribution provides a standardized view of this variability, allowing for easier comparison and analysis.

Conclusion
Z-scores play a pivotal role in the success of Six Sigma projects by offering a clear, measurable way to assess process performance and variability. Their ability to identify deviations and outliers ensures that we can make informed, data-driven decisions to enhance efficiency and quality.
When applied correctly, Z-scores help us align processes with Six Sigma goals, driving consistent improvements and maintaining high standards. By leveraging this powerful tool alongside other statistical methods, we can achieve greater precision, stability, and control in our processes while minimizing defects.
Frequently Asked Questions
What is Six Sigma?
Six Sigma is a data-driven methodology focused on improving processes and reducing defects by identifying and addressing variations. It uses tools like Z-scores to achieve near-perfection, with the goal of reducing defects to no more than 3.4 defects per million opportunities (DPMO).
What is a Z-score and why is it important in Six Sigma?
A Z-score quantifies how far a data point is from the process mean in standard deviations. It’s crucial in Six Sigma for assessing process performance, identifying outliers, and measuring variation, enabling data-driven improvements and consistent quality control.
How are Z-scores calculated?
Z-scores are calculated using the formula: Z = (X – μ) / σ, where X is the data point, μ is the mean, and σ is the standard deviation. This helps compare individual values relative to the overall process performance.
How do Z-scores help identify process anomalies?
Z-scores exceeding ±3 typically indicate significant deviations or anomalies in a process. These outliers signal areas that need immediate investigation to improve process efficiency and maintain quality standards.
How does Six Sigma use the DMAIC framework?
DMAIC (Define, Measure, Analyze, Improve, Control) is the structured framework of Six Sigma. It helps set goals aligned with customer needs, measure performance, analyze root causes of defects, implement solutions, and sustain improvements.
What are some tools used in Six Sigma besides Z-scores?
In addition to Z-scores, Six Sigma utilizes tools like control charts to monitor stability, regression analysis to identify relationships, and capability indices (Cp, Cpk) to measure process efficiency and alignment with specifications.
What are the limitations of using Z-scores in Six Sigma?
Z-scores depend on accurate data, and errors in data collection or processing can distort results. Additionally, inexperienced users may misinterpret Z-scores without considering context, leading to incorrect conclusions about process performance.
How do Z-scores improve decision-making in Six Sigma projects?
Z-scores provide objective metrics for assessing process variability and spotting deviations. This helps identify root causes of defects, evaluate process stability, and develop data-driven solutions aligned with Six Sigma standards.
Can Z-scores help set performance benchmarks in Six Sigma?
Yes, Z-scores help establish measurable performance benchmarks by quantifying deviations from process means. They support continuous improvement by systematically monitoring progress toward Six Sigma goals.
Why is accurate data crucial for Z-scores?
Accurate data ensures the reliability of Z-score calculations. Errors in data collection or processing can misrepresent deviations, leading to flawed decisions in Six Sigma projects. Dependable data is essential for meaningful analysis.


