In the realm of modern operational excellence, the transition from reactive quality control to proactive process management is no longer a luxury: it is a competitive necessity. For decades, Lean Six Sigma practitioners have relied on Statistical Process Control (SPC) to monitor the "Voice of the Process." Among the most vital tools in this arsenal is the P chart. However, as we navigate the complexities of Industry 4.0, traditional statistical methods are being augmented by Artificial Intelligence (AI) and Machine Learning (ML) to provide unprecedented predictive capabilities.
The fundamental purpose of this integration is to move beyond simply identifying when a process has failed and toward predicting failures before they occur. By combining the structured discipline of Lean Six Sigma with the computational power of AI, organizations can achieve a level of stability and efficiency that was previously unattainable.
What is a P Chart? Understanding the Voice of the Process
To fully appreciate the evolution of process control, one must first answer a foundational question: what is a p chart?
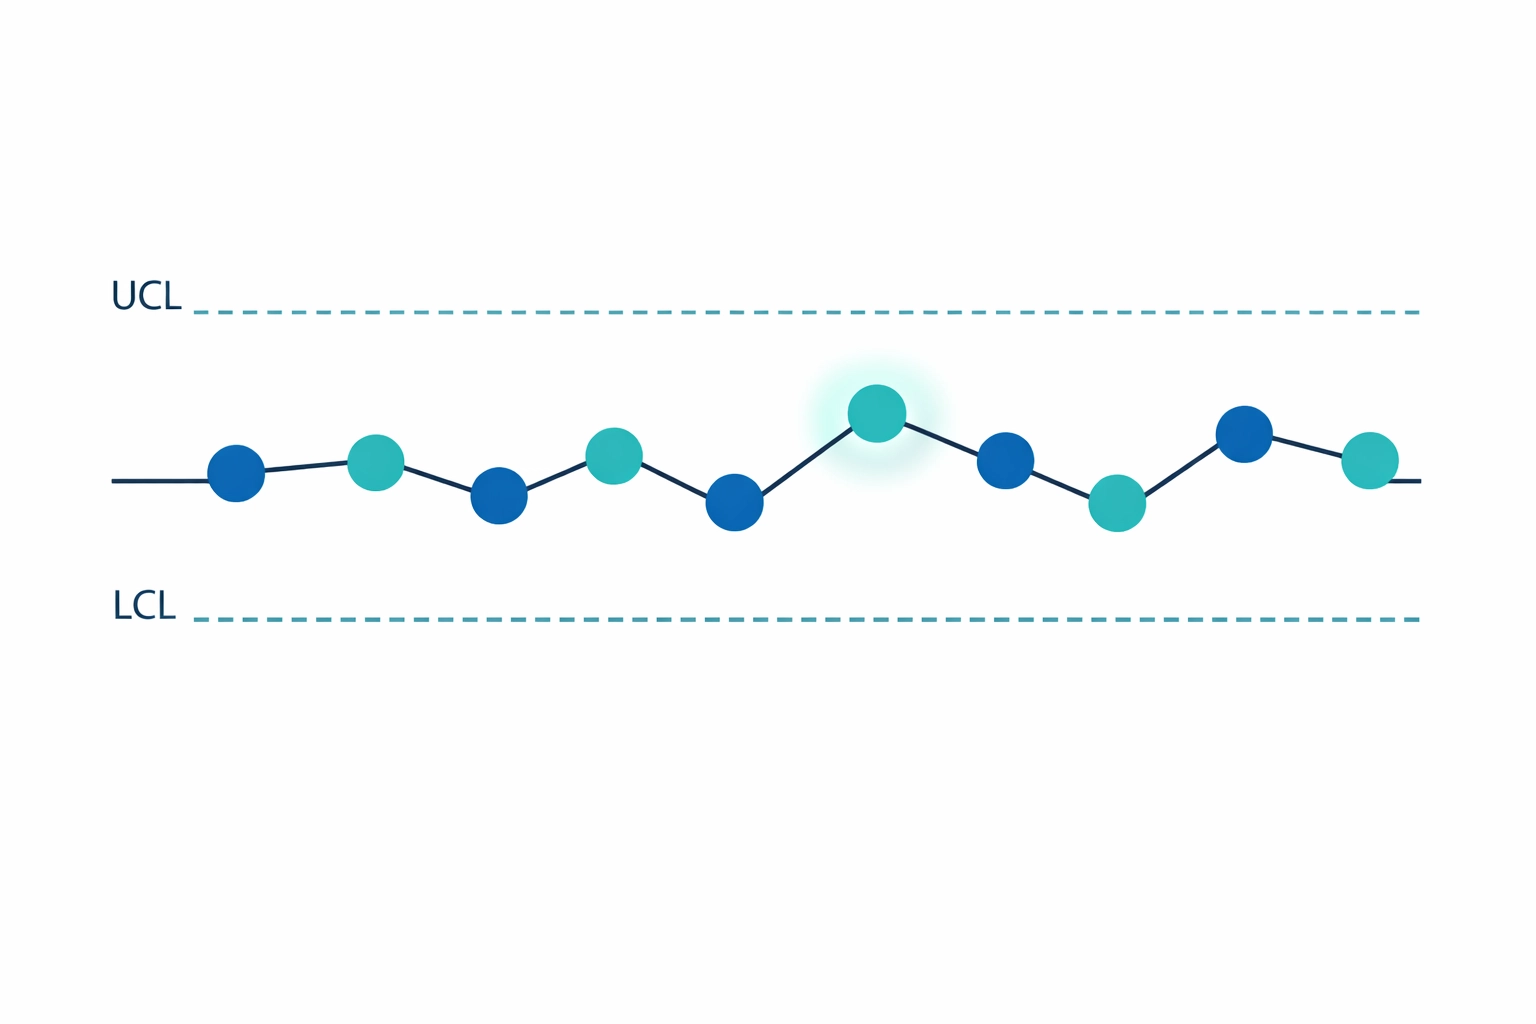
A P chart, or Proportion chart, is a type of attribute control chart used to monitor the proportion of nonconforming (defective) units in a sample. Unlike variables charts that measure continuous data (such as weight or length), the P chart deals with binary outcomes: items are either "good" or "bad," "pass" or "fail." This makes it an essential tool for industries where categorical quality metrics are the primary focus, such as manufacturing assembly lines or high-volume transaction environments.
The P chart serves as the voice of the process, translating raw data into a visual representation of process stability. By plotting the proportion of defects against calculated Upper Control Limits (UCL) and Lower Control Limits (LCL), practitioners can distinguish between "common cause" variation: the inherent noise in any system: and "special cause" variation, which indicates a specific problem requiring intervention.
The Limitation of Traditional SPC in a High-Speed World
While the P chart is a robust diagnostic tool, it is inherently retrospective. It tells a story of what has happened. In a traditional DMAIC (Define, Measure, Analyze, Improve, Control) framework, the P chart is often utilized in the Control Phase to ensure that improvements are sustained.
However, in high-velocity environments: such as payment processing or banking compliance: waiting for a data point to breach a control limit often means that significant waste, rework, or regulatory risk has already been incurred. This is where the integration of AI transforms the methodology from a post-mortem analysis into a forward-looking strategy.
Step-by-Step: Integrating P Charts With AI
The integration of P charts with AI involves a systematic transition from statistical monitoring to algorithmic forecasting. This process can be broken down into four critical phases.
1. Establishing the Data Foundation
The first step is to treat your historical P chart data as a structured dataset for machine learning. This includes not just the defect proportions and subgroup sizes, but the temporal context of each data point. To build a reliable model, you must extract historical records of rework and scrap rates and align them with the process parameters present at the time of production.
2. Feature Engineering: Adding Context to the Proportion
In traditional SPC, the only variables considered are the number of defects and the sample size. In an AI-integrated model, we use "feature engineering" to include environmental and operational variables that influence the defect rate. These features might include:
- Environmental Factors: Temperature, humidity, or vibration levels in the facility.
- Operational Inputs: Equipment age, time since the last maintenance cycle, or specific supplier performance data.
- Temporal Patterns: Shift changes, seasonal trends, or even the day of the week.
By feeding these variables into the model alongside the P chart data, the AI learns to identify the "early warning signals" that precede a spike in the defect proportion.
3. Model Development and Predictive Analysis
Once the features are defined, regression or classification models (such as Random Forests or Gradient Boosting) are trained to estimate the probability of a defect rate violation in the upcoming time window. Instead of waiting for a point to fall outside the UCL, the AI provides a risk score. For instance, the system might alert an operator that there is an 85% probability of the process exceeding the control limit within the next two hours based on current process constraints and chokepoints.
4. System Architecture and Real-Time Feedback
The most effective architecture maintains the P chart as a stability guardrail while the AI acts as an early warning system. This requires connecting predictive models to the Manufacturing Execution System (MES) or Enterprise Resource Planning (ERP) software via APIs. This setup allows for real-time scoring and continuous monitoring of process performance.

Critical Requirements for Implementation Success
Integrating AI into Lean Six Sigma workflows is not merely a technical challenge; it is an operational one. To ensure that these advanced predictions lead to actual process improvement, several requirements must be met:
- Low-Latency Predictions: The AI must process data and return predictions fast enough for the operations team to take corrective action. A prediction that arrives after the batch is completed is of no value.
- Actionable Outputs: Alerts must be specific. Rather than a vague "high risk" notification, the system should specify the likely cause (e.g., "Elevated defect risk due to temperature fluctuation in Zone B; intervention required within 45 minutes").
- Model Validation: It is imperative to use historical data to validate the model's accuracy. Practitioners should focus on outlier detection to ensure that the AI is not being misled by "noise" or anomalous data points that do not represent true process trends.
- Operator Trust: For an AI-integrated P chart to succeed, the front-line staff must trust the algorithm. This is achieved by demonstrating how AI predictions align with known physical process behaviors during the initial pilot study.
The Future of the Lean Six Sigma Professional
As AI continues to permeate the manufacturing and service sectors, the role of the Lean Six Sigma professional is evolving. The modern Black Belt must not only understand the mathematics of a P chart but also the logic of the algorithms that enhance it. Organizations are increasingly seeking individuals who can bridge the gap between traditional data analysis and advanced data science.
Whether you are optimizing cold chain logistics or improving hybrid workforce productivity, the ability to integrate these technologies will be the defining factor in your career growth.

At Lean 6 Sigma Hub, we recognize that the future of process improvement lies at the intersection of human expertise and machine intelligence. Our certification programs are designed to equip you with the foundational knowledge of SPC and the forward-thinking mindset required to lead AI-driven initiatives.
Take the next step in your professional journey and master the tools that are shaping the industry. Enrol in our Lean Six Sigma Black Belt certification today to lead the future of operational excellence.