
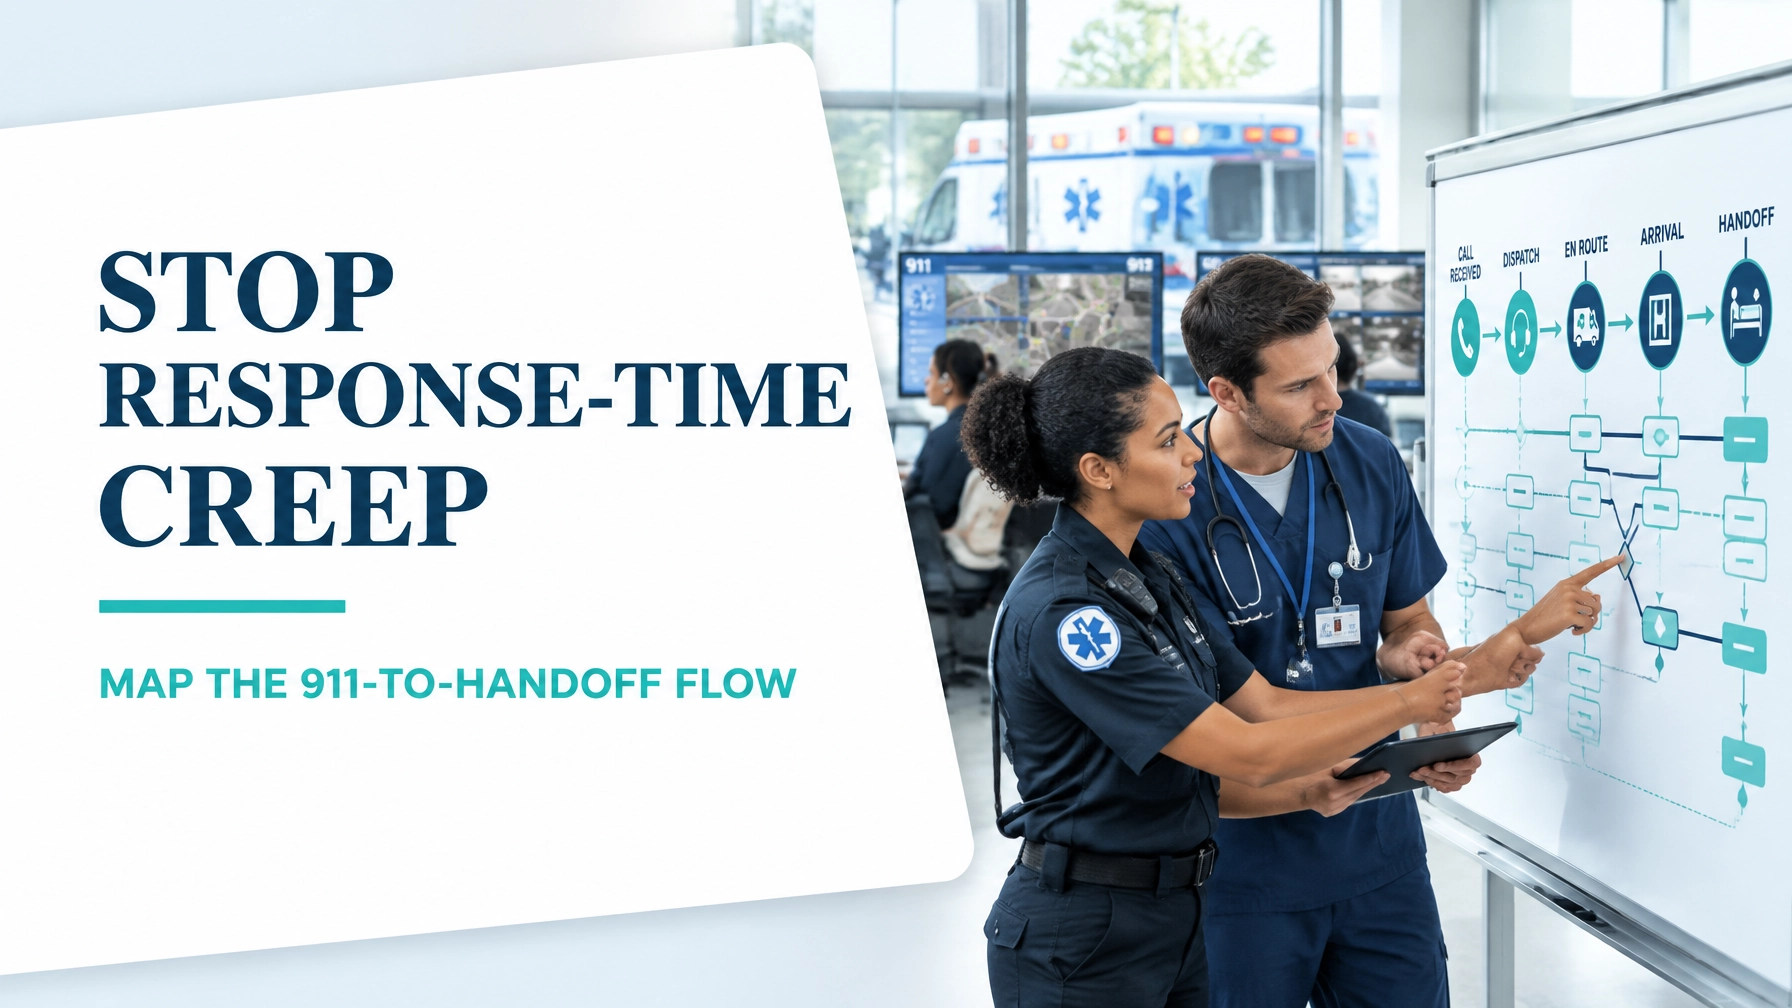
Emergency medical services operate in a time-critical environment where every delay can affect patient experience, clinical capacity, crew availability, and community confidence. Yet response-time creep rarely comes from one dramatic failure. More often, it develops through small queues, duplicated information, unclear ownership, uneven demand, and handoff delays accumulating across the value stream.
Value Stream Mapping (VSM) provides a disciplined way to see the entire journey: not just the ambulance response segment. By mapping the flow from 911 call receipt through completed emergency department handoff, EMS leaders can separate value-adding clinical work from waiting, rework, motion, and avoidable administrative effort.
This guide presents a practical Lean Six Sigma approach using a hypothetical Priority 1 adult medical-call stream. The method can be adapted to local protocols, geography, staffing models, and clinical governance requirements.
1. Select a Focused EMS Value Stream
The fundamental purpose of scope selection is to make the problem measurable. Mapping every EMS activity at once produces a complex diagram but often weakens improvement focus.
A practical scope statement is:
Priority 1 adult medical calls from 911 call receipt to completion of patient handoff in the receiving emergency department.
This scope includes:
- 911 call answering and interrogation
- Priority coding and dispatch
- Crew acknowledgement and mobilisation
- Travel to the scene
- On-scene assessment and treatment
- Hospital pre-alert
- Transport
- ED arrival and offload
- Clinical handoff and documentation completion
The customer is primarily the patient, while the caller, family, receiving hospital, EMS crew, and community also have important requirements. Capture the Voice of the Customer (VOC) through measures such as timely care, clear communication, safety, dignity, and continuity of information.
Balance those requirements with the Voice of the Business (VOB): crew availability, regulatory compliance, ambulance turnaround, cost, capacity, and workforce sustainability.
Before mapping, define:
- Start point: 911 call received.
- End point: ED handoff complete and EMS documentation accepted.
- Patient family: Priority 1 adult medical calls.
- Time window: For example, weekday calls between 07:00 and 19:00.
- Primary CTQs: response time, call-to-arrival, call-to-handoff, handoff completeness, and ambulance turnaround.
A focused scope also supports a credible project scope boundary and prevents unrelated patient pathways from distorting the baseline.
2. Build the Current-State Map
A current-state VSM should show both patient flow and information flow. Include process boxes, queues, decision points, handoffs, data boxes, and a timeline separating processing time from waiting time.

At the gemba, involve call-takers, dispatchers, paramedics, EMTs, ED nurses, physicians, bed managers, and IT representatives. Their observations often reveal workarounds that are invisible in timestamp data.
For every step, collect:
- Cycle time and waiting time
- Queue size
- Staffing and resource availability
- First-time accuracy
- Rework or clarification frequency
- Patient and crew handoff points
- Variation by shift, day, location, and call type
Use a process-mapping guide for the Measure Phase to structure the observation plan. Where timestamps are incomplete, a work-sampling approach can estimate how staff time is distributed.
3. Worked Current-State Example
The following figures are illustrative and should not be interpreted as an EMS benchmark. Assume a review of 120 Priority 1 adult medical calls.
| Current-state step | Median processing time | Median waiting time | Key observation |
|---|---|---|---|
| 911 answer and call capture | 0:45 | 0:00 | Call answered immediately in the sample |
| Dispatch interrogation and coding | 3:00 | 0:00 | Information entered into two systems |
| Unit assignment | 0:00 | 2:30 | Queue varies sharply by peak period |
| Crew mobilisation | 2:45 | 0:00 | Equipment checks performed inconsistently |
| Travel to scene | 8:30 | 0:00 | Route variation between zones |
| On-scene assessment and treatment | 14:00 | 0:00 | Clinical work; wide variation by condition |
| Hospital selection and pre-alert | 2:00 | 0:00 | Pre-alert sometimes delayed until transport |
| Transport to hospital | 10:00 | 0:00 | Destination-dependent |
| ED offload | 0:00 | 19:00 | Largest queue in the value stream |
| Handoff and documentation | 7:00 | 0:00 | 18% require clarification or re-entry |
Total median processing time: 48 minutes
Total median waiting time: 21 minutes 30 seconds
Total call-to-handoff lead time: 69 minutes 30 seconds
The processing-time-to-lead-time ratio is:
[
\text{Flow efficiency} = \frac{48}{69.5} \times 100 = 69.1%
]
This calculation is useful, but it requires careful interpretation. Some clinical work is not reducible, and removing time from assessment could create risk. The opportunity is primarily in avoidable waiting, duplicated information, inconsistent preparation, and capacity mismatch.
Use medians alongside the 90th percentile. A median may appear acceptable while a long tail of delayed patients creates severe operational consequences. Box plots can reveal whether response-time creep is concentrated in a particular shift, hospital, or demand category.
4. Identify the Eight Wastes in EMS
The eight DOWNTIME wastes can be translated directly into emergency-service operations:
- Defects: Incorrect addresses, incomplete clinical information, inaccurate destination details, or handoff omissions that require rework.
- Overproduction: Repeating documentation or collecting information that is not used for the next clinical or operational decision.
- Waiting: Crews waiting for assignment, patients waiting for ED offload, or dispatchers waiting for confirmation.
- Non-utilised talent: Frontline staff identifying recurring causes but lacking a structured route to test and implement improvements.
- Transportation: Unnecessary patient, equipment, or document movement caused by poor layout or destination decisions.
- Inventory: Excess work in process, including queued calls, unprocessed electronic reports, or ambulances waiting outside the ED.
- Motion: Repeated movement for equipment, forms, signatures, or access to disconnected systems.
- Extra processing: Manual re-entry of ePCR information, repeated triage questions, or multiple approval steps that do not improve patient safety.
The bottleneck is the constrained step limiting total flow. In this example, ED offload is the dominant constraint. However, that does not automatically mean the ED should simply add staff. Analyse demand patterns, bed availability, patient acuity, handoff rules, and receiving capacity before selecting a countermeasure.
5. Analyse Root Causes Before Designing Solutions
The Analyse Phase of DMAIC converts visible delay into verified cause-and-effect relationships. Do not assume that the longest step is automatically the root cause.
Stratify the data by:
- Hour of day and day of week
- Dispatch priority
- Geographic zone
- Receiving hospital
- Crew type and staffing level
- Arrival volume
- ED occupancy and offload queue
- Handoff completeness
Useful tools include:
- Run charts for response and offload trends
- Pareto charts for delay categories
- Box plots for variation by hospital or shift
- Fishbone diagrams for potential causes
- Process capability analysis for defined response CTQs
- ANOVA when comparing mean times across three or more groups, provided the assumptions are checked
- Bartlett’s test or another variance assessment before relying on ANOVA assumptions
The relationship Y = f(x) is especially relevant here. The outcome, such as call-to-handoff time, is influenced by inputs including dispatch rules, staffing, route distance, hospital capacity, documentation design, and handoff standard work. Improvement becomes more precise when teams identify and control the critical inputs rather than merely asking staff to “move faster.”
6. Design the Future-State Map
A future-state map should create a safer, more predictable flow: not simply a faster version of the current process.

Potential future-state design principles include:
-
Standardise dispatch-to-rollout work.
Use a clear acknowledgement and mobilisation sequence with visual status signals. An Andon-style dashboard can show calls awaiting assignment, crews preparing, units en route, and hospitals approaching offload capacity. -
Create a pull signal for ED receiving.
Coordinate EMS control and ED capacity management so receiving teams can anticipate arrivals and prioritise appropriate direct-to-bed pathways. -
Use a standardised handoff.
A concise structured format can improve first-time completeness and reduce clarification. Where feasible, transmit key ePCR information before arrival and confirm only the information needed for immediate clinical decisions. -
Reduce duplicated entry.
Integrate systems or use controlled data fields to prevent paramedics and ED staff from repeatedly entering the same patient information. -
Match capacity to demand.
Use demand-by-hour data to align dispatch coverage, crew positioning, equipment readiness, and ED receiving resources. Takt time: available capacity divided by demand: can help frame the required operating rhythm, although emergency demand is not perfectly level. -
Make exceptions visible.
Autonomation, or Jidoka, means designing the process to detect abnormal conditions and trigger a response. For example, an alert can activate when offload exceeds a defined threshold or when a handoff remains incomplete.
7. Current State Versus Future State
| Metric | Current state | Future-state target | Expected effect |
|---|---|---|---|
| Call-to-handoff median | 69:30 | 48:00 | 21:30 reduction |
| Total waiting time | 21:30 | 6:45 | 68.6% reduction |
| Unit assignment wait | 2:30 | 0:45 | Faster dispatch-to-rollout |
| ED offload wait | 19:00 | 6:00 | Reduced queue accumulation |
| Handoff processing time | 7:00 | 4:30 | Less duplication and clarification |
| Complete and accurate handoffs | 82% | 95% | Less rework |
| Flow efficiency | 69.1% | 85.9% | More predictable movement |
These are improvement targets for the hypothetical case, not promises. Validate them with a pilot, protect clinical safeguards, and monitor unintended consequences such as rushed assessment, inappropriate direct-to-bed decisions, or workload transfer to another team.
8. Sequence Kaizen Actions and Control the Gains

Avoid launching ten initiatives simultaneously. Sequence improvements according to constraint impact, implementation effort, and risk.
Kaizen 1: Stabilise measurement.
Agree on timestamp definitions, establish baseline medians and 90th percentiles, and create a daily data-quality check.
Kaizen 2: Standardise dispatch and mobilisation.
Remove unnecessary variation in acknowledgement, equipment readiness, and crew status updates.
Kaizen 3: Improve information flow.
Pilot electronic pre-alerts and a structured handoff checklist for the selected patient family.
Kaizen 4: Address the ED bottleneck.
Test an escalation rule, direct-to-bed criteria, and coordinated offload huddles during predictable peak periods.
Kaizen 5: Sustain through visual control.
Review response time, offload delay, handoff completeness, queue size, and safety exceptions at a daily or weekly operational huddle.
Control charts can distinguish common-cause variation from special-cause events. A sudden delay caused by a road closure requires a different response from a stable pattern caused by insufficient peak-period capacity.
Build the Capability to Improve the Whole System
VSM is not merely a drawing exercise. It is a way to connect customer requirements, process data, waste analysis, bottleneck management, and governance into one improvement system.
A trained Yellow Belt can support data collection, standard work, and focused kaizen activity. A Green Belt can lead the DMAIC project, analyse variation, and validate improvements. A Black Belt can lead complex cross-functional change and mentor improvement teams across dispatch, field operations, and hospital interfaces.
To strengthen your capability, explore Lean Six Sigma Green Belt online training, review the Lean Six Sigma Practitioner Guide, or begin with Yellow Belt online training.
Pursue Lean Six Sigma certification and learn to turn emergency-service delays into measurable, safer, and more reliable flow.
Kaizen. Kai-Care. Kai-Done. ( Lean Six Sigma)


