
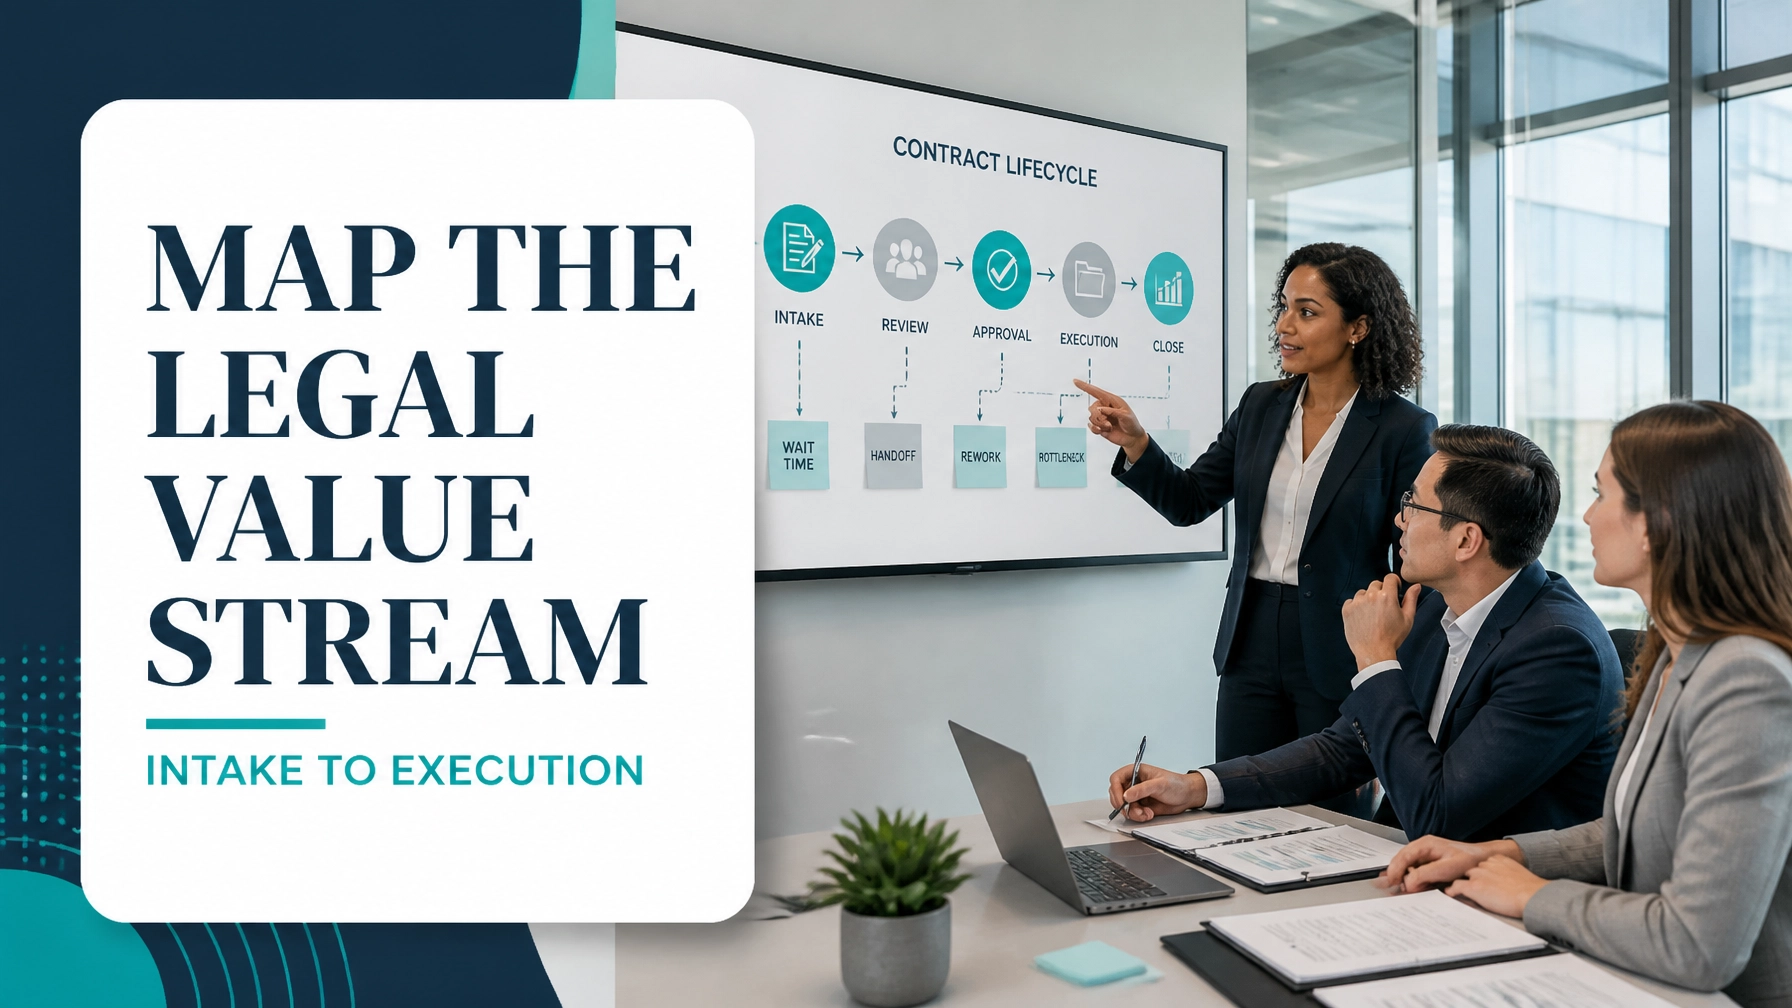
In legal operations, the visible work is often drafting, reviewing and negotiating. The hidden work is waiting: requests sitting in shared inboxes, approvals moving sequentially, missing information being clarified and contract versions being searched across email threads.
Value Stream Mapping (VSM) makes this hidden delay visible. It shows the complete flow of information and decisions from matter intake to an executed contract, separating customer-value-adding legal work from queues, rework, handoffs and administrative effort.
The customer may be an internal business team waiting to sign with a supplier, partner or customer. The Voice of the Customer (VOC) is a predictable, risk-appropriate contract delivered by the required date. The Voice of the Business (VOB) includes revenue velocity, risk control and efficient use of legal capacity. The Voice of the Process (VOP) comes from actual cycle-time, queue and quality data.
This guide presents a worked legal operations VSM example using Lean Six Sigma principles.
1. Select a Focused Legal Value Stream
Do not begin by mapping “all legal work.” That scope is too broad to produce actionable insight.
Select one repeatable value stream with a clear trigger and outcome:
- Trigger: A business requester submits a contract or legal matter.
- Customer: Sales, procurement, finance, operations or an external counterparty.
- Outcome: An approved, executed and correctly stored contract.
- Product family: For example, standard MSAs, SOWs, NDAs or supplier agreements.
- Time horizon: The last 30–90 days of completed matters.
A suitable pilot might cover standard commercial contracts from request submission through e-signature. Exclude complex litigation, bespoke acquisitions and exceptional matters unless they represent a significant share of demand.
Use an SIPOC-style definition to identify suppliers, inputs, process stages, outputs and customers. Include legal counsel, legal operations, sales or procurement, finance, security, approvers, contract administrators and the e-signature system owner.
2. Map the Current State: Follow the Work, Not the Procedure
A current-state map should reflect what actually happens. Observe completed contracts, interview the people performing the work and timestamp each handoff.
For every stage, record:
- Processing time: hands-on work
- Waiting time: time in queues or awaiting input
- Number of handoffs
- Rework and missing information
- Work in Process (WIP)
- Approval points and decision owners
- Systems, emails and spreadsheets used

Worked Example: 80 Contracts per Month
Assume a legal operations team processes 80 standard commercial contracts per month, or approximately 4 contracts per working day.
The team has:
- 1 intake coordinator
- 2 legal counsel
- 0.5 commercial reviewer
- 0.25 finance approver
- 0.5 contract administrator
The organisation provides 420 productive minutes per person per day after meetings and routine administration. Therefore:
Takt time = Available time ÷ Customer demand
420 minutes ÷ 4 contracts = 105 minutes per contract
Takt is the required demand rhythm. It does not mean every contract must be completed by one person in 105 minutes; legal work is distributed across several roles and can be performed in parallel.
Current-State Process Data
| Stage | Active processing time | Average waiting time |
|---|---|---|
| Request and clarification by email | 12 min | 1.50 days |
| Intake triage | 18 min | 0.50 days |
| Conflict and risk check | 25 min | 0.75 days |
| Assignment to counsel | 10 min | 1.00 day |
| Drafting or redlining | 95 min | 2.00 days |
| Internal legal review | 35 min | 1.00 day |
| Business and finance approval | 20 min | 2.50 days |
| Counterparty negotiation | 55 min | 3.00 days |
| Final approval | 12 min | 1.50 days |
| Signature and repository entry | 15 min | 0.75 days |
| Total | 297 min | 14.50 days |
The total active processing time is 297 minutes, or approximately 4.95 hours. Waiting contributes another 14.5 working days, producing a total average lead time of:
14.5 days + 297 minutes ÷ 480 minutes = 15.12 working days
The process cycle efficiency is:
PCE = Value-added processing time ÷ Total lead time
297 ÷ 7,257 minutes = 4.1%
Only about 4.1% of elapsed time is active processing. The remaining time is primarily waiting, coordination, searching, rework and approval delay. The Process Cycle Efficiency Calculator can be used to perform this calculation with your own data.
At 4 contracts per day and 15.12 days of lead time, Little’s Law estimates average WIP at approximately:
4 contracts × 15.12 days = 60.5 contracts in the system
That WIP creates status requests, competing priorities and additional administrative motion.
3. Identify the Eight Wastes in Legal Operations
The eight DOWNTIME wastes appear clearly in this example:
- Defects: Incomplete intake forms, outdated templates or incorrect entity details create rework.
- Overproduction: Preparing detailed legal analysis before confirming that the request is complete or commercially viable.
- Waiting: Contracts sit in inboxes, approval queues and counterparty exchanges.
- Non-utilised talent: Lawyers spend time chasing information instead of applying legal judgement.
- Transportation: Documents and decisions move between email, shared drives, spreadsheets and contract systems.
- Inventory: Sixty or more partially completed contracts accumulate as WIP.
- Motion: Staff search for the latest version, approval history or authorised signatory.
- Extra-processing: Multiple reviews, duplicate data entry and approvals that do not change the risk decision.
The major bottleneck is not necessarily drafting. In this case, negotiation and approval waiting account for 5.5 days, while fragmented intake creates early queue time.
Use an Affinity Diagram to group observations into themes such as intake quality, ownership, approval governance, technology and counterparty delay.
4. Use the Right Analytical Lens
During the Analyse phase of DMAIC, use visual and statistical tools to separate symptoms from root causes.
- Attribute data, such as complete/incomplete intake, approved/rejected and first-pass/ rework, helps quantify quality.
- Average cycle time provides a baseline, while a box plot reveals spread, skewness and outliers by contract type.
- Use ANOVA to compare average lead times across contract families. Before ANOVA, Bartlett’s Test can assess whether group variances are sufficiently equal.
- A Z-score helps identify unusually aged contracts across different contract populations.
- An X-bar chart can monitor average weekly lead time, while an R chart monitors variation.
- Watch for bias in measurement, such as excluding weekends, measuring only completed contracts or recording system timestamps inconsistently.
- Variation determines the response: common-cause variation requires process redesign; special-cause variation requires investigation.
The relationship can be expressed as Y = f(x): executed-contract lead time is the outcome, influenced by inputs such as intake completeness, contract type, risk level, approval count and negotiation rounds.
5. Build the Future State

The future state should not simply automate the existing sequence. It should redesign the flow around value, risk and demand.
Recommended countermeasures include:
- Centralised intake: Replace email-based requests with a required-field form capturing entity, contract type, value, jurisdiction, deadline, data sensitivity and business owner.
- Rules-based routing: Use risk and contract type to route matters automatically to the appropriate counsel or self-service pathway.
- Standard templates and playbooks: Give business teams approved templates for routine agreements and define escalation rules for exceptions.
- Pull-based WIP limits: Limit the number of contracts assigned to each counsel and make queue status visible.
- Parallel approvals: Where governance allows, run finance, security and business approvals concurrently rather than sequentially.
- Andon-style escalation: Create a visible alert when a contract exceeds its stage SLA or remains unassigned.
- Autonomation: Configure intelligent workflow rules to detect missing fields, unusual risk responses or prohibited clauses and pause the item for review.
- Electronic signature and automatic filing: Send approved contracts directly to e-signature, then populate repository metadata automatically.
- Agile improvement cycles: Test workflow changes in short iterations, review weekly data and adjust without waiting for a large technology programme.
Future-State Data
| Future-state stage | Active processing time | Average waiting time |
|---|---|---|
| Structured intake | 8 min | 0.10 days |
| Automated triage and routing | 5 min | 0.10 days |
| Conflict and risk check | 20 min | 0.25 days |
| Template drafting or redlining | 65 min | 0.50 days |
| Legal review | 30 min | 0.25 days |
| Parallel business and finance approval | 15 min | 0.50 days |
| Negotiation | 45 min | 1.50 days |
| Exception approval | 8 min | 0.25 days |
| E-signature and archive | 10 min | 0.10 days |
| Total | 206 min | 3.55 days |
The future-state lead time becomes:
3.55 days + 206 ÷ 480 = 3.98 working days
PCE improves to:
206 ÷ 1,910 minutes = 10.8%
That is a substantial improvement even though legal judgement remains essential. Average WIP falls from approximately 61 contracts to 16 contracts.
The 91-minute reduction in active work per contract releases:
80 × 91 ÷ 60 = 121.3 hours per month
At an illustrative internal cost of $180 per hour, the capacity value is approximately $21,834 per month. If implementation costs $35,000, a simple break-even analysis indicates recovery in approximately 1.6 months.
6. Sequence the Kaizen Work

Do not implement every countermeasure simultaneously. Sequence the work so that each improvement stabilises the next.
Week 1: Establish the Baseline
- Confirm scope and customer requirements.
- Collect 30–90 days of contract data.
- Validate timestamps and definitions.
- Calculate average, median, PCE, WIP and first-pass yield.
Weeks 2–3: Stabilise Intake
- Launch one standard intake form.
- Define required fields and service levels.
- Create a clear ownership matrix.
- Remove duplicate spreadsheets and inboxes.
Weeks 4–5: Improve Flow
- Introduce templates and clause playbooks.
- Apply risk-based routing.
- Set WIP limits.
- Run parallel approvals where permitted.
Weeks 6–7: Automate and Escalate
- Add reminders, dashboards and Andon-style alerts.
- Integrate e-signature and repository filing.
- Track approval aging by role.
- Use exception-based review rather than universal senior approval.
Week 8 and Beyond: Control
- Monitor weekly lead time with an X-bar and R chart.
- Review first-pass yield and negotiation rounds.
- Audit approval compliance.
- Revisit the map quarterly.
A Yellow Belt can support data collection and kaizen activity. A Green Belt can lead the improvement project, while a Black Belt can manage complex cross-functional transformation and mentor the team. A White Belt provides foundational awareness, and a Master Black Belt can help establish governance across the legal operating model.
The principle of Zero Defects does not mean adding inspections everywhere. It means designing intake, templates and workflows so the correct information and decision are produced the first time.
7. Turn Legal Operations Improvement into a Professional Capability
Value Stream Mapping gives legal teams a disciplined way to reduce delay without reducing legal quality. It clarifies where value is created, where approvals become bottlenecks and where technology should support: not replace: professional judgement.
The Lean Six Sigma Green Belt course is especially relevant for professionals who want to lead data-driven improvement projects. Lean 6 Sigma Hub provides CSSC-accredited, self-paced online training with practical tools, worked examples, case studies and project-based learning.
Enrol in Lean Six Sigma certification today and learn how to map, analyse and improve the legal value streams that determine organisational speed, capacity and customer value.
Kaizen. Kai-Care. Kai-Done. ( Lean Six Sigma)


