
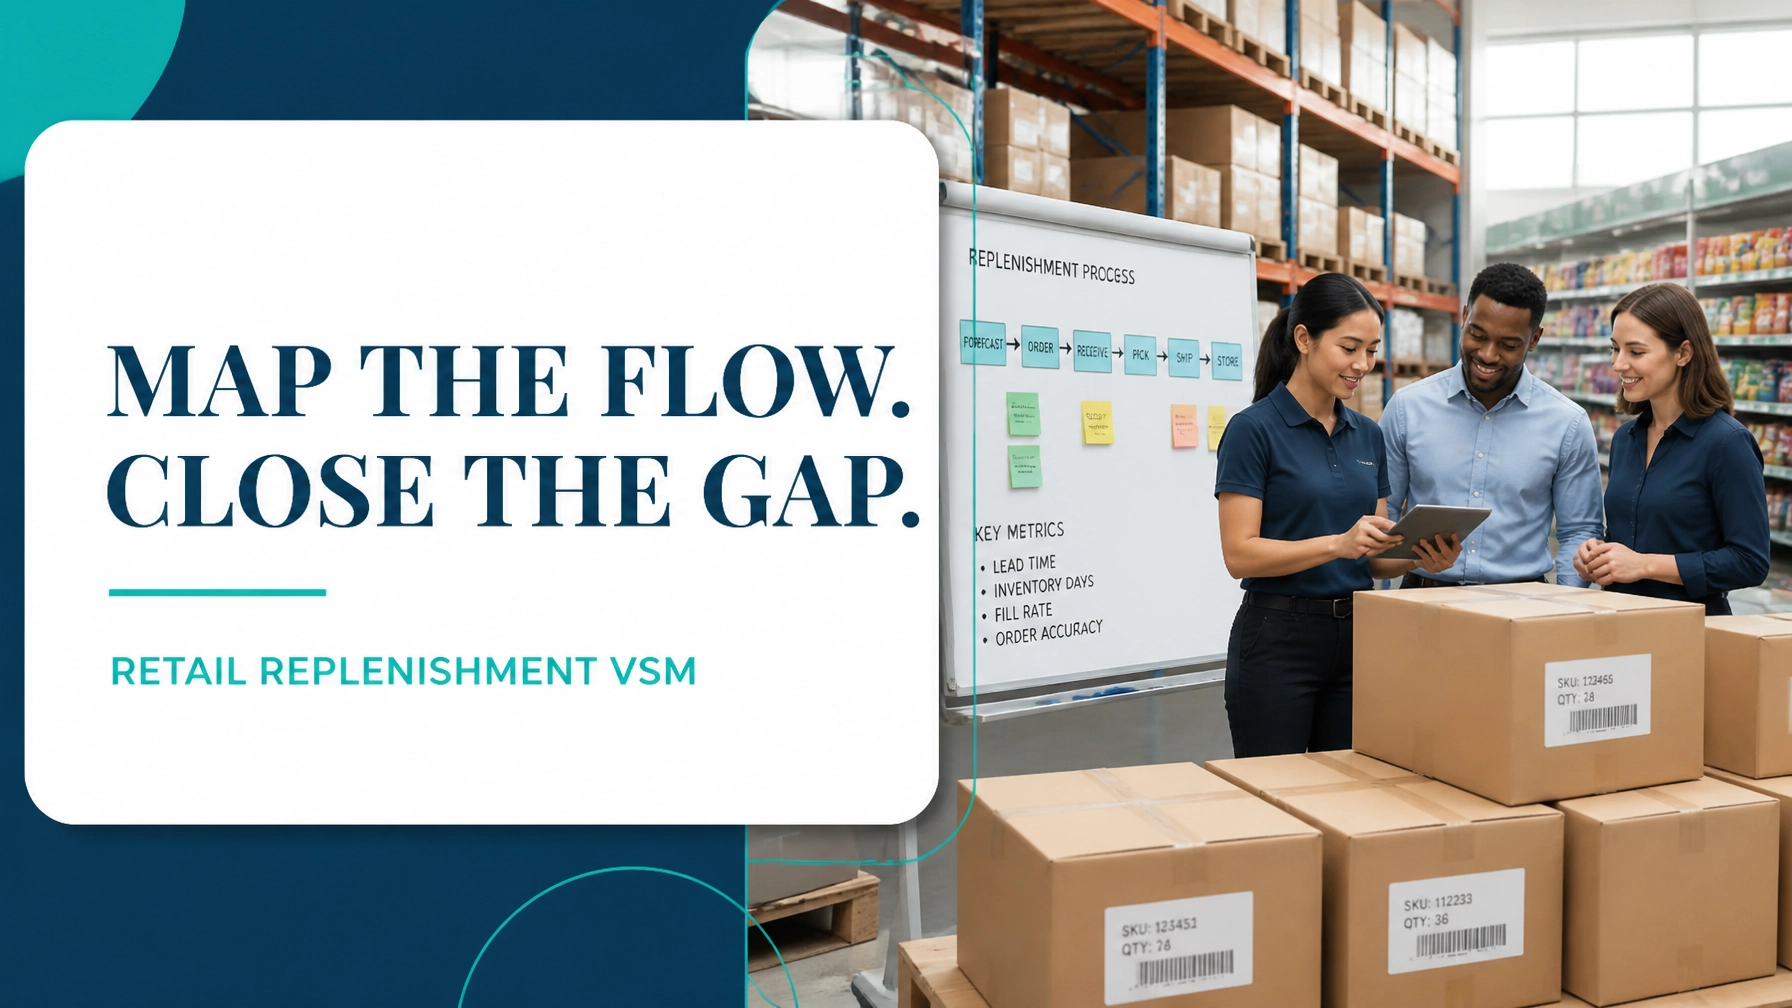
Retail replenishment is often treated as a collection of separate activities: distribution-center receiving, picking, transport, store receiving, backroom storage and shelf filling. Customers, however, experience only one outcome: Can they find the product when they want it?
That is why Value Stream Mapping (VSM) matters. It connects the material flow of cartons and cases with the information flow of sales data, replenishment signals, forecasts and approvals. The map exposes where time is consumed, where inventory accumulates and where an apparently well-stocked network can still produce an empty shelf.
A value stream includes every action required to deliver value from trigger to customer. In retail, the customer defines value through product availability, freshness, accuracy and convenience. Activities that move stock closer to the shelf can be necessary, but they do not automatically create customer value.
The following worked example shows how to map and improve a retail replenishment process using Lean Six Sigma principles.
1. Select the Right Replenishment Scope
Do not begin by mapping the entire retail network. A broad scope creates a complex diagram but often produces weak decisions.
Select a representative product family, such as:
- Ambient grocery products supplied from one distribution center
- High-velocity personal-care products
- Promotional products with frequent shelf shortages
- Fresh products requiring short replenishment windows
- A category with similar storage, picking and delivery rules
A practical scope boundary is:
From the replenishment signal generated by store demand to the product being shelf-faced and available for purchase.
For the first map, select one distribution center, one representative store cluster and one product family. Include the following stakeholders:
- Store operations and shelf-replenishment associates
- Distribution-center receiving and picking teams
- Transport or logistics coordinators
- Inventory planning and replenishment analysts
- Store and category leadership
- Customers or customer-service representatives, where available
Define the critical-to-quality measures before collecting data. Suitable CTQs include on-shelf availability, out-of-stock rate, replenishment lead time, stock accuracy and lost-sales exposure.
2. Map the Current State at the Gemba
A current-state map should show what actually happens, not what the standard operating procedure says should happen.
Begin at the shelf and walk upstream. Record:
- The customer demand signal from point-of-sale data
- Store order creation and approval
- Distribution-center allocation
- Receiving and putaway
- Picking and staging
- Loading and transport
- Store receiving
- Backroom storage
- Shelf replenishment
- Exception handling when stock is missing or inaccurate
Use process boxes for major activities, inventory triangles for stock positions and data boxes for cycle time, staffing, uptime, batch size and quality. The Lean Enterprise Institute’s VSM reference reinforces the importance of mapping both information and material flow, then comparing a current state with a designed future state.

3. Fully Worked Current-State Example
Consider a supermarket replenishing a fast-moving ambient grocery family.
Demand and takt calculation
The store sells an average of 216 cases per day. The replenishment team has 360 minutes of effective shelf-replenishment time per day after meetings, breaks and routine administration.
[
\text{Takt Time}=\frac{360 \times 60}{216}=100\text{ seconds per case}
]
The process must therefore make one case available to the shelf every 100 seconds on average to match customer demand.
Current-state process data
| Process step | Cycle time | Waiting time | Staffing | Key observation |
|---|---|---|---|---|
| Store order release and approval | 12 min | 18 hr | 1 planner | Orders released in a large batch |
| DC receiving and putaway | 85 sec/case | 6 hr | 2 associates | Mixed pallets require repeated handling |
| DC picking | 42 sec/case | 2 hr | 4 pickers | Fast movers share locations with slow movers |
| Staging and loading | 18 sec/case | 3 hr | 1 associate | Loads wait for route completion |
| Transport to store | 10 hr elapsed | : | Carrier | Fixed delivery windows |
| Store receiving | 55 sec/case | 4 hr | 2 associates | Deliveries wait for checking and paperwork |
| Backroom putaway | 30 sec/case | 7 hr | 2 associates | Stock is not always location-scanned |
| Shelf replenishment | 72 sec/case | 5 hr | 3 associates | Replenishment is prioritised by visual urgency |
The total hands-on process time is:
[
85+42+18+55+30+72=302\text{ seconds}
]
That equals 5.03 minutes per case.
The elapsed lead time from order trigger to shelf availability is:
- Order-release delay: 18 hours
- DC and staging delays: 11 hours
- Transport: 10 hours
- Store receiving delay: 4 hours
- Backroom waiting: 7 hours
- Processing time: 5 minutes
Total lead time: approximately 50 hours and 5 minutes.
The process cycle efficiency is:
[
\text{PCE}=\frac{5.03}{3,005}\times100=0.17%
]
Only 0.17% of the elapsed replenishment time is active processing. The remaining time is waiting, queueing, movement, storage or administrative delay.
Current inventory positions are also significant:
- Distribution center: 1,600 cases
- In transit: 420 cases
- Store backroom: 310 cases
- Shelf-facing stock: 85 cases
At 216 cases of daily demand, the network holds approximately 11.2 days of supply across these positions, yet the store records an 8.6% out-of-stock rate for the product family. This is a classic flow problem: inventory exists, but it is not consistently available at the point of customer demand.
4. Identify the Eight Wastes in Retail Replenishment
The eight DOWNTIME wastes provide a disciplined way to interpret the map.
- Defects: Incorrect quantities, damaged cases, wrong labels and inventory-record errors.
- Overproduction: Replenishing slow-moving products beyond actual shelf demand.
- Waiting: Orders awaiting approval, trucks awaiting route completion and cases waiting in the backroom.
- Non-utilised talent: Store associates spending time searching for stock instead of improving availability.
- Transportation: Repeated movement between receiving, staging, backroom and temporary storage.
- Inventory: Excess DC and backroom stock that does not prevent shelf-level shortages.
- Motion: Long walks, manual searches and repeated scanning or paperwork.
- Extra-processing: Duplicate checks, spreadsheet reconciliation and approvals that do not change the replenishment decision.
The Analyse Phase of DMAIC should now separate symptoms from root causes. Useful tools include a Pareto chart of out-of-stock causes, a process observation sheet, an inventory-accuracy audit, a bottleneck review and stratification by day, shift, product velocity and delivery route.
5. Build the Future State
The future state should not simply accelerate every activity. It should redesign the flow around customer demand.

Recommended countermeasures include:
-
Create a pull signal from shelf demand.
Use point-of-sale data and shelf scans to trigger replenishment in smaller, more frequent quantities. -
Segment fast-moving products.
Place the highest-velocity items in dedicated DC pick locations and near the most accessible store backroom positions. -
Reduce approval batching.
Replace one large daily release with controlled replenishment windows, while retaining formal approval for exceptional orders. -
Introduce visual management.
Use an Andon-style escalation signal when a shelf is empty, stock cannot be located or a replenishment task exceeds its standard time. -
Standardise shelf replenishment.
Define the sequence, scan points, maximum batch size and escalation rule for every replenishment cycle. -
Improve inventory accuracy at the point of use.
Require location scanning during backroom putaway and conduct targeted cycle counts for high-impact SKUs. -
Level deliveries where practical.
Use smaller, more consistent delivery waves rather than large batches that overload store receiving. -
Control the bottleneck.
If shelf replenishment is the constraint, protect its capacity during peak demand periods rather than adding stock upstream.
The future-state design projects the following results:
- Order-release wait reduced from 18 hours to 2 hours
- DC and staging wait reduced from 11 hours to 2.5 hours
- Store receiving and backroom wait reduced from 11 hours to 3 hours
- Shelf replenishment cycle time reduced from 72 to 55 seconds
- Staffing reduced from 12 to 10 full-time-equivalent roles through redeployment and better flow, not abrupt headcount removal
6. Current Versus Future State
| Metric | Current state | Future state | Improvement |
|---|---|---|---|
| Replenishment lead time | 50 hr 5 min | 17 hr 33 min | 65% reduction |
| Total process time | 5.03 min | 3.53 min | 30% reduction |
| Process cycle efficiency | 0.17% | 0.34% | 100% relative improvement |
| Shelf replenishment cycle time | 72 sec | 55 sec | 24% reduction |
| Out-of-stock rate | 8.6% | 3.0% | 5.6 percentage-point reduction |
| Shelf availability | 91.4% | 97.0% | 5.6 percentage-point increase |
| Network inventory | 2,415 cases | 1,650 cases | 32% reduction |
| Staffing requirement | 12 FTE-equivalent | 10 FTE-equivalent | 2 roles redeployed |
| Average replenishment batch | 180 cases | 60 cases | 67% reduction |
These are illustrative project numbers, but they demonstrate the logic of VSM: reduce waiting and batch size, protect the constraint, improve information flow and place inventory where customers need it.

7. Kaizen Sequencing Plan
Sequence improvements so the team gains control before introducing complexity.
Week 1: Stabilise and measure
- Confirm the product family and map boundaries.
- Validate demand, takt and out-of-stock definitions.
- Observe at least 30 replenishment cycles.
- Audit inventory accuracy at DC, backroom and shelf.
- Establish a daily availability baseline.
Weeks 2–3: Remove immediate flow barriers
- Re-slot the top 20% of high-velocity products.
- Mark standard backroom locations.
- Introduce a visual shortage board.
- Remove duplicate paperwork and clarify approval rules.
- Create standard work for shelf replenishment.
Weeks 4–6: Pilot pull replenishment
- Select one store and one product family.
- Reduce order batch size from 180 to 60 cases.
- Trial two replenishment windows per day.
- Connect shelf scans with DC allocation.
- Track lead time, shelf availability, stock accuracy and labour minutes.
Weeks 7–10: Validate and scale
- Compare pilot results with a control store or pre-pilot baseline.
- Review variation by shift, day and product category.
- Update the future-state map using actual results.
- Standardise the process across similar stores.
- Assign ownership through a control plan and weekly performance review.
Formal checkpoints support governance, but excessive approval can create new bottlenecks. Use approvals for risk, spend and policy decisions: not for routine replenishment that the standard process already controls.
8. Turn VSM Capability into a Career Advantage
Retail replenishment combines customer demand, inventory, transport, data quality, staffing and operational execution. VSM gives improvement teams a shared language for seeing the whole system rather than optimising one department in isolation.
To lead this work effectively, professionals need more than a diagram. They need the ability to define CTQs, measure process performance, analyse variation, test root causes, design countermeasures and sustain gains. Lean 6 Sigma Hub’s CSSC-accredited Green Belt training develops these capabilities through self-paced learning, practical tools and real-world process-improvement applications. You can also review the broader Lean Six Sigma training pathway to select the right Belt level for your role.
Pursue Lean Six Sigma certification and learn to convert complex retail flow problems into measurable improvements in availability, efficiency and customer value.
Kaizen. Kai-Care. Kai-Done. ( Lean Six Sigma)


