
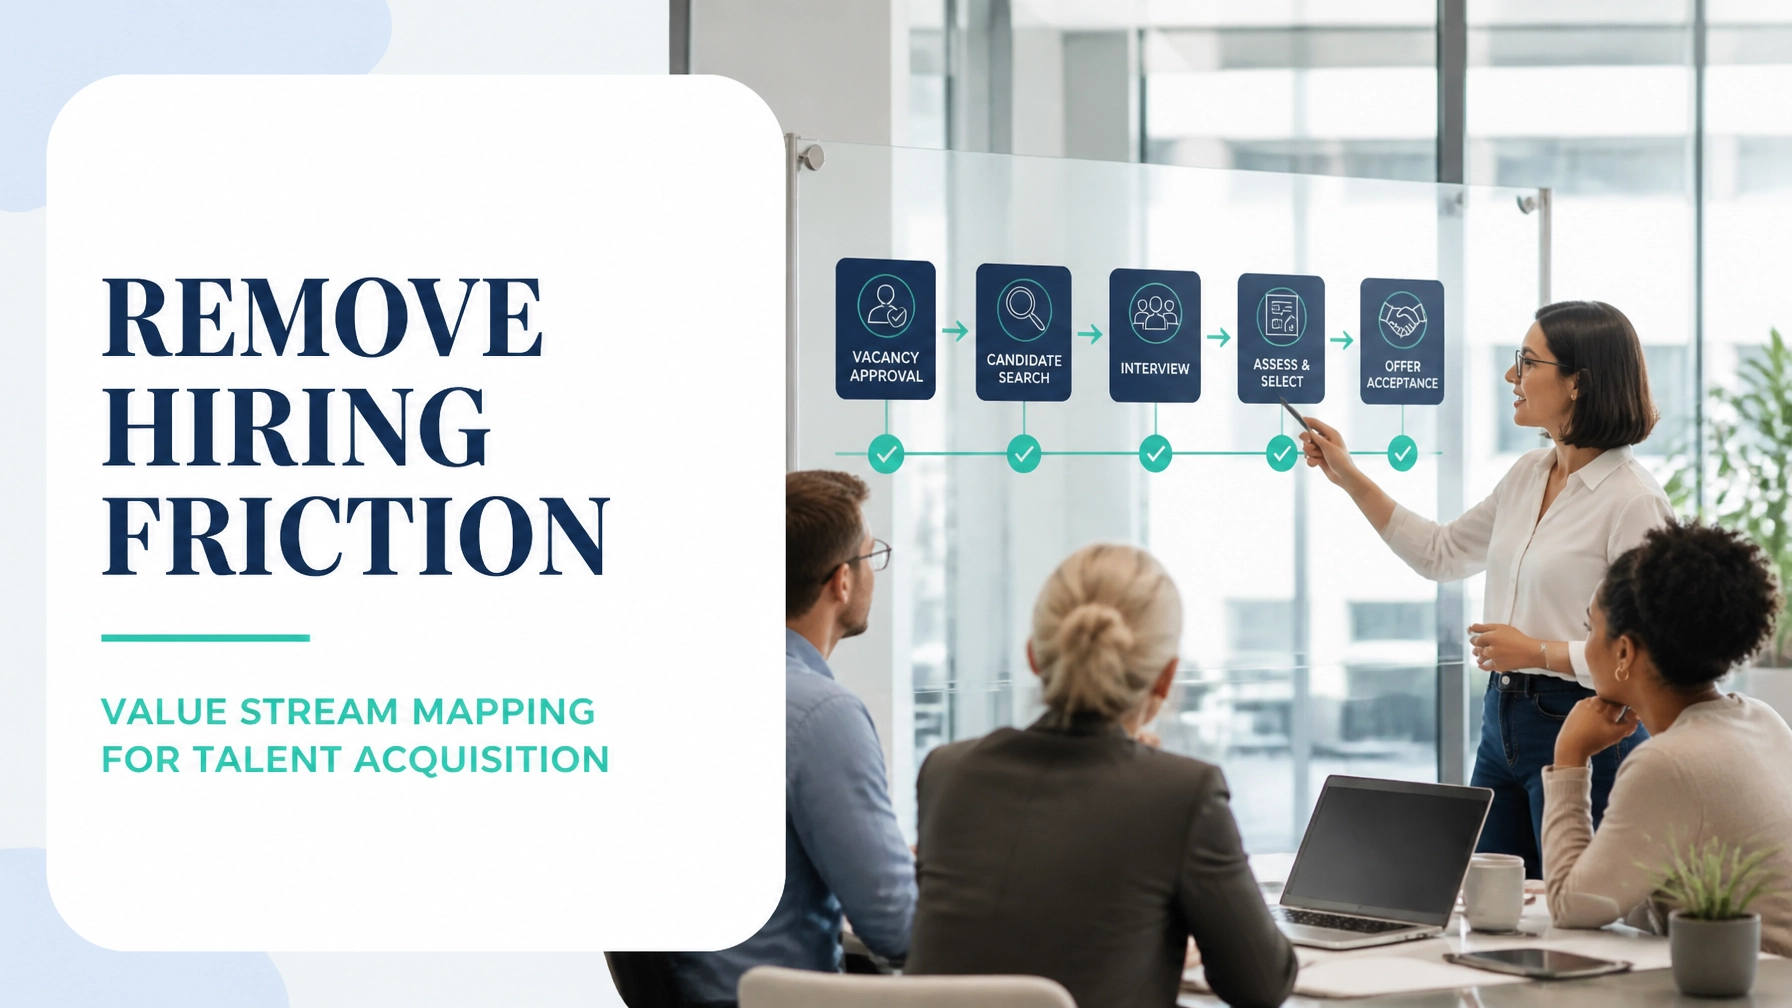
In professional services, talent acquisition is a value stream: not a collection of disconnected HR tasks. The customer is the hiring manager, the candidate, and ultimately the client who depends on the organisation’s capacity. When a vacancy remains open, billable work may be delayed, existing teams may carry excess workload, and candidates may accept competing offers.
Value Stream Mapping (VSM) makes the entire hiring journey visible. It connects information flow, candidate flow, processing time, waiting time, rework, decisions and handoffs from vacancy approval through offer acceptance.
This worked example follows a hypothetical professional services firm recruiting an experienced consulting manager. The organisation handles approximately 18 approved vacancies per month and has set a target of reducing average time-to-acceptance from 42 calendar days to 25 days, without reducing hiring quality.
The fundamental purpose is not to make recruiters work faster. It is to redesign the system so that value flows with less waiting, fewer approval loops and clearer ownership.
What Counts as Value in Talent Acquisition?
In Lean terms, value is defined by the customer. In recruitment, value-added work changes the candidate or hiring decision in a meaningful way, such as:
- Clarifying role requirements with the hiring manager
- Conducting a structured candidate assessment
- Completing a purposeful interview
- Preparing an accurate offer
- Helping a candidate make an informed decision
By contrast, waiting, duplicate data entry, avoidable approval loops, repeated scheduling, excessive work in process (WIP) and rework are non-value-added activities.
A practical VSM should consider three perspectives:
- Voice of the Customer: the candidate expects clarity, responsiveness and a professional experience.
- Voice of the Business: the firm needs timely access to capability within an approved compensation range.
- Voice of the Process: ATS data reveals where candidates queue, drop out or return for rework.
A strong map begins with a clear SIPOC boundary: approved vacancy as the input, accepted offer as the output, and the candidate, hiring manager and business as customers.

Current-State Map: Where the Hiring Time Goes
The current-state map shows the process as it actually operates: not as the procedure manual describes it.
For the professional services firm, the current flow is:
- Vacancy request and business case preparation
- Vacancy approval by the practice leader, HR and finance
- Job brief and advertisement creation
- Sourcing through referrals, job boards and targeted outreach
- CV screening and recruiter phone screen
- First interview with the hiring manager
- Technical or case interview
- Final leadership interview
- Offer preparation, compensation review and approval
- Offer discussion, negotiation and acceptance
The average end-to-end lead time is 42 calendar days. However, the actual hands-on processing time is only approximately 10 hours and 20 minutes. The remaining time is primarily queueing between steps.
Worked Current-State Example
The firm analyses 30 completed hires from the previous quarter. The average results are:
- Vacancy approval: 4.5 calendar days, including two approval loops
- Sourcing: 7 calendar days to produce a viable shortlist
- Screening: 4 calendar days, including recruiter backlog
- Interview rounds: 16 calendar days, mainly scheduling and feedback delays
- Offer preparation: 4 calendar days, including compensation review
- Offer acceptance: 6.5 calendar days, including negotiation and candidate decision time
- Average accepted-offer yield: 72% of offers
- Average candidate WIP: 34 active candidates across open roles
A recurring bottleneck appears at interview scheduling. The interview process itself requires about 210 minutes per finalist, but the average candidate waits 11 calendar days between shortlist submission and final decision.
This is a classic office-process constraint. The bottleneck is not necessarily the longest activity; it is the step that restricts overall flow and capacity. When senior interviewers have limited calendar availability, candidates accumulate before the decision gate.
Current-State Data Table
| Process step | Average lead time | Value-added processing time | Non-value-added time | Main waste or risk |
|---|---|---|---|---|
| Vacancy approval | 4.5 days | 55 min | 4.2 days | Approval rework and unclear business case |
| Job brief and posting | 2 days | 75 min | 1.8 days | Duplicate information entry |
| Sourcing | 7 days | 4 hr | 6.5 days | Waiting for qualified responses |
| Screening | 4 days | 3 hr | 3.6 days | Candidate WIP and inconsistent criteria |
| Interview round one | 5 days | 60 min | 4.9 days | Calendar availability |
| Case or technical interview | 6 days | 90 min | 5.8 days | Sequential scheduling |
| Final interview and decision | 5 days | 60 min | 4.7 days | Delayed feedback and approval |
| Offer preparation and approval | 4 days | 2 hr | 3.8 days | Compensation and finance checks |
| Offer discussion and acceptance | 6.5 days | 2 hr | 6 days | Negotiation delay and candidate uncertainty |
| Total | 44 days | 10 hr 20 min | Approximately 43 days | Waiting dominates the stream |
The table illustrates why average processing time alone is misleading. A recruiter may spend only a few hours actively progressing a candidate, while the candidate spends weeks waiting for the next handoff.
The firm’s approximate Process Cycle Efficiency (PCE) is:
PCE = Value-added time ÷ Total lead time
10.3 hours ÷ 1,056 hours = 0.98%
This is consistent with the principle that office and service processes often contain a small amount of value-added work surrounded by queues. Lean 6 Sigma Hub’s Process Cycle Efficiency Calculator can help teams separate value-added time from waiting, rework and other non-value-added time.
Analyse the Root Causes, Not the Symptoms
During the Analyse Phase of DMAIC, the team should avoid assuming that “recruiters are too slow” or “candidates are difficult to find.” Instead, stratify the data by role type, hiring manager, source, interview round and approval path.
Useful tools include:
- Pareto analysis of the longest waiting categories
- Box plots comparing time-to-acceptance across business units
- Attribute data such as offer accepted/declined, approval complete/incomplete and feedback submitted/not submitted
- ANOVA to test whether average cycle time differs significantly across practice groups
- Five Whys for repeated approval rework
- Process observation using a time observation sheet
- Value Stream Mapping to connect delays to the wider system
The data may show that 61% of approval delays come from incomplete role briefs, while 68% of interview delays occur because feedback is not submitted within the agreed 24-hour window.
The root causes are therefore structural:
- No standard vacancy brief with mandatory fields
- Sequential rather than parallel compensation and role review
- Interview slots arranged only after a candidate reaches each stage
- No formal feedback service level
- Offer approvals distributed across email and spreadsheets
- Candidate communication triggered manually
Approval remains important for governance, risk control and compensation discipline. However, excessive or poorly designed approval checkpoints can create bottlenecks. The objective is controlled flow: not the removal of necessary governance.
Future-State Map: Create Flow by Design
The future state redesign introduces several changes:
- A standard vacancy brief with role outcomes, essential criteria, salary band and approval owner
- A single digital approval route with a 48-hour decision target
- Sourcing and compensation review performed in parallel
- Pre-booked interview blocks for priority roles
- A structured scorecard used across all interview rounds
- Same-day feedback submission through the ATS
- One offer approval gate with predefined compensation thresholds
- Candidate updates at every stage, including expected decision dates
- A visual dashboard showing WIP, ageing candidates, offer yield and time in stage
The future-state flow becomes:
Standard brief → 48-hour approval → parallel sourcing and screening → reserved interview blocks → one decision meeting → single offer gate → 48-hour candidate follow-up

The target-state metrics are:
| Measure | Current state | Future-state target |
|---|---|---|
| Average time from approval to acceptance | 44 days | 25 days |
| Vacancy approval lead time | 4.5 days | 2 days |
| Shortlist-to-final-decision lead time | 16 days | 8 days |
| Offer preparation and approval | 4 days | 1.5 days |
| Offer acceptance rate | 72% | 82% |
| Average candidate WIP per role | 11 | 7 |
| Value-added process cycle efficiency | 0.98% | 1.8% or higher |
The target does not depend on rushing interviews or lowering standards. It depends on eliminating avoidable waiting while preserving structured assessment.
Kaizen Sequencing Plan
A disciplined improvement sequence prevents the team from launching too many changes at once.
Kaizen 1: Stabilise the Vacancy Input
Owner: Talent acquisition manager
Timing: Weeks 1–2
Create a mandatory vacancy brief, define approval roles and establish a 48-hour response expectation. Measure incomplete briefs, approval loops and approval lead time.
Kaizen 2: Reduce Interview Waiting
Owner: Practice operations leader
Timing: Weeks 2–4
Reserve recurring interview blocks for priority roles, publish interviewer availability and require feedback within 24 hours. Track time from shortlist to first interview and final decision.
Kaizen 3: Standardise Screening and Interview Quality
Owner: Recruitment and hiring-manager working group
Timing: Weeks 3–5
Introduce a structured scorecard with measurable criteria. This reduces variation in screening decisions and improves first-pass yield from screened candidates to interviews.
Kaizen 4: Simplify Offer Governance
Owner: HR and finance
Timing: Weeks 4–6
Define compensation bands and approval thresholds. Offers within agreed parameters follow one route; exceptions receive an escalation review. This protects governance while reducing unnecessary approval movement.
Kaizen 5: Establish Control and Visibility
Owner: HR operations
Timing: Weeks 6–8
Create a weekly visual management board showing:
- Vacancies by age
- Candidates waiting by stage
- Feedback overdue
- Offer acceptance yield
- Average and median time-to-acceptance
- Rework and decline reasons
Agile methods complement this work well. The team can deliver the future state through short improvement sprints, test one policy with a limited group of roles, review the data and adjust before scaling.
ROI-Style Outcomes: Convert Waiting into Capacity
Assume the firm fills 18 roles per month and each open role delays approximately $7,500 of monthly contribution margin through lost billable capacity. Reducing average time-to-acceptance by 19 days releases:
18 roles × 19 days = 342 vacancy-days per month
At an illustrative contribution value of $250 per vacancy-day, the capacity opportunity is:
342 × $250 = $85,500 per month
Even if only 30% of that opportunity is realised because of start-date constraints, market conditions and onboarding capacity, the improvement represents approximately $25,650 per month, or $307,800 annually.
There are also softer but material benefits:
- Improved candidate experience and employer reputation
- Lower recruiter and hiring-manager administrative load
- Fewer declined offers caused by extended decision times
- Better visibility of WIP and bottlenecks
- More predictable workforce planning
- Stronger alignment between HR, finance and business leaders
The business case should validate these assumptions after the pilot. Track baseline and future-state performance using the same operational definitions, then review results at 30, 60 and 90 days.
Build the Capability to Improve the Stream
Value Stream Mapping is most effective when the team has the capability to measure, analyse and control the process: not simply draw it.
For practitioners who want to lead a complete improvement project, Lean 6 Sigma Hub’s CSSC-accredited Green Belt training covers process mapping, data collection, root-cause analysis, hypothesis testing, piloting solutions and control plans through a self-paced format. Teams can also use the Lean Six Sigma Project Storyboard Toolkit to structure the work from Define through Control and Sustain.
The result is a hiring process that is faster because it is better designed: not because people are asked to work harder.
Map the stream, remove the waiting, and turn hiring time into organisational capacity.
Kaizen. Kai-Care. Kai-Done. ( Lean Six Sigma)


