
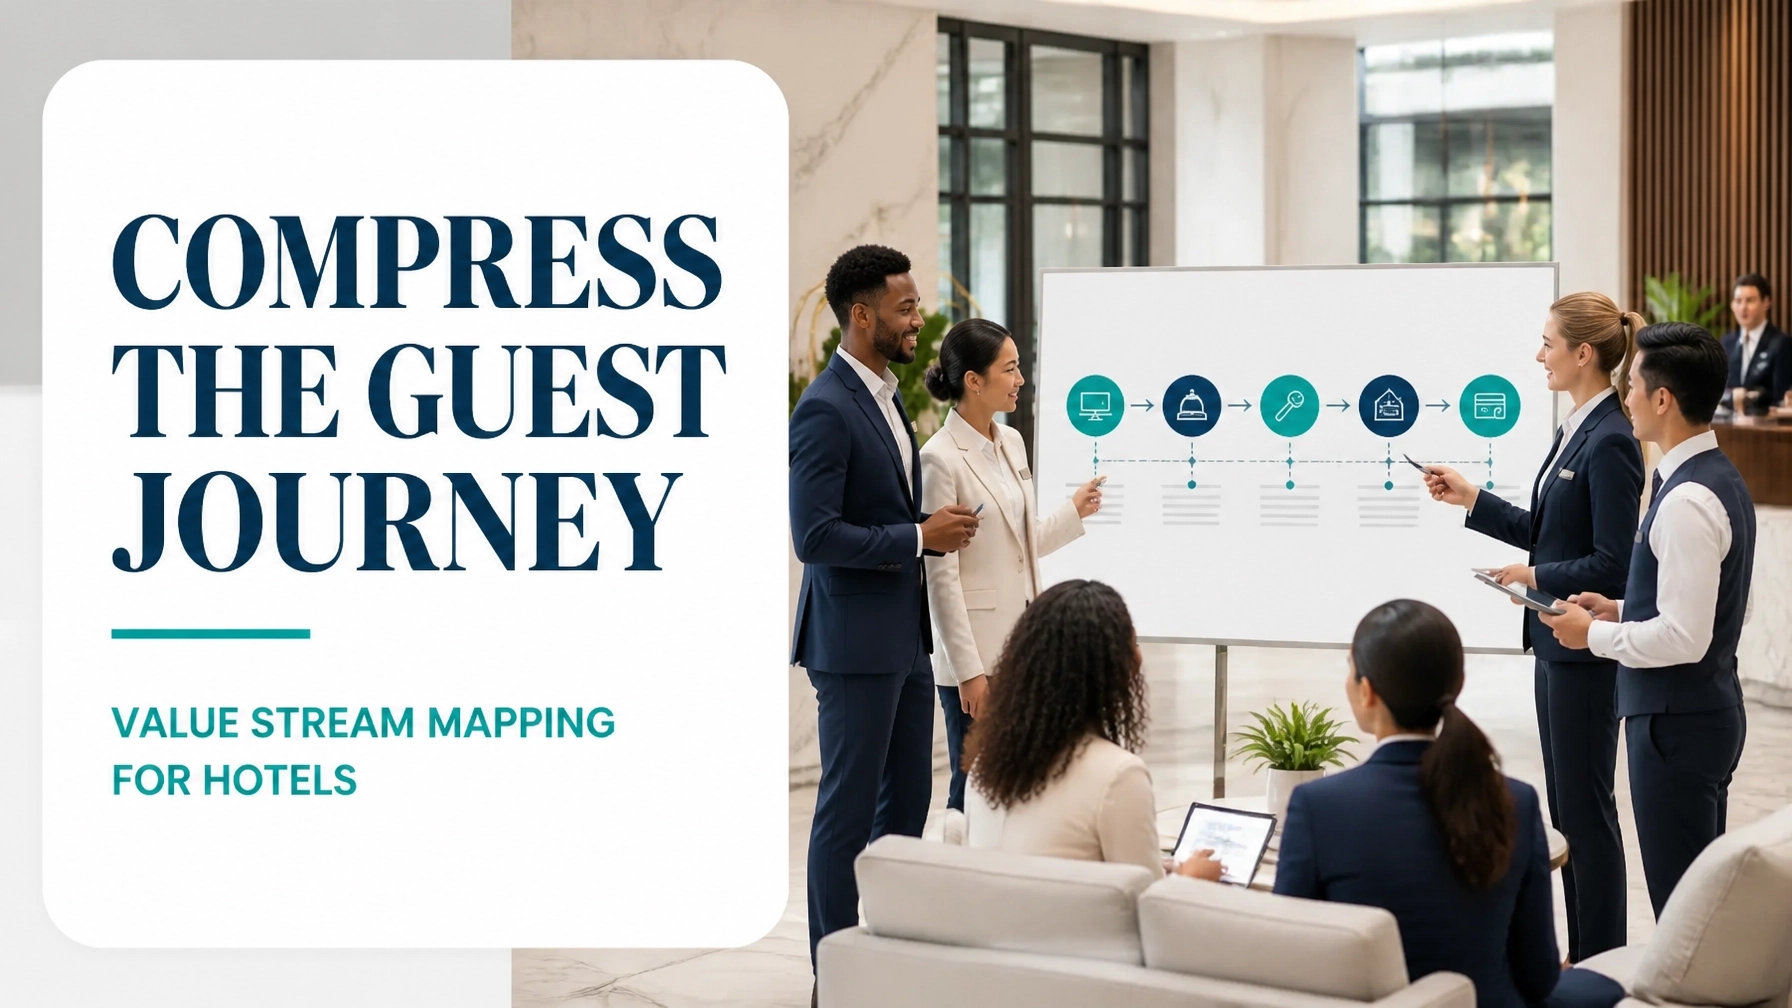
In the realm of hospitality, guests experience one journey, but hotels manage a network of connected processes. A reservation moves through booking platforms, payment systems, front-office teams, housekeeping, maintenance, food and beverage, and accounting before the guest finally checks out.
Value Stream Mapping (VSM) makes that invisible flow visible.
The fundamental purpose of VSM is to show how value, information, work, waiting, and waste move from the first customer request to the completed service. For a hotel, the value stream may begin when a guest confirms a reservation and end when the folio is closed, feedback is captured, and the room is released for the next occupant.
This guide presents a practical hotel VSM using a hypothetical 120-room business hotel. The example demonstrates how to select the scope, map the current state, quantify the eight wastes, design a future state, and sequence improvement actions through Kaizen.
1. Define the Value Stream and Its Boundaries
A hotel should not begin by mapping every process in the property. That creates excessive complexity and makes ownership unclear.
Start with one guest segment and one complete flow. For this example:
- Guest segment: Individual business travellers booking through the hotel website
- Start point: Reservation confirmed
- End point: Guest checks out, payment is settled, and the room is released
- Demand: 42 arrivals and 38 departures per weekday
- Primary CTQs: Check-in time, billing accuracy, room readiness, request response time, and check-out time
This boundary links the Voice of the Customer (VOC) with the Voice of the Business (VOB). Guests want a fast, accurate, effortless stay. The hotel wants high occupancy, reliable throughput, controlled labour cost, and strong guest retention.
The Voice of the Process (VOP) then supplies the evidence: actual cycle times, queue times, defects, rework, and variation.
A useful high-level sequence is:
- Reservation
- Pre-arrival preparation
- Arrival and check-in
- In-stay service
- Folio preparation
- Check-out and room release
For a broader explanation of value streams, see Value Stream Mapping resources. To structure the project formally, a project scope boundary calculator can help define what is inside and outside the study.
2. Build the Current-State Map
A current-state map must represent how work actually happens, not how the standard operating procedure says it should happen.
Interview front-desk agents, reservations staff, housekeeping, finance, maintenance, and guests. Then collect direct observations rather than relying only on averages reported by supervisors.
Record:
- Processing time
- Waiting time
- Queue size
- Daily volume
- Rework and defect rate
- Handoffs between departments
- Systems used
- Approval points
- Work in Process (WIP)
- First Pass Yield and Rolled Throughput Yield

Worked Current-State Example
The following figures represent a hypothetical five-day observation period.
| Process step | Average cycle time | Average waiting time | Key issue |
|---|---|---|---|
| Reservation verification | 4 minutes | 18 minutes | Manual review of website bookings |
| Pre-arrival preparation | 7 minutes | 9 hours | Requests held in shared inbox |
| Room assignment | 3 minutes | 22 minutes | Dependent on housekeeping status |
| Guest check-in | 8 minutes | 14 minutes | Queue at peak arrival period |
| In-stay requests | 6 minutes | 31 minutes | Phone requests re-entered manually |
| Folio preparation | 9 minutes | 46 minutes | Charges reconciled across systems |
| Check-out | 5 minutes | 11 minutes | Billing questions and corrections |
| Room release | 4 minutes | 19 minutes | Status update waits for housekeeping |
Total processing time is:
4 + 7 + 3 + 8 + 6 + 9 + 5 + 4 = 46 minutes
Total average waiting time is:
18 minutes + 9 hours + 22 minutes + 14 minutes + 31 minutes + 46 minutes + 11 minutes + 19 minutes = 11 hours and 41 minutes
The hotel is therefore delivering approximately 46 minutes of direct processing within an 11-hour-41-minute elapsed journey. That is a process cycle efficiency of approximately 6.2%.
This does not mean every waiting period can be eliminated. A guest may spend several hours between booking and arrival by design. However, the map reveals where avoidable delays, duplicated effort, and poor information flow are embedded in the service.
The reservation process also shows 94% First Pass Yield: 6% of bookings require correction. When the reservation, check-in, room assignment, billing, and room-release steps are considered together, the hypothetical Rolled Throughput Yield falls to 78%. That means only about three out of four journeys pass through the entire system without rework.
3. Identify the Eight Wastes
The eight DOWNTIME wastes: Defects, Overproduction, Waiting, Non-utilised talent, Transportation, Inventory, Motion, and Extra-processing: can all appear in a hotel.
1. Defects
Examples include incorrect room types, missing guest preferences, duplicate reservations, and folios with unposted restaurant charges.
In the example, 6% of website reservations require manual correction, while 8% of departing guests receive a revised folio.
2. Overproduction
The hotel prints arrival lists that are later replaced by updated versions. Teams also prepare reports that are not used in daily decisions.
3. Waiting
Waiting appears in the 14-minute check-in queue, the 46-minute folio reconciliation delay, and the nine-hour pre-arrival request queue.
4. Non-utilised talent
Front-desk agents spend time copying data between systems instead of resolving exceptions, improving guest relationships, or identifying service recovery opportunities.
5. Transportation
Paper forms and signed documents move between reception, finance, and the back office even though the information already exists digitally.
6. Inventory
Unprocessed guest requests, open billing questions, and rooms waiting for status updates are forms of service inventory. Excess WIP hides problems and creates additional follow-up work.
7. Motion
Staff walk repeatedly between the reception desk, printer, payment terminal, and back office. These movements may be small individually but significant across hundreds of transactions.
8. Extra-processing
Agents enter the same guest information into the booking system, property management system, payment platform, and guest messaging tool. Multiple approval signatures create additional delay without increasing guest value.
A Time Observation Sheet is useful here because it separates value-added work from non-value-added work at the point of activity. A box plot of check-in times can also reveal skewness and outliers that an average conceals.
4. Analyse Root Causes, Not Symptoms
The Analyse Phase of DMAIC should convert observations into verified causes.
Useful questions include:
- Why are website reservations corrected manually?
- Why are guest requests held in an inbox?
- Why does room assignment depend on a late status update?
- Why are folio charges reconciled after the guest arrives at reception?
- Which approvals are required, and which are historical habits?
Use a process map, Pareto chart, fishbone diagram, and stratified data. Attribute data: such as correct/incorrect, ready/not ready, or pass/fail: can show where defects cluster. Continuous data: such as check-in duration or request response time: can be analysed using averages, control charts, and variation studies.
If comparing check-in time across three shifts, ANOVA can test whether the group means differ significantly. Bartlett’s Test may be used to assess whether the variances are sufficiently equal before applying ANOVA. A Z-score can identify unusually long transactions across different service periods.
The principle Y = f(x) is highly relevant: guest experience, or Y, is influenced by inputs such as booking accuracy, room status reliability, system response time, staffing levels, and payment data quality.
5. Design the Future-State Map
The future state should not simply make employees work faster. It should improve the system so that work flows with fewer interruptions.

Proposed future-state changes include:
- Integrate the booking engine, channel manager, and property management system.
- Collect identification, arrival time, payment details, and preferences before arrival.
- Use a single digital queue for guest requests.
- Pre-assign rooms using forecasted departures and housekeeping capacity.
- Trigger folio reconciliation automatically from point-of-sale transactions.
- Offer express check-out and digital invoices.
- Use Andon-style visual signalling for room, maintenance, or system exceptions.
- Apply Autonomation, or Jidoka, so systems detect missing fields, duplicate bookings, or payment failures and stop the transaction for correction.
- Establish clear approval rules and remove low-risk approvals that create bottlenecks.
The future state must also respect takt time. If 42 guests arrive across a seven-hour window, demand is six arrivals per hour. The front-office team must be designed to meet that rhythm without creating a queue. Throughput should be measured as completed check-ins, settled folios, and released rooms per hour.
| Metric | Current state | Future state target |
|---|---|---|
| Reservation correction rate | 6.0% | 1.5% |
| Average check-in cycle time | 8 minutes | 4 minutes |
| Check-in waiting time | 14 minutes | 3 minutes |
| Guest request waiting time | 31 minutes | 10 minutes |
| Folio reconciliation waiting time | 46 minutes | 8 minutes |
| Billing rework rate | 8.0% | 2.0% |
| First Pass Yield | 94% | 98.5% |
| Rolled Throughput Yield | 78% | 94% |
| Process cycle efficiency | 6.2% | 12.8% |
These targets are hypothetical, but they demonstrate how VSM converts broad improvement ambitions into measurable outcomes.
6. Sequence Kaizen Actions

Do not launch every improvement simultaneously. Sequence changes according to dependency, risk, and expected benefit.
Kaizen 1: Stabilise the data
Standardise booking fields, room-status definitions, billing codes, and guest-request categories. This reduces variation before automation is introduced.
Kaizen 2: Remove duplicate entry
Integrate the booking engine, property management system, and payment platform. Establish one source of truth for reservation and folio data.
Kaizen 3: Create visual flow control
Introduce dashboards and Andon alerts for unassigned rooms, overdue requests, payment failures, and unresolved folios.
Kaizen 4: Shift work upstream
Collect guest information and payment details before arrival. Pre-assign rooms and identify exceptions before the guest reaches reception.
Kaizen 5: Improve the constraint
Measure hourly demand against front-office capacity. If check-in is the bottleneck, redesign staffing, layout, standard work, and escalation rules around the peak arrival window.
Kaizen 6: Control the gains
Use X-bar and R charts to monitor average service times and variation. Review weekly CTQs, defect rates, queue length, and guest feedback. Sustain the gains through standard work, training, audits, and visible ownership.
Build Capability Through Lean Six Sigma Certification
Hotel VSM is more than a diagram. It is a disciplined way to connect guest expectations, operational data, waste reduction, and financial performance.
A Lean Six Sigma White Belt provides foundational awareness. A Green Belt course develops the analytical and project-management skills needed to lead improvements. Experienced practitioners can progress toward Black Belt capability and mentor teams across reservations, front office, housekeeping, finance, and operations.
Start your Lean Six Sigma certification journey today and learn how to turn complex service processes into faster, more reliable value streams.
Kaizen. Kai-Care. Kai-Done. ( Lean Six Sigma)


