In the realm of operational excellence and quality management, the ability to anticipate failure is far more valuable than the ability to react to it. Failure Mode and Effects Analysis (FMEA) serves as the primary proactive tool for engineers and process owners to identify potential weaknesses before they manifest as defects or safety hazards. Central to this methodology is the fmea rpn score, a metric often misunderstood as a simple "pass/fail" grade.
To fully appreciate the utility of the Risk Priority Number (RPN), one must look beyond the raw digits and understand the underlying dynamics of risk. While a high score typically signals a need for immediate intervention, the true power of the FMEA lies in its ability to categorize and prioritize complex risks into actionable data.
The Fundamental Anatomy of the RPN
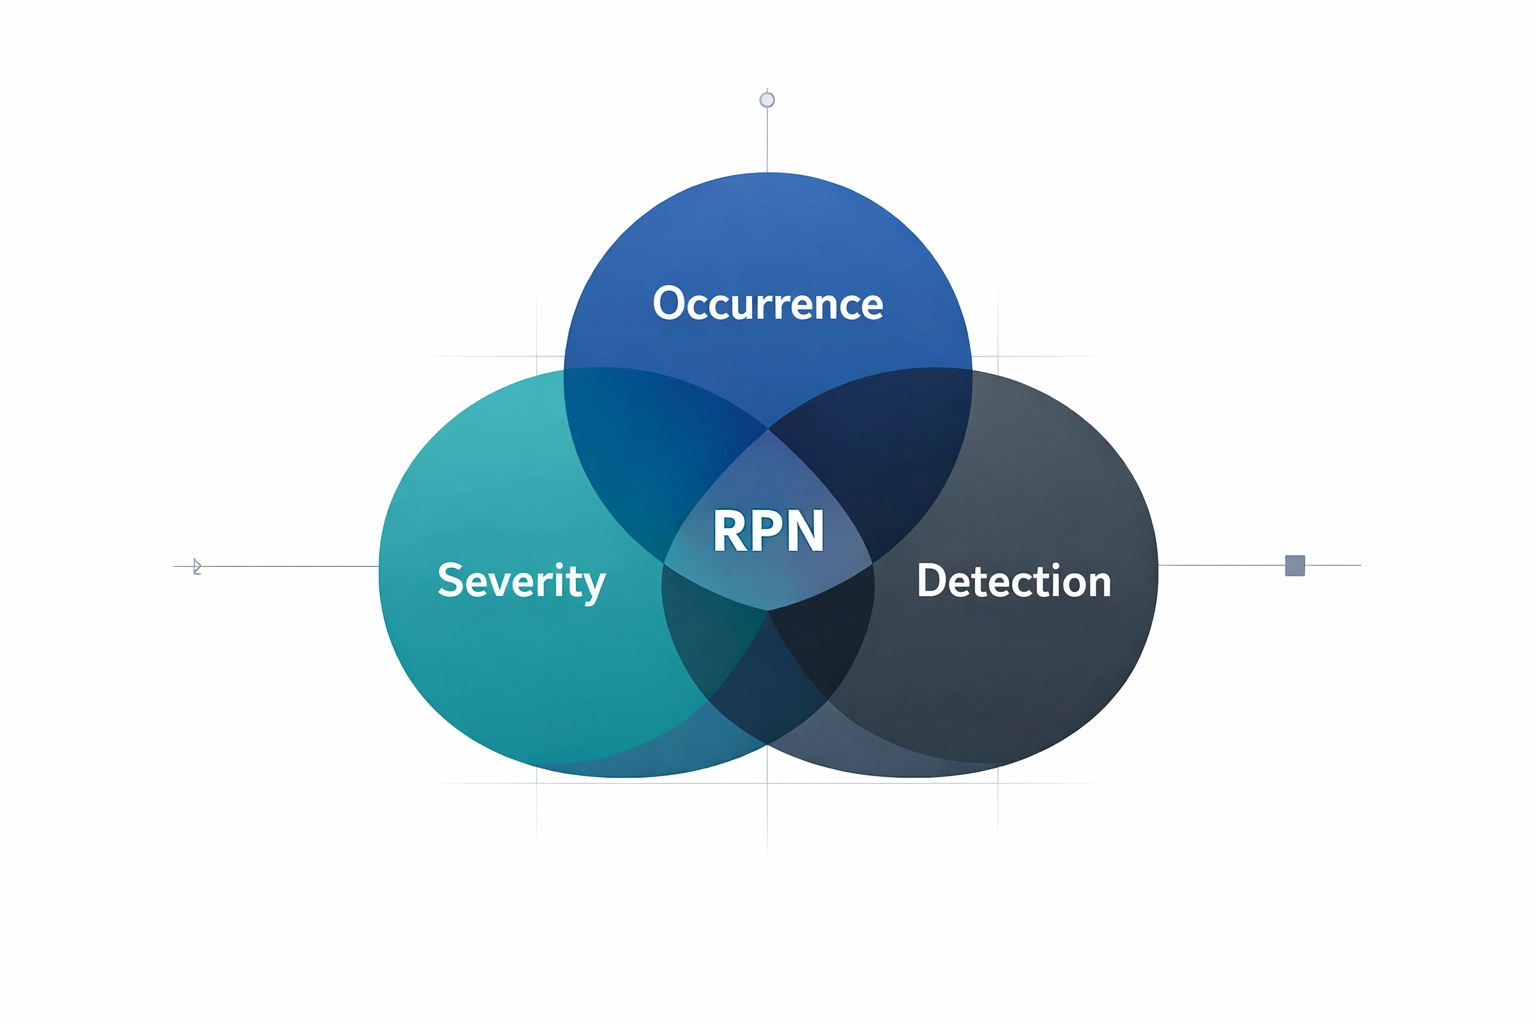
The fmea rpn score is not a subjective guess; it is a mathematical product of three distinct variables. Each variable is typically rated on a scale of 1 to 10, with 1 representing the lowest risk and 10 representing the highest.
1. Severity (S)
Severity assesses the impact of the failure mode on the customer or the subsequent process. In a manufacturing context, a Severity score of 10 might indicate a catastrophic safety failure or a breach of regulatory compliance. In contrast, a score of 1 represents a minor annoyance that the customer likely will not notice. Understanding severity is critical when identifying regulatory reporting issues in high-stakes industries like banking or healthcare.
2. Occurrence (O)
Occurrence measures the frequency or likelihood that a specific failure cause will happen. A score of 10 indicates that the failure is almost certain to occur regularly, whereas a score of 1 suggests the failure is technically possible but highly improbable based on historical data.
3. Detection (D)
Detection evaluates the effectiveness of current controls in catching the failure before it reaches the customer. This scale is inverted: a score of 1 means the system is virtually guaranteed to detect the failure (e.g., automated visual inspection), while a score of 10 means the failure is likely to pass through the entire process unnoticed.
The Calculation: How to Determine Your fmea rpn score
The formula for calculating the RPN is straightforward:
Severity (S) × Occurrence (O) × Detection (D) = RPN
Because each factor is rated from 1 to 10, the resulting fmea rpn score will range from 1 to 1,000.
To illustrate, consider a scenario in a food processing plant where a temperature sensor might fail:
- Severity: 9 (The food could spoil, leading to health risks).
- Occurrence: 3 (The sensor is high-quality and rarely fails).
- Detection: 5 (There is a manual check once per shift).
- RPN Calculation: 9 × 3 × 5 = 135
In isolation, 135 might seem high, but within the context of an enterprise-wide FMEA, it provides a benchmark for comparison against other potential failure modes, such as bottlenecks in the production line.
Why High Numbers Aren't Always a Disaster
A common misconception in Lean Six Sigma circles is that any fmea rpn score above a certain threshold (e.g., 150 or 200) constitutes an emergency. However, relying solely on the total number can be a dangerous oversight.
The primary purpose of the RPN is prioritization, not absolute measurement. A failure mode with an RPN of 100 might actually be more critical than one with an RPN of 120 if the lower-scored item has a higher Severity rating.
Consider these two hypothetical failure modes:
- Failure Mode A: Severity 10, Occurrence 2, Detection 5 (RPN = 100)
- Failure Mode B: Severity 4, Occurrence 6, Detection 5 (RPN = 120)
In this scenario, Failure Mode B has a higher fmea rpn score, but Failure Mode A involves a "Severity 10" (likely a safety or legal violation). Even though the math suggests B is the "higher risk," a seasoned Black Belt would prioritize Failure Mode A because the consequences of the failure are intolerable, regardless of how rarely it occurs.

Utilizing RPN in the DMAIC Framework
The FMEA is most commonly deployed during the Analyze and Improve phases of the DMAIC (Define, Measure, Analyze, Improve, Control) cycle. By quantifying risk, teams can move away from "gut feelings" and toward data-driven decision-making.
The Analyze Phase
During the Analyze phase, the FMEA helps validate root causes. If a team identifies a potential root cause with a high RPN, they have a strong case for focusing their improvement efforts there. It is essential to validate root causes before investing capital in solutions.
The Improve Phase
Once improvements are implemented: such as batch size reduction plans: the FMEA should be updated. The goal of any improvement project is to reduce the RPN by lowering the Occurrence (through process redesign) or increasing Detection (through better monitoring).

Strategic Limitations of the RPN
While the fmea rpn score is an invaluable tool, it is not without limitations. Professionals must be aware of the "Multiplicative Effect," where small changes in individual ratings can cause massive swings in the final score.
Furthermore, different teams may rate S, O, and D differently based on their subjective experiences. To mitigate this, organizations should develop clear, standardized scoring rubrics for each level (1-10). This ensures consistency whether you are evaluating cold chain logistics or transaction delays in payment processing.
Transitioning from FMEA to Process Control
Once the high-risk failure modes have been addressed and the RPN scores have been lowered, the focus shifts to sustainability. The FMEA effectively identifies where you need effective escalation procedures and what metrics should be displayed on a process control dashboard.
A living FMEA document is a hallmark of a mature Six Sigma organization. It should be revisited whenever:
- A new process is introduced.
- An existing process is modified.
- Customer complaints or rework and scrap rates increase unexpectedly.

Conclusion: Master the Math of Risk
The fmea rpn score is more than just a number; it is a strategic compass. By breaking down risk into Severity, Occurrence, and Detection, you gain the clarity needed to protect your customers and optimize your operations. Remember that a high score is not a disaster: it is a directive. It tells you exactly where to point your resources to achieve the greatest impact.
To truly master these analytical tools and lead high-impact projects that save organizations hundreds of thousands of dollars, professional certification is the logical next step.
Take the first step toward becoming a data-driven leader by enrolling in our CSSC-accredited training programs today. Visit Lean 6 Sigma Hub to explore our certification paths.