

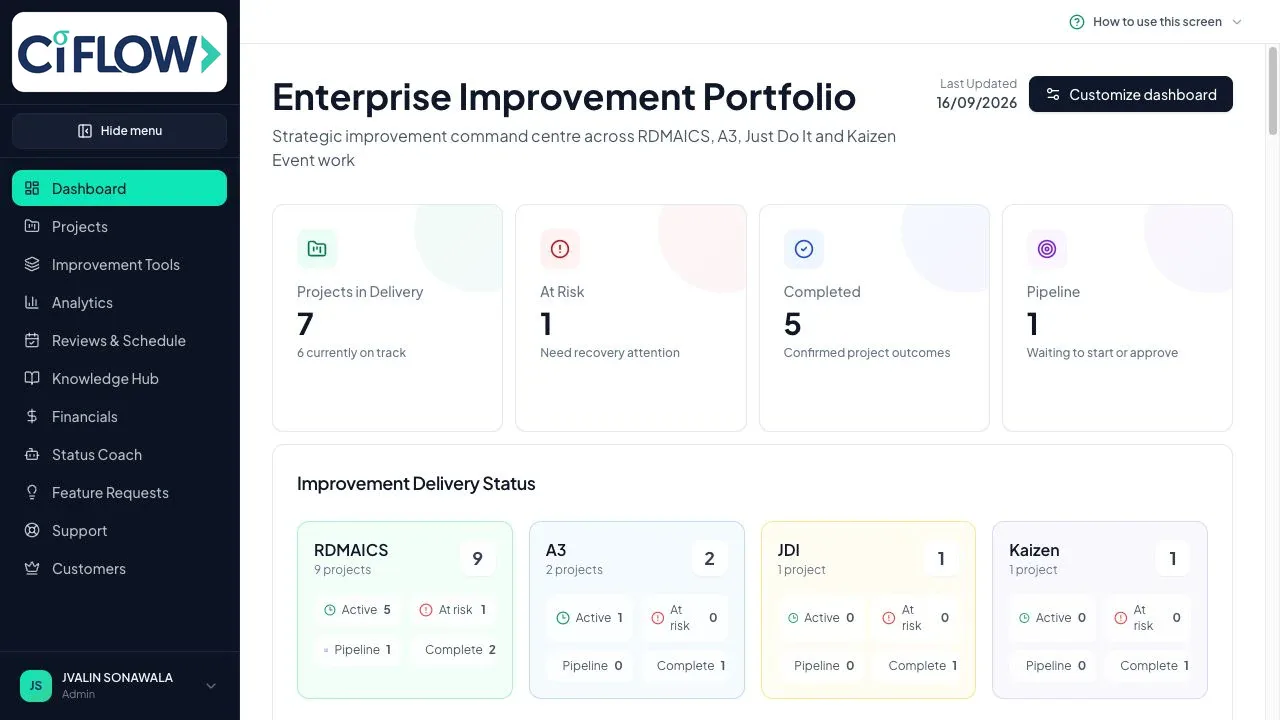
Improvement analysis becomes more valuable when every question, calculation, chart and decision remains connected to the project it supports.
Traditionally, practitioners have worked across a collection of separate resources: a calculation in a spreadsheet, a process map in a diagramming application, a template saved locally and a presentation assembled from files shared by several contributors. Each item may be technically correct, yet the complete analysis becomes difficult to reproduce. A reviewer can see the recommendation without seeing the evidence behind it. Six months later, the team may remember the decision but not the arithmetic that justified it.
Ci Flow changes the operating model by placing improvement and analysis tools inside the project workspace. The result is not simply a larger tool library. It is a more connected way to define the question, work with evidence, interpret the result and carry the conclusion into governance.
A Complete Tool Library Inside Every Project
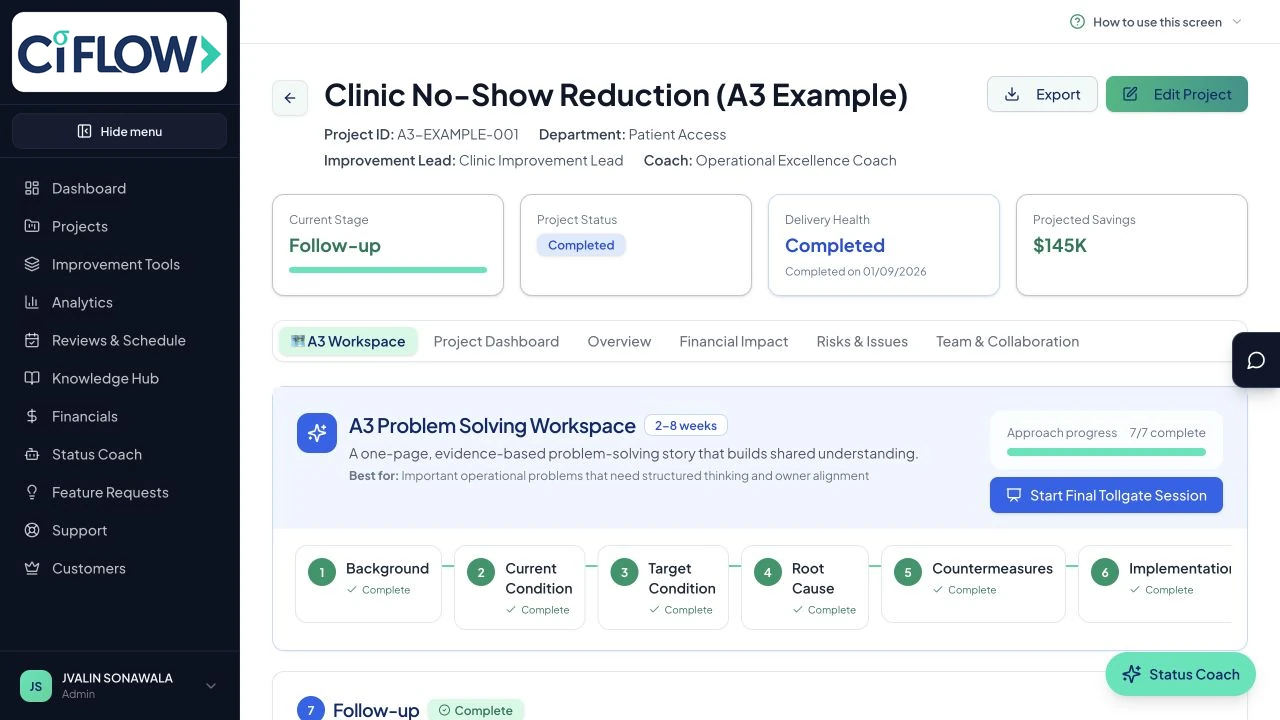
Ci Flow provides 290+ improvement and analysis tools within its connected project environment. Practitioners can work across RDMAICS, A3, Just Do It and Kaizen Event projects while keeping the relevant methods, outputs and decisions in one record.
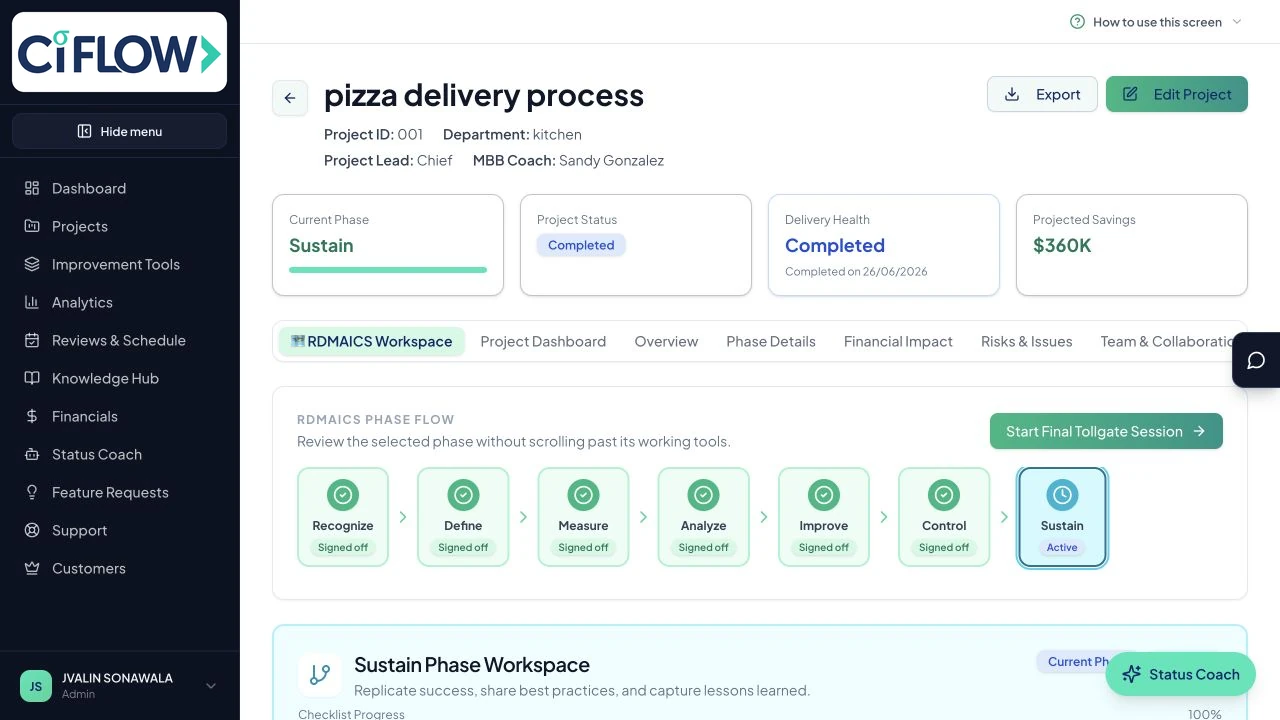
The platform combines:
- AI-enhanced tools and interpretation
- Interactive process and flow analysis
- Tool data exports
- AI interpretation exports
- Tollgate presentations built from saved project evidence
- Customisable headings, columns and terminology
- Collaboration, actions and decisions connected to the project
This matters because analysis is rarely a single calculation. A current-state map may lead to a data collection plan. The data may reveal a constraint that requires stratification, a Pareto analysis or a statistical test. The chosen countermeasure may then require a pilot, an implementation plan and a control method.
When those activities are held in one workspace, the chain of reasoning becomes visible.
Locate the Right Method for the Question
A library of 290+ tools is most useful when it is organised around the questions practitioners need to answer. Ci Flow’s toolset spans the improvement lifecycle.
Problem Definition and Scoping Tools
These tools establish the improvement opportunity and create a clear boundary around the work.
Examples include:
- Project charters
- SIPOC diagrams
- Voice of the Customer analysis
- Critical-to-Quality trees
- Stakeholder analysis
- RACI matrices
- Business case development
- Problem statements
- SMART objectives
- Scope definition
For example, a service team investigating appointment delays may use a SIPOC to define suppliers, inputs, process steps, outputs and customers before collecting detailed cycle-time data. A CTQ tree can then translate “faster appointments” into measurable requirements such as 95% of requests scheduled within two business days.
This structured beginning complements formal Lean Six Sigma training, where practitioners learn to connect customer requirements with measurable process outcomes.
Data Collection and Measurement Tools
A sound conclusion depends on sound measurement. The library includes methods that help teams define, collect and assess operational data.
Examples include:
- Data collection plans
- Operational definitions
- Check sheets
- Time observation sheets
- Measurement system analysis
- Attribute agreement analysis
- Sampling plans
- Process capability studies
- First Pass Yield calculations
- Rolled Throughput Yield calculations
Suppose a claims team records 1,200 transactions across five working days. A measurement plan can define the unit of analysis, the start and stop points for processing time, the required sample size and the data owner. By saving that information inside the project, the team can later explain not only the result, but also how the result was produced.
Analysis and Statistical Tools
Analysis tools help teams move from symptoms to evidence-based explanations.
Examples include:
- Pareto charts
- Fishbone diagrams
- Five Whys
- Histograms
- Box plots
- Scatter plots
- Control charts
- Capability analysis
- Regression
- ANOVA
- Hypothesis tests
- Correlation analysis
- Stratification tables
- Descriptive statistics
A team analysing invoice rework might compare error rates across four processing teams. If Team A records 3.1%, Team B 4.8%, Team C 8.7% and Team D 3.6%, the variation invites further investigation. A Pareto analysis may identify the dominant error categories, while a box plot or ANOVA can help determine whether observed differences are statistically meaningful.
The purpose is not to use every statistical method available. It is to select the method that answers the phase question with appropriate evidence.
Process and Flow Tools
Many improvement opportunities become visible only when the process is seen as a complete flow of work, information and decisions.
Ci Flow includes tools for:
- Value stream mapping
- BPMN 2.0 process modelling
- Spaghetti diagrams
- Process maps
- Swimlane diagrams
- Takt time
- Cycle-time analysis
- Work-in-process analysis
- Bottleneck analysis
- Lead-time analysis
A value stream map can connect process time, waiting, inventory and information flow. A BPMN 2.0 model can show decisions, handoffs and ownership. A spaghetti diagram can reveal unnecessary movement across a warehouse, clinic or production area.
These views answer different questions, but they become more powerful when their findings remain within the same project record.
For a practical explanation of flow metrics, see the process cycle efficiency calculator.
Countermeasure and Implementation Tools
Once a cause has been validated, the work shifts from understanding to action.
Practitioners can use tools such as:
- Idea generation
- Impact-effort matrices
- Solution selection matrices
- Pugh matrices
- FMEA
- Pilot plans
- Implementation plans
- Action registers
- Risk assessments
- Benefits tracking
- Change-readiness assessments
A countermeasure should have a clear owner, due date, expected effect and verification method. A pilot plan might specify that a new triage rule will be tested across 400 cases over ten business days, with success defined as reducing average response time from 18 hours to below 10 hours without increasing escalation errors.
The pilot testing guide provides additional guidance on defining success criteria before implementation.
Sustainment and Control Tools
Improvement is complete only when the new performance level can be maintained.
Sustainment tools include:
- Control plans
- Standard work
- Reaction plans
- Visual management
- Audit schedules
- Control charts
- Process ownership records
- Benefit-realisation tracking
- Lessons learned
- Handover checklists
The control record should explain what is monitored, how often it is reviewed, who responds to a signal and what action is required. Connecting this information to the original analysis makes the transition from project delivery to operational ownership much clearer.
Customise the Tools to Fit Your Operating System
A tool becomes more useful when it speaks the organisation’s language.
Ci Flow allows teams to rename headings, add or remove columns and adapt existing tools to match their terminology and operating system. A healthcare organisation might use “patient journey” rather than “customer journey.” A logistics provider may distinguish “consignment” from “order.” A finance team may require fields for account type, approval tier and regulatory impact.
This is more than cosmetic configuration. Language influences adoption. When practitioners recognise the terms, roles and decision points in a tool, they can apply it with less translation. A tool that fits the organisation’s working vocabulary is more likely to be used consistently across projects.
Keep the Input and Output Together
Every tool saves its inputs and outputs into the project record. This creates three practical advantages:
- Reproducibility: another practitioner can review the source data, assumptions and method.
- Consistent reporting: exports can draw on the same worked analysis rather than manually recreated charts.
- Evidence-based governance: tollgate presentations can use saved tools, data and interpretations from the project.
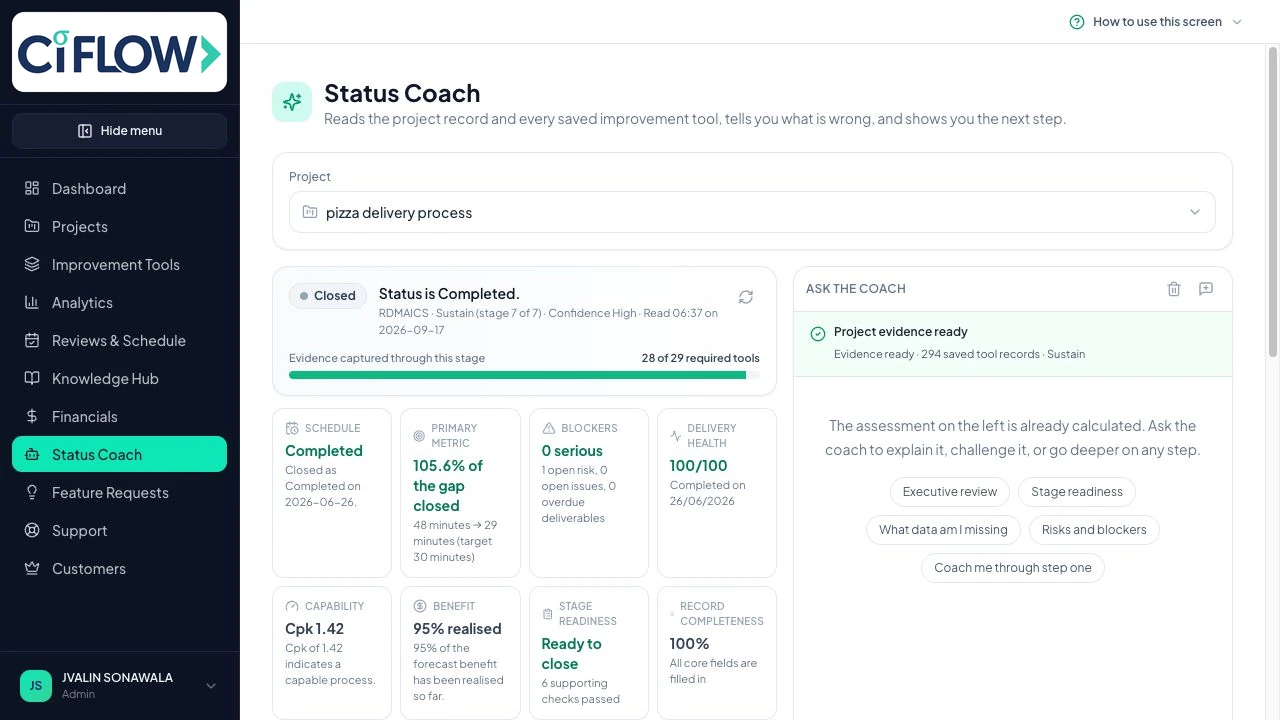
The platform also supports tool-data and AI-interpretation exports, allowing the analytical record and its explanation to travel together when required. AI interpretation can help explain findings in practical language, while the underlying project record remains available for review.
This distinction is important. An interpretation should clarify the evidence, not replace it. The project team should be able to move from a conclusion back to the relevant data, assumptions and method.
A Worked Comparison: Four Files Versus One Connected Project
Consider a distribution team improving order-picking accuracy. The team analyses 18,400 orders and identifies a baseline accuracy of 92.8%.
Disconnected Approach
The team uses:
- A spreadsheet for defect calculations
- A diagramming file for the process map
- A separate presentation for the Pareto chart
- An email folder for decisions and countermeasure notes
Preparing the tollgate review takes 7 hours. When a reviewer asks how the team selected the primary cause, the practitioner spends 45 minutes checking file versions and reconstructing the calculation.
Six months later, a new project leader asks why the team introduced a two-step scan verification. The original decision is supported by several files, but the relationship between the validated cause, the chosen countermeasure and the expected benefit requires manual reconstruction.
Connected Project Approach
The team completes the same work inside one project:
- The charter defines the accuracy target.
- The data tool records the 18,400 orders.
- The Pareto analysis identifies the leading error category.
- The process map shows where the error enters the flow.
- The countermeasure tool records the selection criteria.
- The pilot plan defines the verification period.
- The tollgate presentation draws on saved evidence.
Review preparation takes 2.5 hours, a saving of 4.5 hours. When challenged on methodology, the team can navigate directly from the result to the source data and method. Six months later, the new project leader can see the original baseline, the validated cause, the decision criteria and the measured outcome in one place.
Assume the pilot increases accuracy from 92.8% to 97.4% across 6,000 orders. The project record can show both the improvement and the reasoning that supports it.
Practical Guidance for Choosing Tools with Intent
A large library creates flexibility, but disciplined selection remains essential.
Use this sequence:
- Start with the question. What does the phase need to establish?
- Define the evidence required. What data, observation or stakeholder input will answer it?
- Select the proportionate tool. Use the simplest method that provides sufficient confidence.
- Record the reasoning. Explain why the tool was selected and what its output means.
- Connect the result to the next decision. Show how the finding changes the project direction.
- Keep the toolset focused. More tools do not automatically create better analysis.
For instance, if the question is “Where does waiting accumulate?” a time observation sheet, value stream map and queue analysis may be more useful than several unrelated charts. If the question is “Are four process teams performing differently?” stratification, box plots and ANOVA may provide a stronger analytical path.
The goal is not to demonstrate the size of the tool library. The goal is to create a clear evidence trail from the improvement question to the decision.
Who Benefits from a Connected Toolset?
Ci Flow is designed for:
- Practitioners building a disciplined, reusable improvement toolset
- Black Belts and Green Belts leading data-driven projects
- Improvement leaders standardising methods across teams
- Organisations replacing disconnected templates with one operational-excellence system
- Executives and sponsors who need clear evidence at tollgates and portfolio reviews
A connected workspace is particularly valuable when several teams use the same methodology. Leaders can establish consistent expectations while allowing practitioners to select tools that fit the problem. Teams can retain local terminology without losing shared governance, project visibility or evidence standards.
Build a More Connected Improvement Practice
A broad toolset gives practitioners choice. A connected project record gives that choice discipline.
When tools, inputs, outputs, interpretations, decisions and actions remain together, teams can work with greater clarity. Reviews become easier to prepare. Methodology challenges can be answered with evidence. Countermeasures remain linked to the causes they address. Future project leaders can understand not only what changed, but why the change was selected.
Explore the full Ci Flow tool library, including example projects and connected project workflows. Start a 14-day free trial with no credit card required and examine how your team can keep every analysis connected to the project.
Start your 14-day free trial at Ci Flow
Kaizen. Kai-Care. Kai-Done. Lean Six Sigma





