
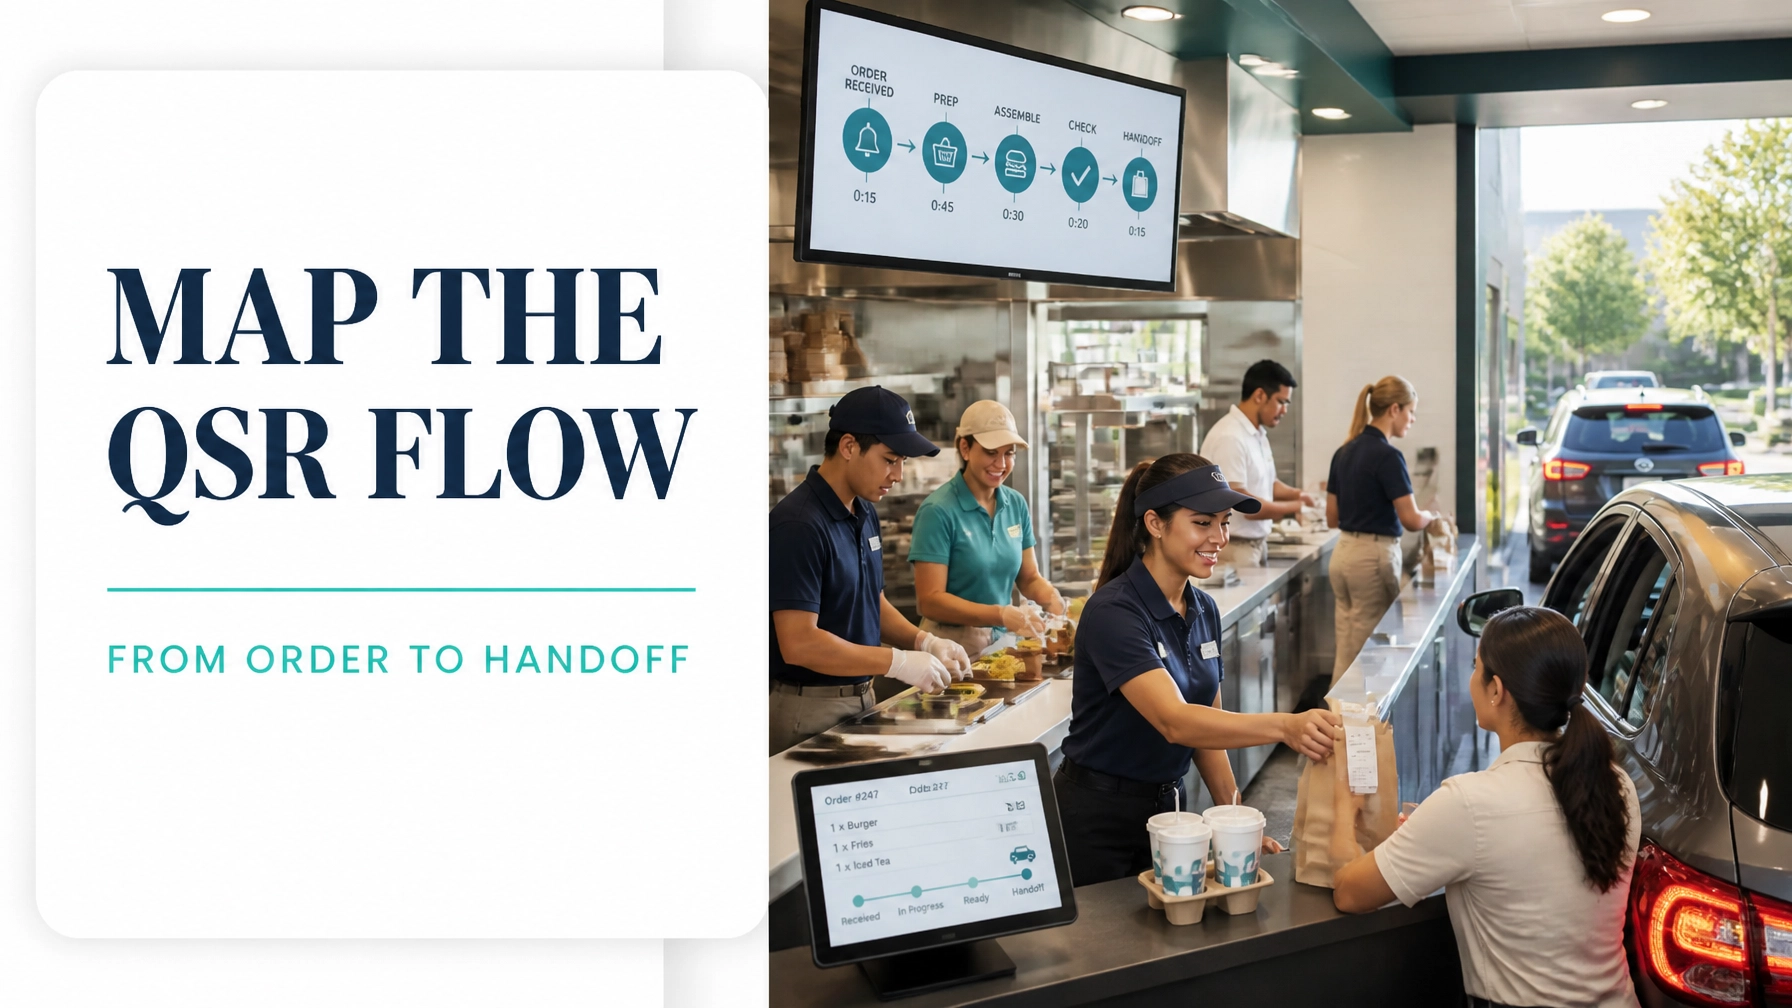
In quick-service restaurants, customers experience one journey: order, pay, wait, receive. The operation experiences several connected flows: drive-thru vehicles, dine-in customers, kitchen orders, ingredients, information, and finished meals.
That is why isolated fixes often produce limited results. Faster order taking does not help if food preparation is constrained. More kitchen labour does not help if orders arrive in uneven batches. A value stream map reveals the whole system.
Value Stream Mapping (VSM) documents every value-creating and non-value-creating step required to deliver a product or service. The Lean Enterprise Institute describes VSM as a method for showing both material and information flow through a current and future state.
This worked example uses a hypothetical urban quick-service restaurant during the lunch peak. The figures are realistic planning data, not a universal benchmark. Each restaurant should validate its own baseline with direct observation.
Start with Value, Demand and Takt Time
The fundamental purpose of a QSR value stream is to deliver an accurate, fresh order at the pace customers require.
For this example:
- Effective peak operating time: 45 minutes per hour
- Average demand: 75 orders per hour
- Demand mix: 60 drive-thru and 15 dine-in orders per hour
- Takt time: 2,700 seconds ÷ 75 orders = 36 seconds per order
- Current first-pass yield: 94.5%
- Current average drive-thru lead time: 5 minutes 25 seconds
The customer’s Voice of the Customer may include:
- “My order should be correct.”
- “I should not wait behind vehicles with much larger orders.”
- “The food should be hot and complete.”
- “The pickup process should be clear.”
The Voice of the Business adds throughput, labour productivity, food safety, margin and capacity. The Voice of the Process comes from actual order timestamps, queue lengths, preparation times and remake data. A strong VSM balances all three voices.
Current-State Map: Where the Waiting Accumulates
The current-state information flow begins when the customer arrives at the menu board, approaches the counter or submits a digital order. The order then moves to the point-of-sale system and kitchen display system.
The physical flow is different for each channel:
- Drive-thru: arrival queue → order speaker → payment window → kitchen preparation → assembly → handoff window → exit.
- Dine-in: entrance or kiosk → payment → kitchen preparation → tray assembly → counter pickup or table delivery.
- Shared constraint: both channels compete for preparation equipment, ingredients, assembly space and team attention.
At 75 orders per hour, food preparation has an observed cycle time of approximately 105 seconds per order. Three parallel preparation positions provide a theoretical capacity of 105 ÷ 3 = 35 seconds per order, barely below the 36-second takt time. Interruptions, ingredient replenishment and complex menu items quickly consume that small margin.

Current-State Data Table
| Process step | Drive-thru VA | Drive-thru NVA | Dine-in VA | Dine-in NVA | Main observation |
|---|---|---|---|---|---|
| Arrival and queue | 0 sec | 52 sec | 0 sec | 18 sec | Demand arrives in uneven bursts |
| Order taking | 0 sec | 34 sec | 0 sec | 28 sec | Clarification and menu variation add delay |
| Payment | 0 sec | 24 sec | 0 sec | 16 sec | Cash, card and queue positioning vary |
| Food preparation | 96 sec | 61 sec | 96 sec | 47 sec | Primary bottleneck and WIP accumulation |
| Assembly and verification | 31 sec | 18 sec | 31 sec | 12 sec | Orders wait for missing items or drinks |
| Handoff or tray pickup | 5 sec | 4 sec | 5 sec | 3 sec | Rechecks and customer identification |
| Total | 132 sec | 193 sec | 132 sec | 124 sec | Drive-thru lead time: 325 sec |
The current drive-thru Process Cycle Efficiency is:
PCE = Value-Added Time ÷ Total Lead Time
PCE = 132 ÷ 325 = 40.6%
In this classification, order taking and payment are necessary but not value-added because they do not transform the meal. Food preparation and assembly are treated as value-added activities because they create the product the customer ordered.
The most important discovery is not the 96 seconds of preparation work. It is the 61 seconds of waiting around preparation. That waiting represents queueing, uneven release of work, missing ingredients and competition between order channels.
Analyse the Bottleneck Before Adding Resources
The Analyse phase of DMAIC identifies root causes through statistical and visual tools rather than assumptions. A Time Observation Sheet should capture at least 30 observations per major step, stratified by daypart, channel, menu family and team configuration.
Useful analysis includes:
- An Average (Mean) for the baseline cycle time.
- A Box Plot to reveal spread, skewness and complex-order outliers.
- Attribute Data, such as Pass/Fail order accuracy and remake reasons.
- A Pareto chart of delays, with missing items, cooking time and payment variation separated.
- ANOVA to compare mean preparation times across menu families or shifts.
- Bartlett’s Test to assess whether group variances are equal before relying on ANOVA assumptions.
- A check for measurement Bias, such as staff starting the stopwatch at different points.
- Z-Scores to compare an unusually slow order with other distributions.
- An X-bar Chart alongside an R chart to detect shifts in average preparation time.
- Yield measures: current First Pass Yield is 94.5%, while Rolled Throughput Yield declines when errors occur across multiple handoffs.
The team should also distinguish common-cause variation from special-cause variation. Normal variation may come from menu mix; special causes may include an empty fryer, a failed payment terminal or a new employee without standard-work training.
This is where the Theory of Constraints applies: improve the limiting factor first. The bottleneck is not automatically the busiest-looking employee. It is the process step that constrains total throughput.
Future-State Map: Create Pull, Flow and Clear Priorities
The future state should not simply demand that employees work faster. It should redesign how work is released and coordinated.
The proposed future state includes:
- A single pacemaker at kitchen release. Orders are released in small, level increments rather than allowing large batches to accumulate.
- A visual Andon signal. A red signal alerts the team when preparation exceeds the target or when a station needs support.
- Autonomation, or Jidoka. The kitchen display system flags an ageing order and stops silent escalation of defects.
- Standard order families. Simple, moderate and complex orders receive defined preparation routes.
- Point-of-use staging. High-volume ingredients and packaging are positioned at the relevant station.
- Dedicated assembly ownership. One person verifies the order against the screen before handoff.
- A controlled dine-in and drive-thru queue rule. Neither channel is allowed to overwhelm the shared preparation constraint.
- Error-proofing at order entry. Modifiers and allergen requirements are confirmed before payment.

With these changes, the illustrative future-state drive-thru metrics are:
| Measure | Current state | Future state |
|---|---|---|
| Average lead time | 325 sec | 208 sec |
| Value-added time | 132 sec | 111 sec |
| Non-value-added time | 193 sec | 97 sec |
| Process Cycle Efficiency | 40.6% | 53.4% |
| First Pass Yield | 94.5% | 97.5% |
| Throughput capacity | 75 orders/hour | 84 orders/hour |
The lower value-added time reflects simpler work, fewer interruptions and reduced rework: not reduced product quality.
Kaizen Sequencing Plan
Agile’s flexible, iterative approach complements Lean Six Sigma when used within disciplined governance. The team can run short improvement cycles while still using DMAIC to validate causes and sustain results.

Sequence the work in four waves
-
Measure and stabilise : Week 1
Complete the Time Observation Sheet, validate operational definitions, confirm takt time and create the current-state map. Use an Affinity Diagram to organise employee and customer ideas into natural categories such as ordering, payment, preparation, assembly and handoff. -
Balance and simplify : Weeks 2–3
Rebalance preparation tasks, stage ingredients, establish standard work and reduce unnecessary Work in Process. Apply the eight DOWNTIME wastes: Defects, Overproduction, Waiting, Non-utilised talent, Transportation, Inventory, Motion and Extra-processing: as a practical observation lens. -
Pilot and learn : Weeks 4–5
Run a controlled pilot during two lunch periods. Use an Agile stand-up, visual board and daily review. Compare average lead time, variation, yield, queue length and customer complaints against baseline. -
Control and sustain : Weeks 6–8
Implement X-bar monitoring, Andon response rules, leader standard work and weekly process audits. Approval checkpoints support governance, but excessive approval can create a new bottleneck. Keep approvals limited to safety, financial and operational decisions that genuinely require escalation.
Business Case and ROI-Style Outcome
A practical Business Case should connect customer experience to operational economics.
Assume the future state creates capacity for 9 additional orders per peak hour, across four peak hours per day and 300 operating days annually:
- Incremental annual orders: 9 × 4 × 300 = 10,800
- Contribution margin per order: $4.00
- Capacity-related contribution: $43,200
- Remake reduction: 4,050 fewer remakes × $5.50 = $22,275
- Estimated annual benefit: $65,475
- Implementation cost: $18,000
- Estimated first-year net benefit: $47,475
- Simple payback: approximately 3.3 months
Break-even occurs after roughly 4,500 avoided or additional contribution-generating orders, depending on the restaurant’s margin structure.
A White Belt can recognise the waste and understand DMAIC. A Yellow Belt can support observations and kaizen activity. A Green Belt can lead the data collection, analysis and pilot. A Black Belt can manage the cross-functional project, mentor Green Belts and connect the improvement to broader business priorities.
The principle behind all of this is Y = f(x): customer experience and throughput are outputs influenced by inputs such as menu mix, staffing, equipment uptime, order release and standard work. Zero Defects, following Philip Crosby’s philosophy, means designing the process to do the order correctly the first time: not relying on final inspection to discover mistakes.
Build the capability to map, analyse and improve real processes with CSSC-accredited, self-paced Lean Six Sigma training from Lean 6 Sigma Hub. Explore the Green Belt programme or use the Process Cycle Efficiency Calculator to quantify waiting in your own value stream.
Kaizen. Kai-Care. Kai-Done. ( Lean Six Sigma)


