


Series post 3 of AI in Lean Six Sigma: a practical guide for hospital operations leaders, ED directors and clinical quality managers.
When the ED gets busy, the visible queue may not be the real constraint
Consider a regional hospital emergency department (ED) where 43% of patients miss the four-hour wait target, median triage-to-provider time is 12 minutes, and 2.1% of patients leave without being seen (LWBS).
The familiar response is to add staff during the busiest hours. That can help, but it may not address the system’s main constraint. Patient arrivals are variable, and the time it takes to move an inpatient from discharge to a bed being ready for the next patient can quietly restrict flow. If admitted patients remain in the ED while beds are unavailable, extra ED capacity alone may not clear the queue.
AI in healthcare operations can make patterns and risks more visible earlier. It can forecast demand, help locate bottlenecks and support timely operational decisions. But a prediction is not an improvement by itself. It must connect to a validated process change, a responsible decision-maker and a way to measure the result.
That is where the combination of AI and Lean Six Sigma becomes useful: AI helps teams see and anticipate patterns; DMAIC provides a disciplined method for testing what to change and sustaining the gains.
Map the healthcare AI toolkit to DMAIC
Define: identify the decision and the patient-flow outcome
Before selecting a model, define the problem the hospital wants to solve. Is the priority reducing boarding, speeding initial assessment, improving bed availability or lowering LWBS? These are related outcomes, but they are not interchangeable.
Set clear critical-to-quality measures, such as:
- Door-to-provider time and four-hour target performance
- ED length of stay, split by discharged and admitted patients
- Boarding time from admission decision to inpatient transfer
- Discharge-to-ready time for inpatient beds
- LWBS rate, stratified by hour, day and acuity
Also define the model’s intended user and action. A forecast of likely boarding is useful only if the hospital agrees who receives it, what that person can do and when escalation is appropriate. This aligns with Lean Six Sigma’s focus on the Voice of the Customer (in healthcare, patients’ need for timely, safe care) while balancing clinical, operational and regulatory requirements.
Measure: establish a trustworthy view of flow
AI is only as dependable as the data feeding it. A hospital may begin by bringing together:
- Automated EHR timestamps for arrival, triage, provider assessment, orders, disposition and transfer
- Real-time bed-status information, including occupancy, cleaning and readiness
- Staffing, diagnostic turnaround and inpatient discharge data
- Natural language processing (NLP) to flag relevant signals in triage notes for review
NLP could help surface note patterns associated with higher acuity or a likely need for additional assessment. It should support, not replace, clinical triage or professional judgment. Teams should confirm that timestamps mean the same thing across departments, that missing data are visible and that definitions are consistent. Otherwise, apparent process variation may reflect inconsistent recording rather than actual performance.
For more on establishing reliable inputs, see Lean 6 Sigma Hub’s guide to data collection methods.
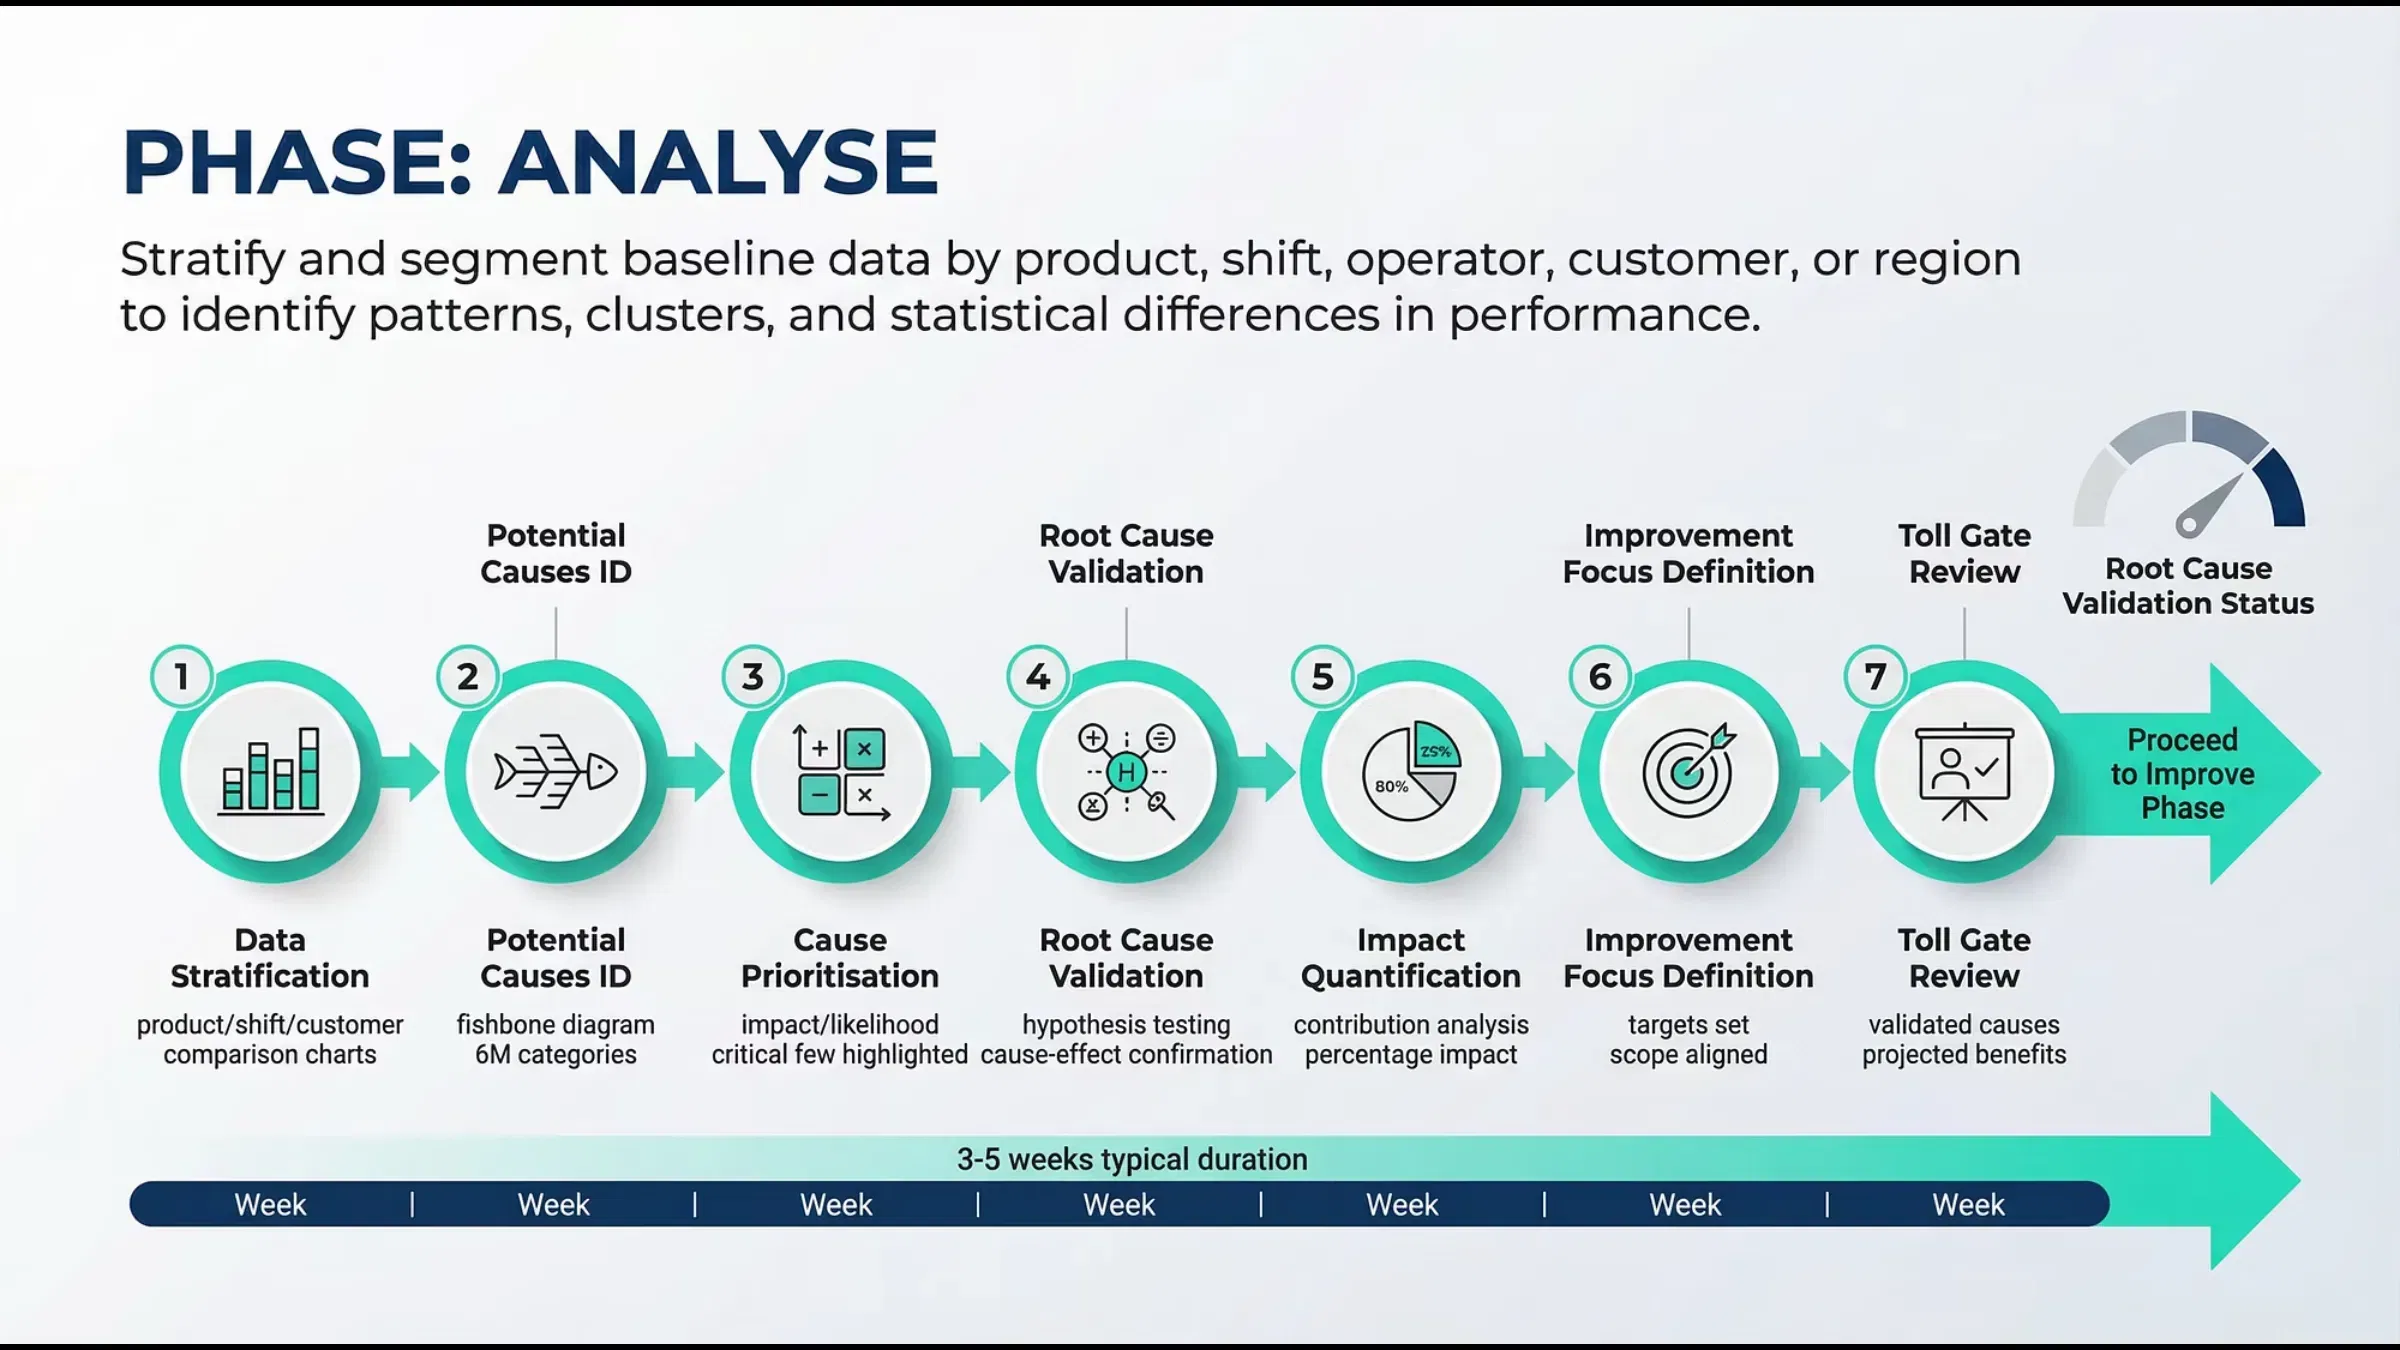
Analyse: find the constraint behind the queue
In this example, the hospital reviews five years of arrival, bed-management and discharge data. Analysis shows that arrivals vary substantially by hour and day, but the clearest recurring constraint is bed turnover: the median time from an inpatient discharge to the bed being ready for the next patient is 38 minutes.
That finding does not mean arrivals are irrelevant. It means the improvement team should test whether inpatient bed availability is a more influential constraint on ED boarding than arrival volume alone. The team can stratify flow by shift, unit, day of week and admission status, then validate possible causes with process observation and frontline staff.
The analysis also examines the relationship between boarding time and LWBS. If longer boarding periods tend to coincide with more patients leaving before assessment, that is a signal to investigate, not proof that boarding alone caused those departures. Patient mix, arrival peaks, staffing and other constraints may also contribute.
This is the purpose of the Analyse phase: move from a plausible explanation to evidence-backed, validated root causes. Visual tools such as process maps and Pareto charts can help locate where flow slows; statistical analysis can test whether differences are consistent and meaningful. Lean 6 Sigma Hub’s root-cause analysis guide offers additional methods for structuring that work.
Improve: test changes in a simulation before changing the live system
Once the team understands the constraints, it can compare interventions before committing to new staffing or workflows. A discrete-event simulation, sometimes developed as a digital twin, represents how patients, staff, beds and queues move through the ED and connected inpatient processes.
The team might model:
- A fast-track lane for suitable lower-acuity cases
- A revised triage process or provider-in-triage model
- A discharge lounge to support earlier inpatient bed release
- Changes to bed-cleaning escalation or discharge coordination
A simulation can help reveal whether an intervention shortens one queue but simply moves waiting elsewhere. Monte Carlo simulation can test a range of arrival curves and service-time assumptions rather than relying on a single “average” day. That matters in an ED, where demand is variable and capacity decisions carry clinical consequences.
Simulation results are not guaranteed real-world outcomes. They depend on assumptions about demand, resources and process behaviour. Validate those assumptions with clinical and operational teams, then pilot the most promising option and measure its effect.
Control: turn a forecast into a timely, accountable response
A model might generate a message such as: “Boarding risk high in the next two hours; six patients likely.” In this example, it produces that forecast 45 minutes ahead, giving the charge nurse and bed-management team time to review capacity and prepare an appropriate response.
That message should be treated as decision support, not an instruction. The team needs an agreed response protocol: who reviews the risk, what information they check and which escalation steps are within their authority.
A control plan can pair operational measures (such as boarding duration, LWBS and bed turnover) with traditional control charts. AI anomaly scoring may add a signal that a pattern is unusual, but it should complement rather than replace defined process measures and control limits. Teams should also monitor forecast accuracy and alert volume so that the system remains useful to the people working in the process.
Worked example: what a hypothetical improvement could look like
Suppose the hospital tests a combined package: a fast-track pathway, revised discharge coordination and a forecast-led bed escalation huddle. Following a controlled pilot, the team reports these illustrative results:
| Measure | Before | After |
|---|---|---|
| LWBS rate | 2.1% | 0.8% |
| Patients missing the four-hour target | 43% | 12% |
| Median door-to-provider time | 12 minutes | 7 minutes |
| Median inpatient bed turnover time | 38 minutes | 24 minutes |
These are example figures for a worked scenario, not a guaranteed result or a published hospital case study. A real improvement team would define its measurement period, confirm that the comparison is fair, and check for changes in patient mix, staffing or operating conditions. It would also review balancing measures such as safety events, workload and time spent waiting in other parts of the hospital.
The important lesson is that the gains come from the operational changes and the way they are implemented, not from an algorithm in isolation. The model helps the team anticipate likely pressure. DMAIC helps determine what to change, test whether it works and establish how to sustain it.
The work also has real resource requirements. A hospital should plan for:
- An EHR integration project and the technical work needed to make operational data usable
- Data governance and privacy review, including applicable requirements such as HIPAA or GDPR, depending on jurisdiction
- Approximately four months of model training and validation in this example
- At least one analyst to support data preparation, evaluation and ongoing monitoring
These are planning considerations, not a cost estimate. Local infrastructure, data access and governance requirements will influence the effort.
What leaders should plan for before deployment
Evidence and implementation experience point to several risks that deserve attention from the start. Research reviews report that many ED forecasting studies are retrospective or single-site, so strong performance at one hospital does not establish effectiveness elsewhere. See the systematic review of AI and machine learning for ED overcrowding and the review of machine-learning admission prediction.
- Models may not transfer between hospitals. Differences in patient mix, referral patterns, documentation, staffing and bed capacity can affect performance. Validate locally and check results across relevant patient groups.
- Over-prediction can create alert fatigue. If warnings are frequent but rarely lead to useful action, staff may stop paying attention. Keep alerts actionable, route them to a named role and monitor response and override patterns.
- Data and process conditions change. Opening a new wing, changing an admission pathway or updating the EHR can alter the data a model relies on. Monitor for drift and define when the team will review, recalibrate or pause a model.
- Clinical judgment must remain central. Clinicians need to understand what the forecast is for, when it may be unreliable and how to override or question it. AI should inform operational decisions, not determine clinical priority.
These safeguards are part of the improvement system, not optional additions. The FDA’s AI and digital health resources provide further context on AI in health-related settings.
Ci Flow: where AI insights become managed improvement work
The predictive models described here belong in the hospital’s analytics environment, where they can use approved data sources and be governed by the organisation’s technical and clinical controls. Ci Flow is separate from that analytics stack: its role is to help teams manage the improvement work that follows from an insight.
For a healthcare improvement team, Ci Flow provides a digital workspace for structured project tracking, team collaboration, actions and decisions. Teams can use its methodology-led project workspaces and AI-supported interpretation features to keep project evidence and next steps connected. Portfolio reporting can help leaders review improvement work across projects.
Operational data and forecasting outputs should only be brought into a project workflow through an organisation-approved approach. This article does not assume a specific automated hospital-system integration. In practice, a hospital may use its own analytics platform to show live operational KPIs during daily huddles, then track agreed countermeasures, owners and follow-up in Ci Flow. The aim is to connect the signal, the decision and the improvement action without confusing an operational prediction tool with a continuous-improvement platform.


Take the next step: build both capability and infrastructure
For teams: Explore Ci Flow to see how a structured workspace can support improvement projects, collaboration and portfolio visibility.
For professionals: Build the skills to lead the work. Lean 6 Sigma Hub offers CSSC-accredited Green Belt training, including practical project learning, and CSSC-accredited Black Belt training for professionals preparing to lead complex, system-level change.
Choose the pathway that fits your role, strengthen your improvement capability and put evidence-led healthcare change into practice.
Kaizen. Kai-Care. Kai-Done. Lean Six Sigma


