

In most organizations, the real work is invisible. You see people typing at keyboards, machines humming on the factory floor, and trucks leaving the loading dock. But if you ask the average manager how value actually moves from a customer’s initial request to the final delivery, you’ll likely get a shrug or a fragmented explanation that only covers one department.
The hard truth? Most processes are a mess. They are riddled with hidden delays, redundant approvals, and mountains of "Work-In-Progress" (WIP) that no one notices because it’s tucked away in email inboxes or digital folders. If you can't see the mess, you can't fix it.
This is where Value Stream Mapping (VSM) comes in. It is the ultimate tool for "seeing the unseen." It moves the conversation away from individual performance and shifts the focus to the entire system. At Lean 6 Sigma Hub, we don't just teach you how to draw boxes and arrows; we teach you how to dismantle a broken system and rebuild it for maximum flow.
What is a Value Stream, Anyway?
Before we dive into the mapping, let’s get the terminology straight. According to our Lean Six Sigma Concepts and Glossary, a Value Stream includes every single action: both value-adding and non-value-adding: required to bring a product or service through the main flows essential to every product.
Think of it as the DNA of your operation. It encompasses the flow of materials from suppliers to customers and the flow of information that triggers that movement. Value Stream Mapping is the process of visually charting that flow on a single page. It provides a "birds-eye view" of the chaos, allowing you to identify exactly where value is being created and where it is being strangled by waste.
Why Your Current View is Probably Wrong
Most managers suffer from "Functional Myopia." They optimize their own department: be it Sales, Engineering, or Production: without realizing they might be making the overall system worse. You might reduce the cost of raw materials by buying in bulk, but if that creates a massive backlog in the warehouse, you haven’t saved the company a dime; you’ve just moved the mess.
VSM forces you to step back and look at the end-to-end lead time. It doesn't care about how fast one person works; it cares about how long the customer has to wait.

The Anatomy of a Value Stream Map
A professional VSM is more than just a flowchart. While process mapping in the Measure phase focuses on the "how" of a specific task, VSM focuses on the "flow" of the entire system. A standard map consists of three main components:
- The Information Flow: Usually at the top of the map, this shows how orders are placed, how production is scheduled, and how data moves between the customer, the supplier, and your internal "Production Control."
- The Material (or Work) Flow: The middle section, showing the physical or digital movement of the product through various process steps.
- The Timeline: The most critical part. It sits at the bottom and compares Value-Add Time (the time spent actually working on the product) against Lead Time (the total time the product spends in the system).
To truly "see the unseen," you need to populate these steps with hard data. We look at Cycle Time (C/T), Changeover Time (C/O), and Uptime. In manufacturing environments, understanding setup time reduction is often the key to unlocking the entire map's potential.
Seeing the "Unseen" Killers of Efficiency
When you lay out your Current State Map, the "mess" becomes undeniable. You will start to see the four invisible killers that haunt every inefficient business:
1. The Inventory Piles (The "Black Holes")
In VSM, triangles represent inventory or queues. In an office, these are the 400 unread emails or the "pending approval" tickets. This is capital tied up doing nothing. It hides defects and slows down your response time to the customer.
2. The Fragile Handoffs
Every time a project moves from one department to another, there is a risk of data loss or "re-entry." VSM exposes these handoffs. If your map shows work bouncing back and forth between "Design" and "Client Approval" five times, you’ve found your bottleneck.
3. Non-Value Added (NVA) Time
This is the most shocking revelation for most teams. You might find that it takes 20 days to deliver a product (Lead Time), but only 2 hours of actual work was performed (Value-Add Time). The other 19 days and 22 hours were spent waiting. Wait time is the enemy of profit.
4. Information Silos
If your production team is working off a schedule that is three days older than the sales team's data, you are destined for failure. The VSM highlights the "Information Flow" gaps that lead to overproduction and wasted effort.

The "Genba" Walk: Mapping from the Floor, Not the Boardroom
One of the biggest mistakes leaders make is trying to create a Value Stream Map while sitting in a conference room. They use "should-be" logic instead of "is" reality.
To see the unseen, you must Go to the Genba: the place where the work happens. Walk the flow yourself. Talk to the operators. Ask them what stops them from finishing their work. Often, you'll find that the official process documentation bears little resemblance to the actual day-to-day struggle.
During this walk, look for the "hidden factory": the extra steps people have created to get around broken systems. Once you have captured the "Current State" based on reality, you can begin the transformation.
Moving from "Mapping the Mess" to "Designing the Future"
The map itself is not the goal. The goal is the Future State Map. This is where you apply Lean principles to eliminate the waste you've identified.
When designing the future, you must decide between quick wins and long-term solutions. While a massive system overhaul might be the ultimate goal, a few Kaizen events focused on the biggest bottlenecks can yield immediate results.
As you implement these changes, you must ensure they are permanent. This requires documenting your process changes properly to prevent the "mess" from creeping back in once the consultants leave the room.
Why You Need a Professional Perspective
Value Stream Mapping is a high-altitude skill. It requires an objective eye and a deep understanding of Lean Six Sigma methodologies. It’s easy to draw a map; it’s incredibly difficult to interpret one and drive the cultural change necessary to fix what the map reveals.
At Lean 6 Sigma Hub, we provide the frameworks to help you master these tools. Whether you are looking at a manufacturing line or a software development lifecycle, the principles of flow remain the same.

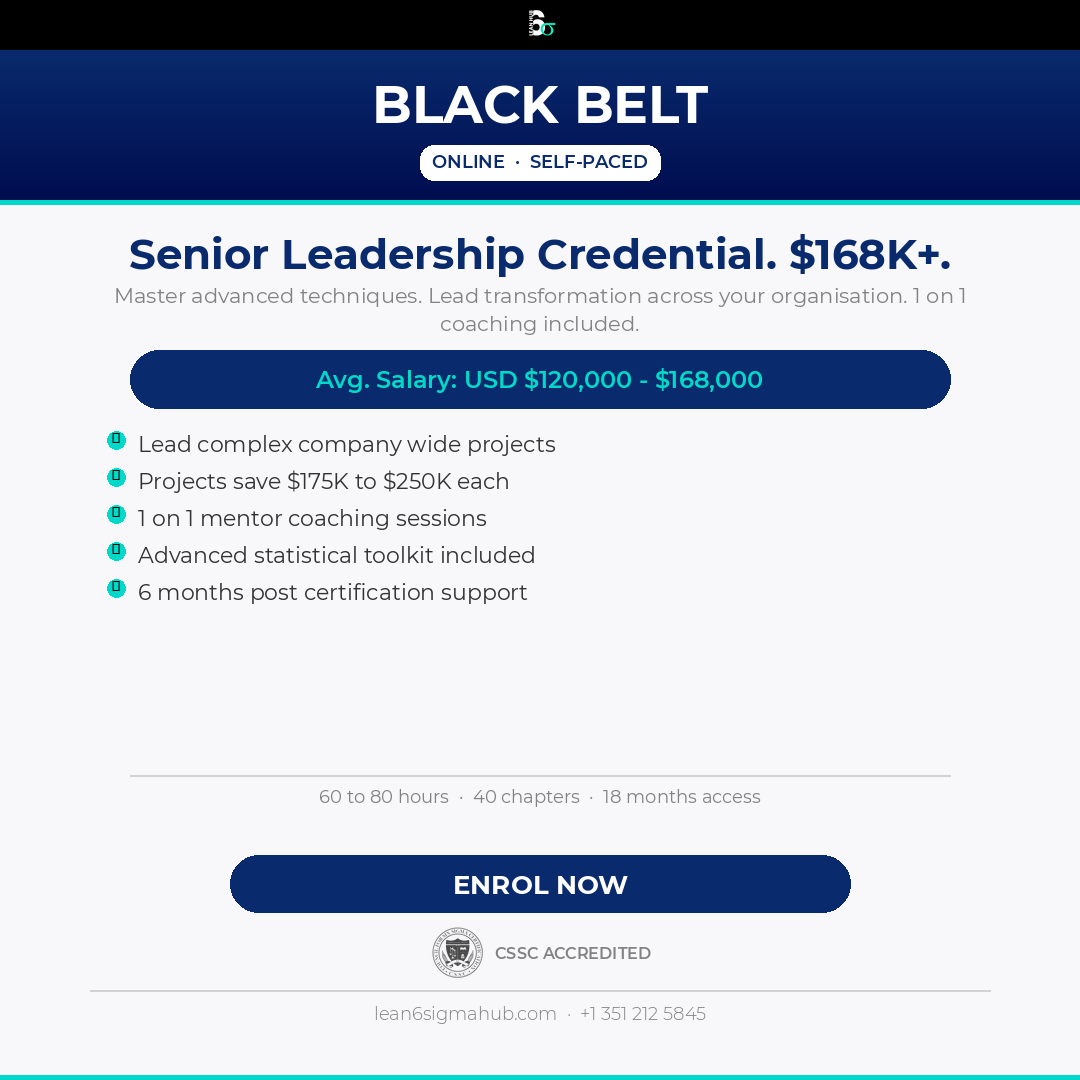
Our Green Belt Certification covers the fundamentals of process mapping and waste identification, providing you with the tools to tackle departmental inefficiencies. However, for those looking to lead entire organizational transformations and master the art of the Value Stream, our Black Belt Certification is the gold standard.
Conclusion: Stop Guessing, Start Mapping
The mess in your organization isn't going to fix itself. It will continue to hide in the shadows, eating your margins and frustrating your best employees. Value Stream Mapping is the flashlight that exposes the waste and the roadmap that leads you out of the chaos.
If you are tired of firefighting and ready to start leading, it’s time to get serious about your Lean Six Sigma journey. Don’t just "see" the mess: master the tools to eliminate it forever.
Enroll in our Lean Six Sigma Certification programs today and take the first step toward operational excellence.


