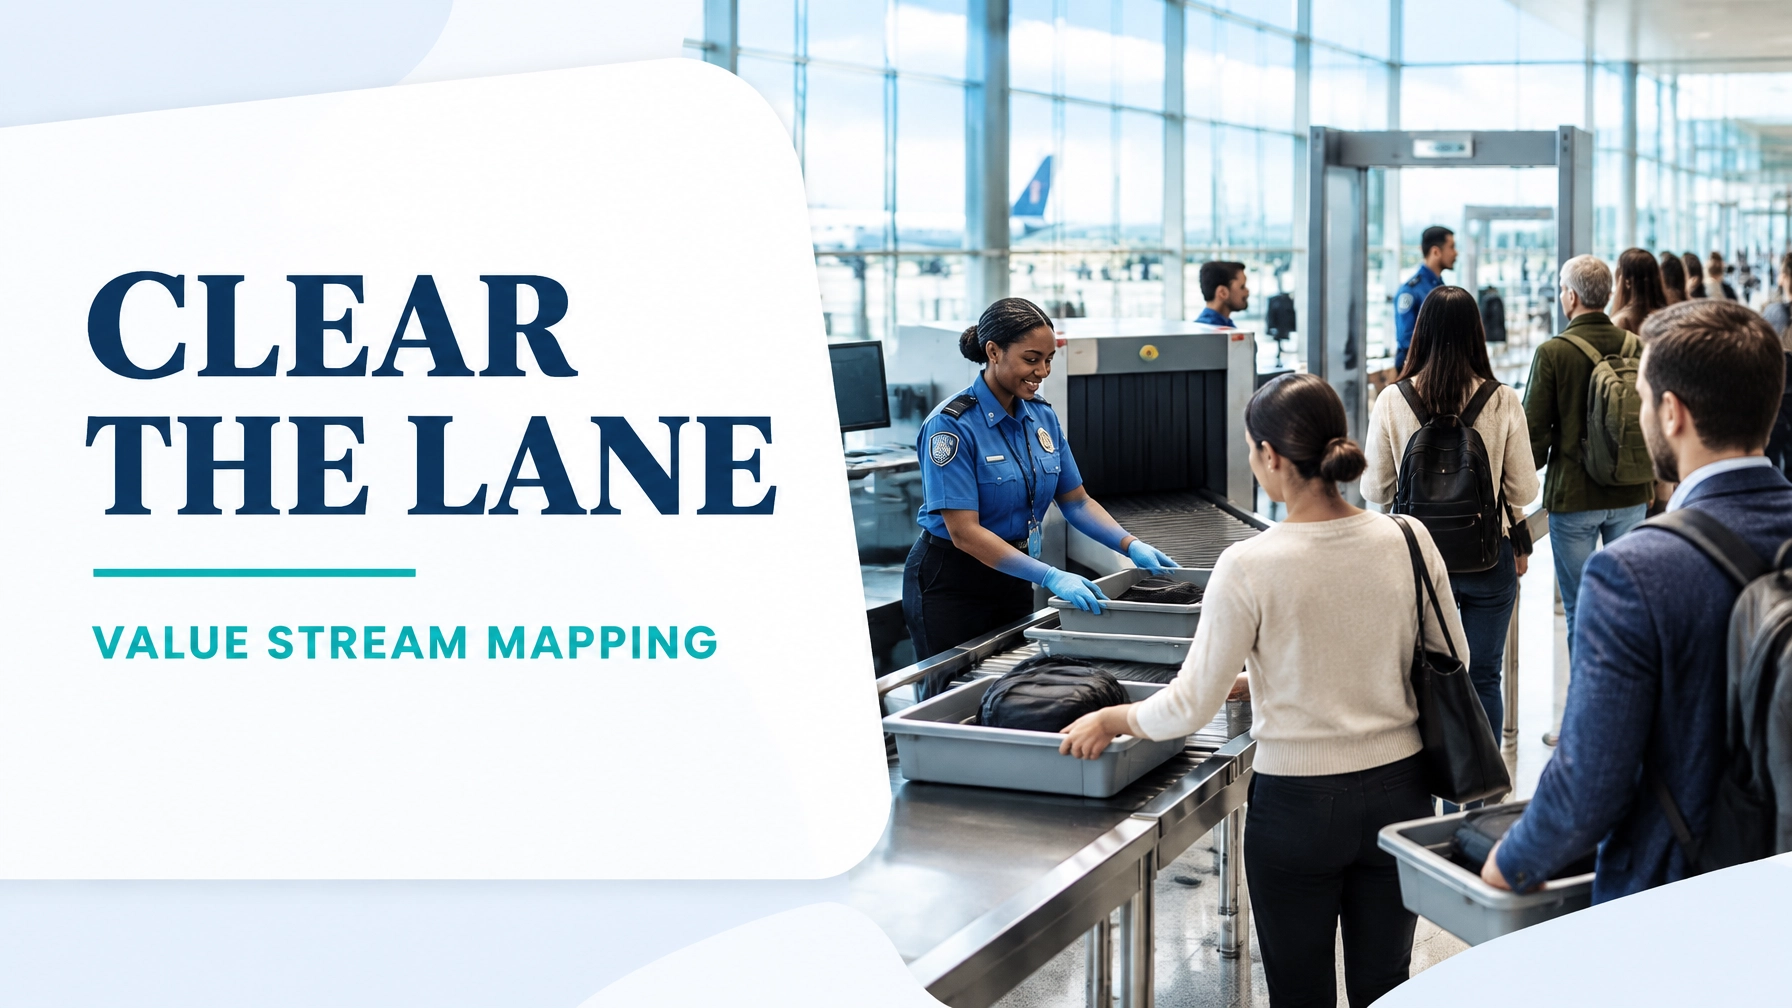
Airport security screening is the airport’s throughput pulse. When passengers move steadily from queue entry to a cleared lane, the terminal feels organised and reliable. When the flow breaks down, the security checkpoint becomes the passenger’s first significant impression of the airport: and wait-time spikes quickly become an operational, reputational and commercial concern.
The disciplined use of value stream mapping makes the entire screening system visible. Rather than optimising only the X-ray machine or adding staff reactively, airport leaders can examine passenger flow, information flow, capacity, quality and waiting as one connected value stream.
This deep guide maps a representative morning peak from queue entry through recomposure, then builds a measurable future state.
Define the Scope: From Queue Entry to Lane Cleared
A useful value stream mapping exercise begins with precise boundaries. For this example, the scope is:
Standard departing passenger security screening during a three-hour morning peak, from joining the queue to collecting belongings and clearing the lane.
The process steps are:
- Queue entry and lane assignment
- ID and boarding pass check
- Divesting clothing, electronics and liquids
- Tray transport to the screening equipment
- X-ray screening
- Body screening
- Resolution and re-check, where required
- Recomposition: collecting belongings and leaving the lane
The map excludes airline check-in, immigration, gate boarding and exceptional security events outside the standard screening process. Those boundaries prevent the team from creating an unmanageable map while preserving the complete flow relevant to passenger wait time.
A value stream mapping framework should show both process flow and information flow. In airport screening, information flow includes:
- Passenger demand forecasts
- Staff rostering and break schedules
- Lane allocation plans
- Terminal and flight-wave information
- Wait-time displays
- Equipment status
- Incident logs
- Resolution and re-check records
- Escalation procedures for lane stoppages
The passenger moves physically through the lane, but decisions about staffing and capacity are often made elsewhere. A complete map connects both systems.

Current-State Mapping: What the Morning Peak Reveals
Assume the airport processes 4,200 passengers during a three-hour morning peak across seven active lanes.
Demand and takt time
The available screening capacity is:
- Seven lanes
- Three hours available
- Available lane minutes: 7 × 180 = 1,260 lane-minutes
- Demand: 4,200 passengers
Therefore:
[
\text{Takt time} = \frac{1,260 \text{ lane-minutes}}{4,200 \text{ passengers}}
]
[
\text{Takt time} = 0.30 \text{ minutes} = 18 \text{ seconds per passenger}
]
The current lane capacity is 210 passengers per hour, equivalent to approximately 17.1 seconds per passenger at the effective bottleneck. Across seven lanes, theoretical capacity is 1,470 passengers per hour, providing only modest headroom above the average demand of 1,400 passengers per hour.
This explains why small disruptions create large queues. The system is close to its operating limit during the most concentrated flight waves.
Current-state cycle-time observations
| Screening step | Average cycle time | Current observation |
|---|---|---|
| ID and boarding pass check | 12 sec | Variation increases when documents are not ready |
| Divesting | 48 sec | Longest hands-on activity; staff utilisation varies between waves |
| Tray transport | 9 sec | Batching occurs when trays arrive faster than the belt is cleared |
| X-ray screening | 17 sec | 12% X-ray reject rate |
| Body screening | 14 sec | Flow depends on passenger preparation and operator availability |
| Resolution/re-check | 75 sec when required | 6.5% of passengers enter re-check |
| Recomposition | 20 sec | Belongings and trays are not always presented in sequence |
The nominal touch time for a standard passenger is approximately 120 seconds, although several steps occur in parallel. The lane’s throughput is therefore governed by effective station capacity, not by simply adding every cycle time together.
Passenger waiting is the larger issue. The average wait is 11.4 minutes, rising to 24 minutes during the peak wave. Staff utilisation also shows gaps: some positions approach full utilisation during flight surges, while other staff experience idle time between waves or during uneven lane allocation.
Make the Eight DOWNTIME Wastes Visible
At lane level, the eight wastes provide a practical diagnostic structure.
- Defects: Incorrect tray contents, unreadable documents, missed preparation instructions and avoidable X-ray rejects.
- Overproduction: Opening or staffing lanes ahead of demand without a reliable wave forecast.
- Waiting: Passengers waiting before ID checks, trays waiting for transport, or staff waiting for resolution decisions.
- Non-utilised talent: Experienced screeners spending time on manual coordination rather than coaching, balancing or problem-solving.
- Transportation: Trays travelling unnecessary distances or being redirected because the receiving point is unavailable.
- Inventory: Work in process appears as passengers in queues, trays awaiting screening and belongings waiting for recomposure.
- Motion: Passengers repeatedly repositioning bags, staff walking to fetch trays or operators reaching around poorly arranged equipment.
- Extra-processing: Repeating document checks, duplicating information in incident logs or sending passengers through secondary screening without a clearly defined decision rule.
The most important observation is that secondary screening is not merely a quality activity; it is also a flow loop. At a 12% X-ray reject rate, approximately 504 of the 4,200 passengers or associated tray events may require additional attention. A separate 6.5% re-check rate represents approximately 273 passenger movements through the resolution lane. These volumes consume capacity and amplify waiting when resolution staffing is not synchronised with demand.
Design the Future State
The future-state map should not assume that every passenger follows the same path. It should create a stable standard flow for the majority while managing exceptions visibly and quickly.
The future state combines five interventions.
1. Flexible lane balancing
Use live queue length, demand forecasts and lane status to redistribute passengers before one lane becomes overloaded. Lane allocation should be reviewed at defined intervals and whenever a flight wave changes materially.
2. Standard work for divesting
A visual standard should show the expected sequence for electronics, liquids, outer garments and personal items. The objective is not to rush passengers; it is to reduce hesitation, searching and repeated handling.
With divest time currently at 48 seconds, a future-state target of 38 seconds is reasonable if supported by preparation cues, consistent tray presentation and trained staff assistance.
3. Batch-free tray flow
Trays should move continuously rather than accumulate in batches. A simple first-in, first-out rule, defined belt spacing and clear ownership between divesting and X-ray staff can reduce transport waiting and motion.
4. Kanban for staff rostering
A staffing kanban can link scheduled flight waves to the number of open lanes, divest positions and resolution staff required. Instead of treating the roster as fixed, the airport can trigger staffing adjustments from demand signals.
5. Visual Andon for stoppages
A visual Andon signal should identify lane stoppages, equipment constraints, tray accumulation or resolution overload in real time. The signal must have a response standard: who intervenes, within what time and how the event is recorded.
Demand levelling across waves is essential. The goal is not to eliminate peaks that are structurally created by flight schedules. It is to prevent avoidable concentration caused by delayed lane opening, uneven staffing or poor information flow.

Current Versus Future State
The following targets illustrate how the future state can improve flow without compromising screening requirements.
| Metric | Current state | Future-state target |
|---|---|---|
| Average lead time, queue entry to cleared lane | 13.4 min | 6.0 min |
| Average process time | 120 sec | 102 sec |
| Process time as % of lead time | 14.9% | 28.3% |
| Throughput per lane | 210 pax/hour | 245 pax/hour |
| Wait time P95 | 29 min | 11 min |
| X-ray reject rate | 12.0% | 8.5% |
| Resolution/re-check rate | 6.5% | 4.0% |
| Average wait time | 11.4 min | 4.2 min |
| Peak wait time | 24 min | 9 min |
The percentage value-added figure is used here as an operational proxy: process time divided by total lead time. Security screening is a necessary service rather than a conventional customer value-added manufacturing step, so the more meaningful objective is to increase the proportion of time spent on purposeful screening while reducing avoidable waiting and rework.
A future capacity of 245 passengers per lane per hour would provide approximately 1,715 passengers per hour across seven lanes. Against peak demand of 1,400 passengers per hour, that creates a more resilient operating buffer.
Kaizen Sequencing: Turn the Map into Action
A future-state map becomes useful only when it is linked to ownership, timing and measurable outcomes.
-
Confirm the baseline : Airport Operations Manager : 0–2 weeks
Validate passenger counts, cycle times, lane availability, wait-time percentiles, X-ray rejects and re-check data across several morning peaks. -
Stabilise divesting : Screening Operations Lead : 2–4 weeks
Create standard work, visual preparation prompts and a consistent tray-loading sequence. Target a reduction from 48 seconds to 42 seconds before pursuing further gains. -
Remove tray batching : Lane Supervisors : 2–6 weeks
Establish FIFO tray flow, define belt spacing and audit accumulation every 15 minutes. -
Pilot flexible lane balancing : Terminal Duty Manager : 4–8 weeks
Use queue thresholds and flight-wave triggers to open, close or redirect lanes. Compare average wait and P95 wait by wave. -
Introduce staffing kanban : Workforce Planning Manager : 6–10 weeks
Connect demand signals to divest, screening and resolution coverage. Measure utilisation gaps between waves. -
Install Andon response standards : Engineering and Screening Leads : 8–12 weeks
Define visual signals for equipment stoppage, queue overload and resolution congestion. Track response time and repeat events. -
Control the gains : Continuous Improvement Lead : ongoing
Use X-bar charts for average wait time, lane throughput and reject rate. Review the metrics daily and conduct a formal future-state review after 30, 60 and 90 days.

Final Perspective
Airport security is a tightly connected service value stream. A faster X-ray operator cannot compensate for unstable divesting, poor lane allocation or a resolution queue that lacks capacity. Value stream mapping gives airport leaders a shared view of the complete system: from the first queue decision to the moment the passenger clears the lane.
For professionals leading complex flow, quality and capacity projects, these improvements require more than isolated tools. They require structured problem definition, statistical analysis, stakeholder alignment, future-state design and control planning.
Build the expertise to lead airport-scale improvement projects with Lean Six Sigma Black Belt Online Training. Learn advanced process mapping, root-cause analysis, hypothesis testing, capability analysis, SPC and practical project leadership through flexible, self-paced online training accredited by CSSC.
Kaizen. Kai-Care. Kai-Done. ( Lean Six Sigma)