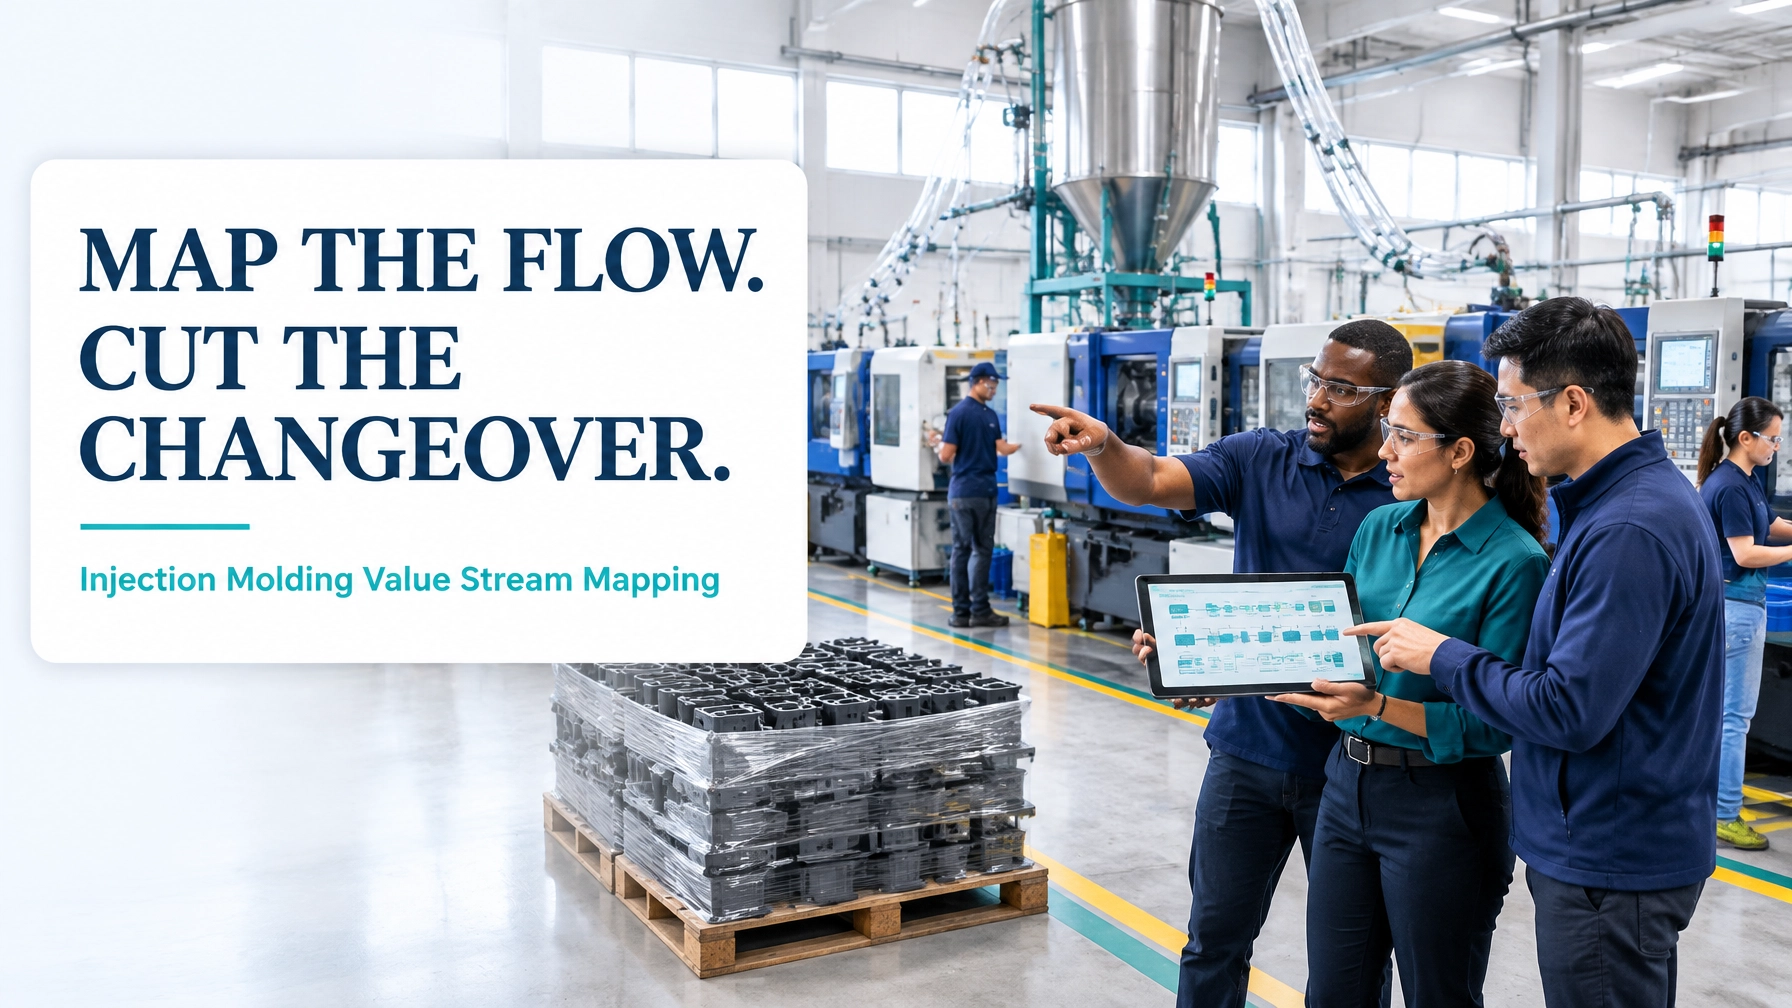
In plastics injection molding, profitability is shaped by two forces: how much productive time each press delivers and how quickly the operation can move from one SKU to the next. A press that produces excellent parts but spends 96 minutes waiting for a mold, temperature, tooling, or first-off approval is not creating its full economic value.
Value Stream Mapping (VSM) makes this performance gap visible. It connects material flow, information flow, changeover activity, quality losses, work in process (WIP), and finished-goods demand on one page. The result is not simply a process diagram. It is a fact-based view of where customer value is created, where capacity is consumed, and where a focused kaizen sequence can improve throughput.
This guide develops a worked example for a high-volume injection molding product family and shows how SMED, standard work, visual management, and pull-based flow can remove changeover drag.
1. Select the right value stream and scope the map
The fundamental purpose of VSM is to follow a product family from the first meaningful material transaction to the customer-ready output. For this example, the selected family contains six molded-part SKUs that run across an 18-press department.
The scope begins at the resin silo and ends at a packaged pallet ready for dispatch:
Resin draw → drying and blending → material conveying → injection molding → trimming/decorating → inspection → packing → palletisation
The map excludes mold building, mold repair, and upstream tooling manufacture. Those activities may warrant separate improvement projects, but including them here would blur the operational question: How can this product family flow through the molding department with less waiting and shorter changeovers?
The team should include production, process engineering, maintenance, quality, planning, warehouse, and logistics. Capture both:
- Material flow: resin, molded parts, WIP, decorated parts, cartons, and pallets.
- Information flow: customer demand, production schedules, mold availability, resin calls, quality approvals, and dispatch signals.
This scope also supports the principles described in Lean Six Sigma’s process bottleneck analysis guide.
2. Current-state map: where the hours disappear
The current-state data for the six-SKU family is:
- 18 injection molding presses
- Average batch size: 12,000 parts
- Average changeover: 96 minutes
- Changeovers: 14 per week
- Overall Equipment Effectiveness (OEE): 61%
- Scrap: 4.8%
- Current estimated WIP: 5.2 days across molding, decorating, and packing
At 14 changeovers per week, the department consumes:
14 × 96 minutes = 1,344 minutes, or 22.4 press-hours per week
The current-state flow can be represented as follows:
Resin silo
↓ material call and dryer availability
Drying/blending : waiting occurs when the next resin or colour is not staged
↓ pneumatic conveying
Injection molding : 96-minute mold and process changeover; OEE 61%; startup scrap
↓ pallet or tote transfer
Decorating/secondary operation : excess WIP accumulates to protect downstream capacity
↓ inspection queue
Inspection and first-off approval : waiting for quality resources or complete records
↓
Packing and palletisation : finished parts held until the scheduled dispatch window
The map should include process data boxes for cycle time, uptime, batch quantity, staffing, changeover time, scrap, and WIP. It should also show the customer demand signal and the production planning rule that releases work to the presses.
A large batch may appear efficient because it reduces the number of setups. However, it also increases finished WIP, delays mix changes, and encourages production ahead of actual demand. The correct batch size must therefore balance takt time, throughput, changeover capability, and customer service requirements.
3. Identify the eight wastes in the molding stream
A practical VSM review uses the DOWNTIME framework to connect observations to improvement actions.
- Defects: Startup parts are rejected because temperature, pressure, colour, or mold conditions are not yet stable. At 4.8% scrap, every 100,000 parts produces approximately 4,800 nonconforming units.
- Overproduction: Runs of 12,000 parts create inventory before the next customer requirement is due.
- Waiting: Operators wait for mold pre-heat, resin verification, first-off approval, maintenance support, or a released production order.
- Non-utilised talent: Process technicians spend time locating tools and completing repetitive searches instead of improving recipes and capability.
- Transportation: Totes travel from the press to decorating and back to inspection staging, increasing handling and traceability risk.
- Inventory: Excess WIP accumulates between molding and decorating because the processes are not synchronized.
- Motion: Operators hunt for clamps, hoses, thermocouples, gauges, and approved parameter sheets.
- Extra processing: Manual sorting, repeated measurements, rechecking, and rework compensate for unstable startup conditions.

The critical insight is that these wastes are connected. Long changeovers encourage larger batches. Larger batches create more WIP. More WIP hides process instability. Hidden instability increases waiting and makes the schedule less responsive.
4. Future state: use SMED to release press capacity
The future-state design begins with Single-Minute Exchange of Die (SMED). The aim is not merely to work faster; it is to redesign the changeover so that preparation occurs while the current SKU is still running.
A video study of the 96-minute changeover should classify each task as internal, external, or parallelisable. In this example, the team identifies 71 minutes of work that can be externalised, simplified, or performed in parallel, leaving a 25-minute internal changeover target.
The future-state method includes:
- Preheat the next mold externally in a controlled staging area.
- Use a dedicated die cart with the mold, clamps, hoses, connectors, tools, recipe sheet, and quality checklist.
- Stage resin, masterbatch, labels, packaging materials, and inspection gauges before the stop signal.
- Install water and heat quick-connects with colour coding and standard locations.
- Use a verified digital or printed recipe so machine, robot, and decorating parameters are prepared in advance.
- Run a pitch-and-catch changeover, with one operator completing utility and tooling tasks while another handles recipe loading, material verification, and first-off preparation.
- Define the first-off approval standard so quality confirms the part using a short, visible checklist.
- Store all changeover tools at point of use using 5S and shadow boards.

The future-state map should also replace large push batches with a controlled supermarket or FIFO lane between molding and decorating. WIP limits make abnormal accumulation visible. A pull signal can then release the next molding order according to customer demand and downstream capacity.
The operating logic becomes:
Demand signal → leveled schedule → resin and mold staged → 25-minute changeover → stable first-off approval → controlled WIP → decorating and inspection → packaged pallet
5. Current versus future performance
The following targets are modeled for the first 90-day improvement cycle. They should be validated against actual demand, cycle time, staffing, and available press hours.
| Metric | Current state | Future-state target | Improvement mechanism |
|---|---|---|---|
| Average changeover | 96 minutes | 25 minutes | SMED, die cart, quick-connects, parallel work |
| OEE | 61% | 74% | Higher availability, stable startup, reduced adjustment |
| Scrap | 4.8% | 2.2% | Standard recipes, preheated molds, first-off control |
| Average batch size | 12,000 parts | 8,000 parts | Shorter and more predictable changeovers |
| WIP across stream | 5.2 days | 2.6 days | FIFO limits, pull signals, smaller batches |
| Weekly changeover hours recovered | 0 | 16.6 hours | 14 × 71 minutes saved |
| Annual capacity gain | 0 | 861 press-hours | 16.6 hours × 52 weeks |
At an assumed average cycle of 30 seconds per part, 861 recovered press-hours represent approximately 103,320 gross part opportunities per year. At the future-state yield of 97.8%, that is approximately 101,000 additional good parts annually, subject to demand and downstream capacity.
The goal is not to maximise output regardless of customer need. The goal is to convert recovered time into useful throughput, shorter lead time, better mix flexibility, or planned maintenance capacity.
6. A 90-day kaizen sequence
Days 1–15: Define and measure
- Confirm the six-SKU family and customer demand profile.
- Walk the stream from resin silo to packaged pallet.
- Record cycle time, WIP, scrap by defect type, changeover elements, and approval delays.
- Validate the 22.4 weekly changeover hours.
- Establish a baseline dashboard for OEE, changeover, scrap, WIP, and schedule adherence.
Days 16–30: Observe and redesign
- Film three representative changeovers.
- Separate internal and external tasks.
- Create the die-cart checklist and staging standard.
- Mark locations for molds, hoses, tools, resin, and inspection equipment.
- Define the first-off approval rule and escalation path.
Days 31–60: Pilot SMED on one press
- Run preheated molds and staged materials.
- Install quick-connects and standardised clamps where appropriate.
- Conduct pitch-and-catch changeovers with trained operators.
- Measure every changeover for safety, time, startup scrap, and first-good-part timing.
- Adjust the standard work based on observed variation.
Days 61–75: Build the future-state flow
- Set WIP limits between molding, decorating, inspection, and packing.
- Introduce FIFO or supermarket controls.
- Reduce the pilot batch size from 12,000 toward 8,000 parts after capacity validation.
- Align production scheduling with customer demand and takt time.
Days 76–90: Control and scale
- Audit the 25-minute standard weekly.
- Replicate the method across the remaining presses in waves.
- Review OEE and scrap by SKU, mold, shift, and operator team.
- Publish the future-state VSM and assign control-plan owners.
- Calculate the financial impact using a documented business case.

Turn the map into measurable capability
A value stream map becomes powerful when it changes decisions on the factory floor. In this example, the biggest opportunity is not simply reducing one setup. It is creating a connected system in which shorter changeovers enable smaller batches, smaller batches reduce WIP, lower WIP exposes waiting, and stable startup improves yield and OEE.
For process engineers, a CSSC-accredited Green Belt develops the statistical, project, and process-improvement skills needed to lead this type of initiative. For plant managers, a Black Belt provides the advanced capability to prioritise constraints, quantify financial impact, coach Green Belts, and sustain cross-functional change.
Build the capability to map, improve, and control your production system: enrol in Lean Six Sigma Green Belt or Black Belt training today.
Kaizen. Kai-Care. Kai-Done. ( Lean Six Sigma)