In the realm of IT service management, employee productivity is shaped by more than system uptime. Every unresolved password issue, access request, and repeated ticket handoff keeps people away from their primary work and increases the cost of IT support.
Value Stream Mapping (VSM) makes this flow visible. It shows how information, decisions, work, and waiting move from ticket creation to resolution. More importantly, it separates customer value from process activity that merely consumes time.
This guide uses a worked service desk example to demonstrate how a focused VSM can increase First-Call Resolution (FCR), reduce escalation ping-pong, and recover substantial analyst capacity.
1. Select a Focused Service Desk Scope
A useful service desk map should follow one family of demand rather than attempting to capture every IT process.
For this example, the scope is:
- Start: Employee creates a Tier 1 ticket.
- Categories: Password resets and access requests.
- End: Ticket is resolved and confirmed, or escalated cleanly to the correct Tier 2 team.
- Excluded: Major incidents, infrastructure outages, project work, and software development requests.
A clean escalation is not a failure. It is a controlled transfer containing the correct category, business impact, identity verification, device or application details, troubleshooting already completed, and required approvals.
The objective is to prevent incomplete tickets from moving repeatedly between Tier 1 and Tier 2.
The Voice of the Customer (VOC) can be translated into measurable Critical-to-Quality requirements such as:
- Resolution during the first contact.
- No repeated explanation of the same issue.
- Clear status communication.
- Correct access delivered securely.
- Minimal employee downtime.
The Voice of the Process then confirms whether the current workflow can meet those requirements consistently.
2. Current-State VSM: Where the Ticket Loses Time
Assume this Tier 1 desk receives 4,800 tickets per month with the following baseline:
- First-Call Resolution: 52%
- Average handle time: 14 minutes per interaction
- Average time to resolve: 26 hours
- Escalation rate: 38%
- Touches per ticket: 3.2
The current-state flow looks like this:
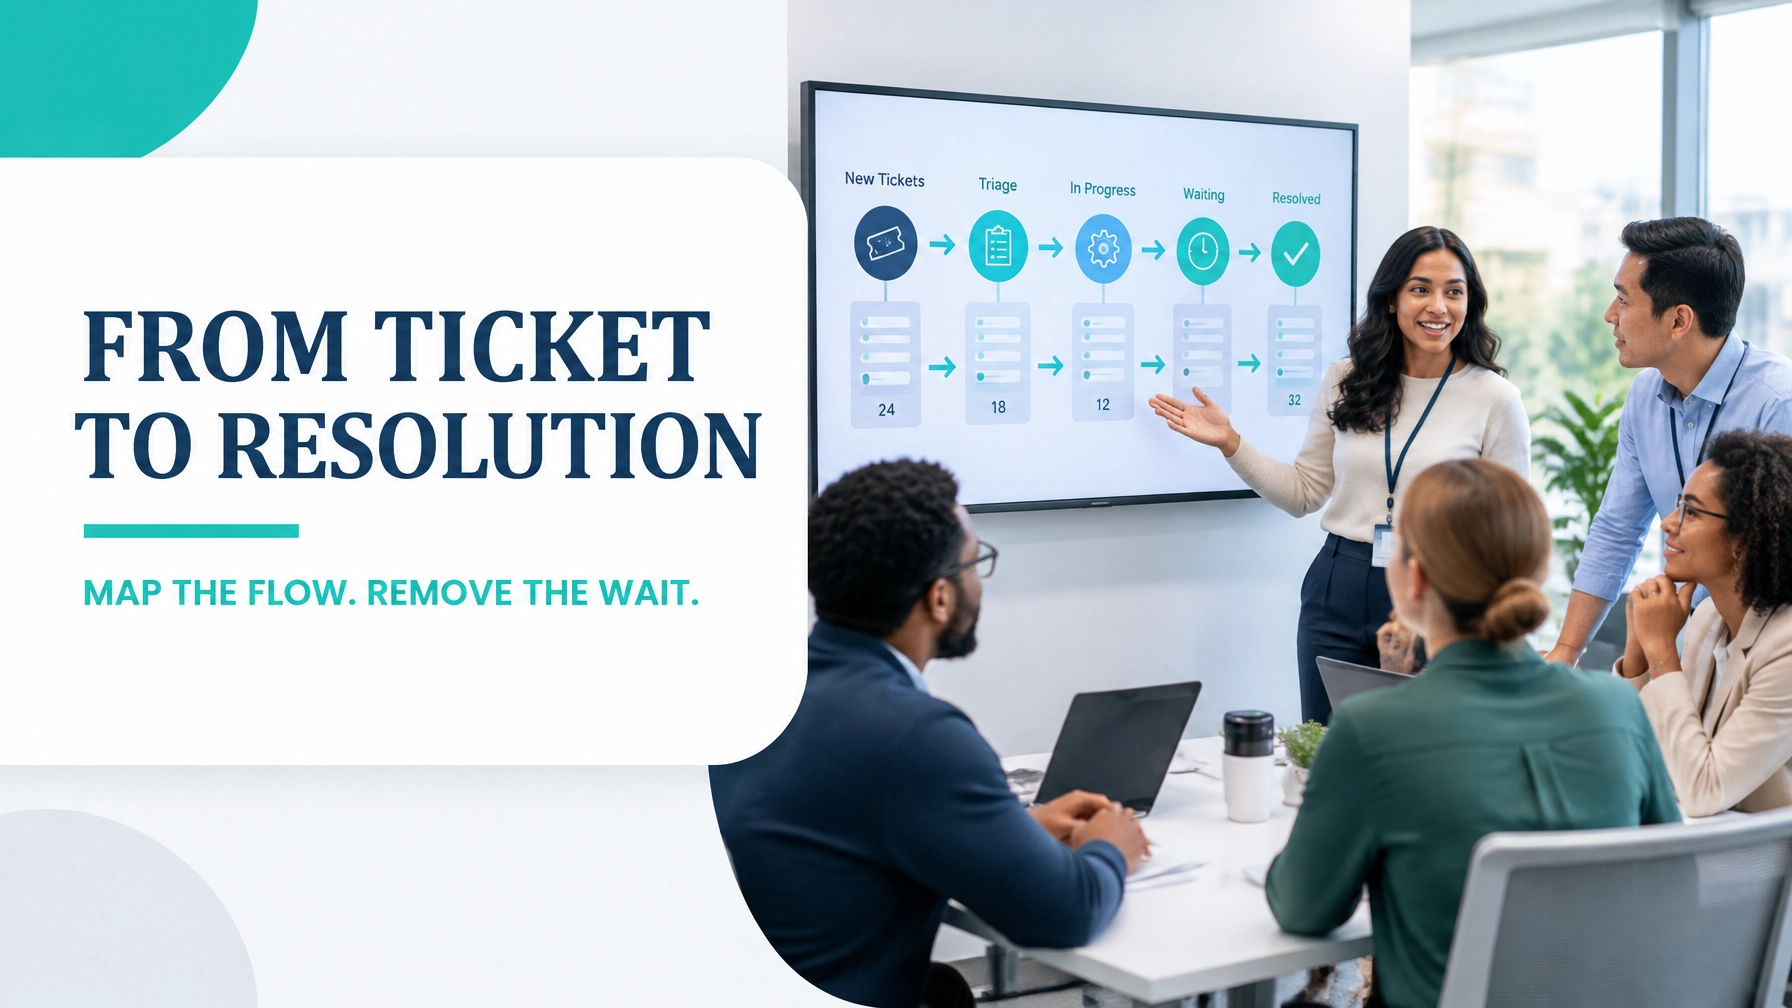
Ticket created → Manual intake review → Category and priority assigned → Tier 1 troubleshooting → Approval or verification → Tier 2 escalation, if required → Resolution → User confirmation → Closure
The numbers immediately indicate a flow problem. At 3.2 touches per ticket, the desk completes approximately 15,360 interactions per month:
4,800 tickets × 3.2 touches = 15,360 touches
At 14 minutes per interaction, this represents:
15,360 × 14 ÷ 60 = 3,584 analyst hours per month
That is the equivalent of 22.4 full-time employees at 160 productive hours per month, before accounting for meetings, coaching, absence, and administrative work.

Current-State Waste Analysis
The eight DOWNTIME wastes appear in service work as clearly as they do in manufacturing:
| Waste | Service desk example |
|---|---|
| Defects | Incomplete intake, incorrect categorisation, failed identity verification |
| Overproduction | Duplicate tickets created because the first request appears unanswered |
| Waiting | Tickets waiting in the Tier 2 queue or for approval |
| Non-utilised talent | Analysts repeatedly searching for information instead of improving knowledge articles |
| Transportation | Tickets transferred across queues without additional diagnosis |
| Inventory | Excess work in process (WIP) represented by open tickets |
| Motion | Analysts switching between identity, ticketing, application, and approval systems |
| Extra-processing | Duplicate verification, repeated questions, and manual status updates |
The most important bottleneck is often not the Tier 1 analyst. It may be the L2 queue, where escalated tickets accumulate because routing is broad, approval rules are unclear, or the receiving team lacks the information needed to begin work.
If 38% of 4,800 tickets are escalated, approximately 1,824 tickets per month enter the L2 path:
4,800 × 38% = 1,824 escalations
A small defect at intake therefore becomes a large downstream workload.
Use a Process Cycle Efficiency Calculator to separate active resolution work from queueing, rework, approval delays, and other non-value-added time. In service processes, the customer may receive only a few minutes of direct problem solving after waiting many hours for the next action.
3. Analyse the Root Causes, Not Just the Queue
During the Analyse phase of DMAIC, the team should stratify the data rather than rely on an overall average.
Useful cuts include:
- Password reset versus access request.
- Application or platform.
- Analyst and shift.
- Time of day and day of week.
- Escalation reason.
- Reopen rate.
- Approval requirement.
- Tickets missing required intake fields.
For example, suppose the monthly data shows:
- Password resets represent 2,400 tickets, with 72% technically eligible for self-service.
- Access requests represent 2,400 tickets, with 44% requiring an approval.
- 31% of escalated tickets lack application, manager, or entitlement details.
- 22% of Tier 1 touches involve repeated identity verification.
- The L2 queue averages 15 hours of waiting before investigation begins.
These findings point toward controllable inputs in the relationship Y = f(x). The outcome, such as time to resolve or FCR, is influenced by inputs including form quality, knowledge availability, routing accuracy, verification design, and approval timing.
A box plot of time-to-resolve by category could reveal a long tail of access requests. A Pareto chart of escalation reasons could show that “missing application details” and “approval unclear” account for 58% of transfers. Attribute data such as complete/incomplete, correct/incorrect, and resolved/not resolved can support defect analysis and yield calculations.
4. Build the Future State Around Flow
The future-state design should remove avoidable work before adding capacity.
Self-Service Password Reset
Route eligible password issues to a secure self-service reset journey with:
- Multi-factor identity verification.
- Clear eligibility rules.
- Automatic confirmation.
- A fallback path to Tier 1 when the reset fails.
If 1,728 of the 2,400 password tickets are eligible and 70% successfully complete self-service, the desk can avoid approximately:
1,728 × 70% = 1,210 assisted tickets per month
Knowledge-Centered Intake
Replace a generic “contact IT” form with guided questions that change according to the selected category. Require the information Tier 2 needs before submission:
- Application or system name.
- Employee role and location.
- Business reason.
- Manager or data-owner approval.
- Error message or screenshot.
- Access level requested.
Skill-Based Routing
Use category, application, urgency, and entitlement type to route work to the correct queue. A skill-based routing rule should direct a finance application request to an analyst or group with the relevant access knowledge, rather than to a general queue.
Right-First-Time Triage
Create a short triage standard:
- Confirm identity once using the approved method.
- Confirm category and impact.
- Search the relevant knowledge article.
- Attempt the standard fix.
- Record the action and result.
- Escalate only with a complete handoff package.
Approvals should remain formal governance checkpoints where risk requires them. However, redundant approval requests create bottlenecks. Define which access types require approval, who can approve them, and what happens when approval is not received within the target time.

5. Current Versus Future Performance
The following targets are a practical 90-day improvement case, not a universal benchmark.
| Metric | Current state | Future-state target | Expected effect |
|---|---|---|---|
| First-Call Resolution | 52% | 72% | More issues solved without transfer |
| Escalation rate | 38% | 20% | Fewer L2 handoffs |
| Touches per ticket | 3.2 | 1.8 | Less repetition and rework |
| Average time to resolve | 26 hours | 8 hours | Faster employee recovery |
| Cost per ticket* | $22.40 | $12.60 | Lower direct labour demand |
| Monthly FTE hours recovered* | : | 1,568 hours | Capacity returned to the service desk |
*Illustrative model using 14 minutes per interaction and a loaded labour rate of $30 per hour. Current direct interaction effort is 3,584 hours per month. Future effort at 1.8 touches per ticket is 2,016 hours, producing a modeled recovery of 1,568 hours per month, or approximately 9.8 FTE equivalents.
Track yield as well as speed. First-Pass Yield can measure tickets resolved without rework, escalation, or reopening. Rolled Throughput Yield can measure the probability that a ticket passes through intake, triage, approval, resolution, and closure without a defect at any stage.
6. Sequence the Kaizen Work Over 90 Days

A disciplined sequence prevents the team from launching disconnected improvements.
Days 0–30: Stabilise and Measure
- Validate definitions for FCR, escalation, touch, reopen, and resolution.
- Build the current-state VSM.
- Create a Pareto of escalation reasons.
- Establish a daily WIP and ageing-ticket review.
- Standardise the minimum escalation package.
- Publish the first five high-volume knowledge articles.
Days 31–60: Improve the Highest-Volume Paths
- Pilot self-service password reset.
- Redesign access-request intake forms.
- Introduce skill-based routing for the top three applications.
- Remove duplicate verification steps where risk controls permit.
- Create an approval matrix and escalation service-level trigger.
- Run a two-week pilot and compare FCR, touches, and time to resolve.
Days 61–90: Control and Scale
- Expand successful routing and self-service rules.
- Add control charts for FCR, escalation rate, ageing WIP, and reopen rate.
- Review the future-state map with Tier 1, Tier 2, security, HR, and application owners.
- Audit a sample of 50 escalations each week for completeness.
- Assign process ownership and define monthly governance reviews.
The Theory of Constraints principle is decisive: improve the constraint first. If L2 capacity is the limiting factor, sending more poorly prepared tickets downstream will reduce overall throughput. Protect the constraint with better intake, complete handoffs, and demand reduction through self-service.
Turn Service Desk Improvement Into a Professional Capability
Value Stream Mapping gives service desk leaders a practical way to connect employee experience, IT cost, quality, and capacity. It also creates a common language for analysts, application owners, security teams, and executives.
For service desk leads, Lean Six Sigma Yellow Belt or Green Belt training develops the ability to map workflows, analyse root causes, measure variation, and lead focused improvements. For IT operations managers responsible for cross-functional constraints, governance, and strategic transformation, Black Belt training provides deeper statistical and project leadership capability.
Lean 6 Sigma Hub offers CSSC-accredited, self-paced online training with practical case studies, data, charts, simulations, and worked examples. Explore the Lean Six Sigma Green Belt Online Training or Lean Six Sigma Black Belt Online Training to build the capability to improve service flow with evidence.
Map your service desk, quantify the waste, and pursue Lean Six Sigma certification to lead measurable improvement.
Kaizen. Kai-Care. Kai-Done. ( Lean Six Sigma)