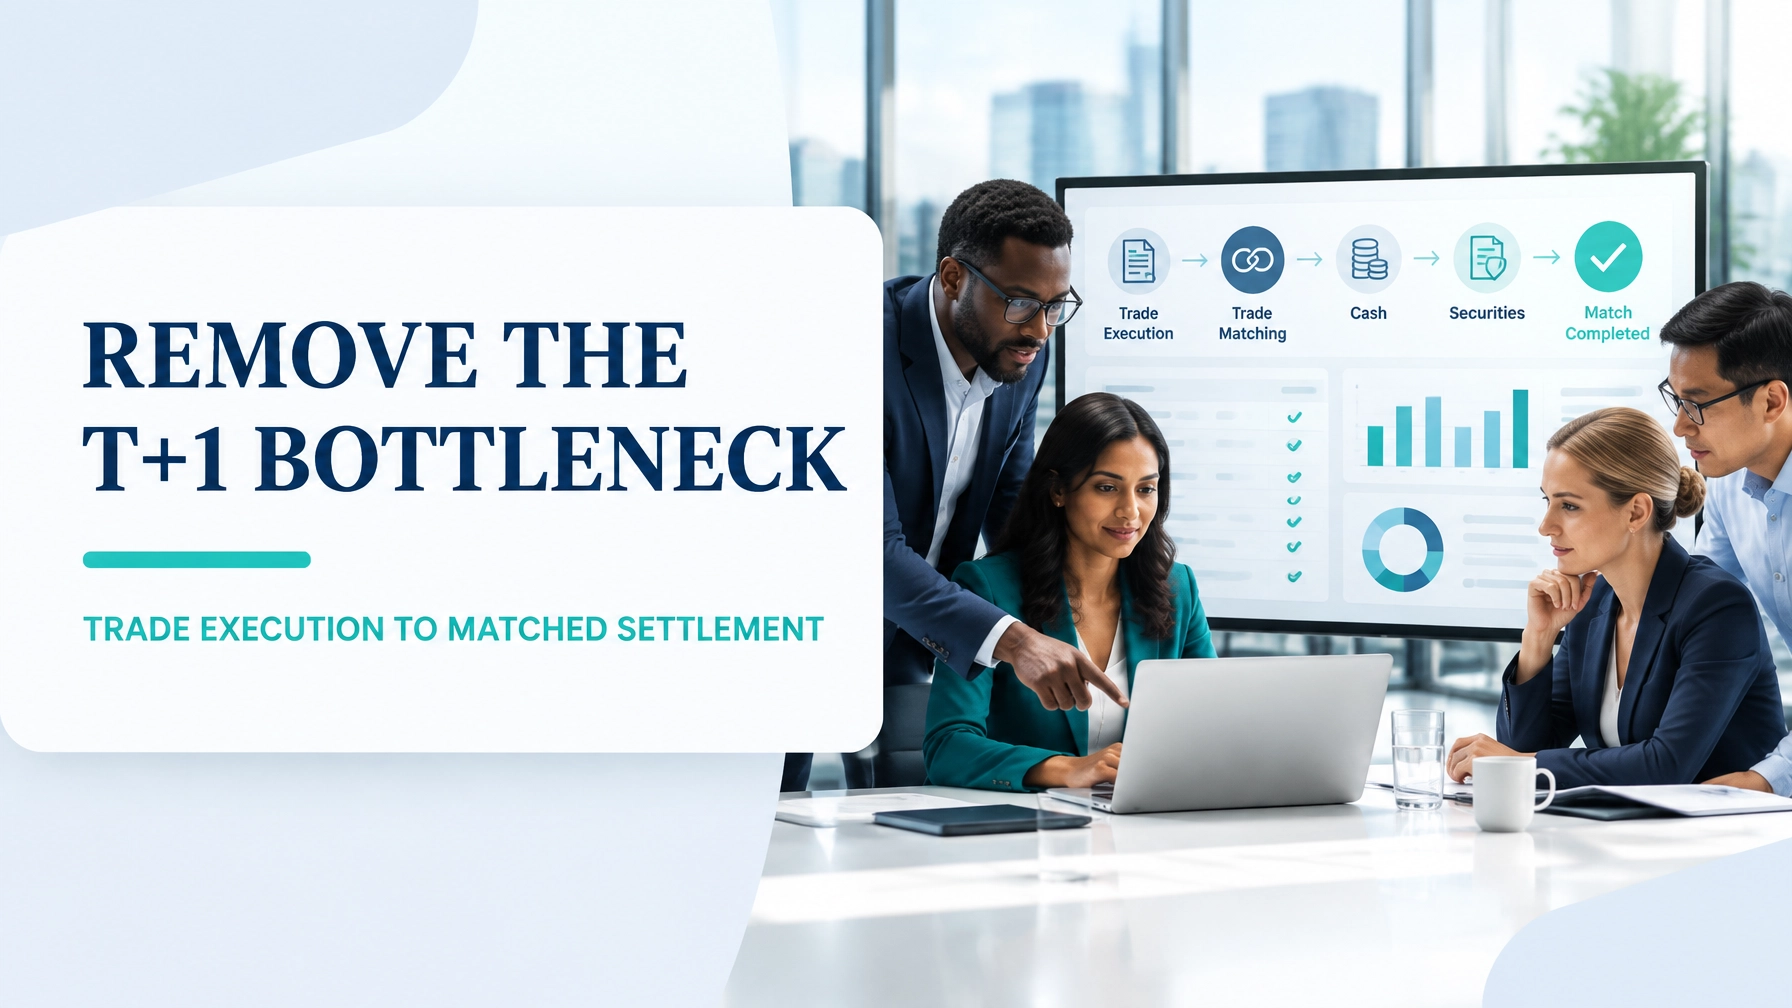
In institutional investment operations, settlement speed is no longer simply an efficiency objective. Under T+1, the time available to allocate, affirm, instruct, fund, deliver securities and resolve exceptions has been compressed into a much narrower operating window.
The U.S. standard settlement cycle moved to T+1 on 28 May 2024, while industry practice treats 9:00 p.m. Eastern Time on trade date as the critical operational cut-off for affirmation and overnight processing. The SEC’s T+1 release and DTCC’s trade affirmation guidance both reinforce the importance of completing post-trade activities as soon as technologically practicable.
A settlement process can therefore appear busy while still creating limited customer value. Queues of unaffirmed trades, repeated reconciliation, manual rekeying and late exception escalation consume capacity without moving cash and securities closer to a matched settlement.
This is precisely where Value Stream Mapping (VSM) provides clarity. By mapping material and information flow from execution to settlement, operations leaders can distinguish value-adding controls from waiting, rework and avoidable handoffs.
Illustrative case study: The figures in this article are a worked example for a hypothetical institutional equity operation. They should be replaced with validated internal data before being used as a formal business case.
Scope the Value Stream Before Measuring It
The selected process begins when an institutional equity trade is executed and ends when cash and securities are matched, settled and reconciled.
Included in scope
- Trade execution and capture
- Allocation to funds, portfolios or client accounts
- Trade matching and confirmation
- Standing Settlement Instruction (SSI) enrichment
- Same-day affirmation
- Custodian and settlement instruction processing
- T+1 cash-and-securities settlement
- Reconciliation, fail management and exception closure
Excluded from scope
- Client onboarding and account opening
- Investment decision-making
- Order strategy and pre-trade compliance
- Post-settlement performance reporting
This boundary prevents the project from becoming too broad. It also creates a clear Voice of the Customer (VOC): accurate settlement, predictable timing and minimal operational disruption. The Voice of the Business (VOB) adds reduced fail charges, lower capital exposure and reliable regulatory governance.
Current-State Map: Where T+1 Capacity Is Lost
The hypothetical operation processes 2,400 institutional equity trades per day. Its current performance is:
- 78% same-day affirmation
- 95% same-day affirmation target
- 6.2 hours average execution-to-affirmation time
- 4.1% settlement fail rate
- 2.7 manual repair touches per failed or materially mismatched trade
- Approximately 22 business days per month
The current-state flow is:
Execution
   ↓
Trade Capture
   ↓
Allocation ── waiting for account details or SSI
   ↓
Matching ── manual rekeying and data mismatch
   ↓
Affirmation ── counterparty and approval queue
   ↓
Settlement Instruction ── exception report review
   ↓
T+1 Settlement ── inventory or funding issue
   ↓
Reconciliation and Fail Repair
At 2,400 trades per day, 22% of trades: 528 trades: are not affirmed the same day. The operation also experiences approximately 98.4 failed trades per day, calculated as:
2,400 × 4.1% = 98.4 fails per day
The 6.2-hour execution-to-affirmation time is not necessarily six hours of processing. Much of it is waiting: waiting for allocation data, waiting for a counterparty response, waiting for an approval, or waiting for an analyst to review an exception queue.

The Eight DOWNTIME Wastes in Trade Settlement
The Lean DOWNTIME framework identifies eight forms of waste. In post-trade operations, these wastes often appear as information delays rather than physical movement.
- Defects: Incorrect quantities, prices, account identifiers or settlement instructions create mismatches and settlement fails.
- Overproduction: Producing duplicate exception reports, repeated reconciliations or unnecessary status updates that do not resolve the underlying issue.
- Waiting: Trades sit in queues while operations teams wait for counterparties, custodians, approvals or missing allocation details.
- Non-utilised talent: Skilled analysts spend time rekeying data, sorting spreadsheets and manually chasing routine responses.
- Transportation: Information moves between email, spreadsheets, ticketing tools and multiple operational platforms.
- Inventory: Unaffirmed trades become work in process (WIP), accumulating risk between execution and settlement.
- Motion: Analysts move between screens, applications and reports to assemble a single trade record.
- Extra-processing: The same trade is checked, reconciled and approved multiple times because upstream validation is incomplete.
The most important constraint is not necessarily the settlement system itself. In this example, the bottleneck is the late-day information flow between allocation, matching and affirmation. A trade cannot move forward until the required information is complete and agreed.
This is consistent with the Theory of Constraints: improving a non-constrained activity will not materially increase throughput if the primary constraint remains protected from improvement.
Future-State Design: Straight-Through Processing With Controlled Exceptions
The future-state map should not attempt to automate every decision. It should automate predictable work and reserve human expertise for genuine exceptions.
Execution
   ↓ real-time capture
Automated Validation
   ↓
Allocation + SSI Enrichment
   ↓ validated reference data
Pre-Match
   ↓
Same-Day Affirmation
   ↓
Exception-Based Alerts
   ↓
Settlement Instruction
   ↓
T+1 Cash-and-Securities Match
   ↓
Automated Reconciliation + Controlled Fail Workflow
The future-state design includes five practical changes:
- Straight-through processing: Trade data flows through APIs or controlled interfaces without repeated manual rekeying.
- Validated SSIs: Standing settlement instructions are centrally governed, version-controlled and checked before the trade reaches the affirmation queue.
- Pre-match controls: Quantity, price, currency, account, counterparty and settlement location are validated earlier in the process.
- Exception-based alerts: Analysts receive alerts for specific conditions: missing data, mismatch, insufficient inventory or approaching cut-off: rather than reviewing every trade.
- Visual cut-off management: A real-time dashboard functions like an Andon signal, highlighting trades that require immediate intervention before the operational deadline.
The objective is not merely a faster process. It is a more predictable process with lower variation and fewer special-cause events.
Current Versus Future Performance
The following table uses an illustrative business-case model. Assumptions include an average $225 cost per failed trade, $18,000 of capital held per fail, a 5% annual capital charge, and $28 per manual repair touch.
| Metric | Current State | Future State | Improvement |
|---|---|---|---|
| Daily trade volume | 2,400 | 2,400 | No change |
| Same-day affirmation | 78% | 95% | +17 percentage points |
| Average execution-to-affirmation time | 6.2 hours | 2.4 hours | 61% reduction |
| Settlement fail rate | 4.1% | 1.2% | 71% reduction |
| Failed trades per month | 2,165 | 634 | 1,531 fewer |
| Manual repair touches per month | 5,851 | 887 | 85% reduction |
| Illustrative penalty and fail cost/month | $487,080 | $142,560 | $344,520 saved |
| Capital held against fails | $39.0 million | $11.4 million | $27.6 million released |
| Annual capital carrying-cost reduction | : | : | $1.38 million |
| Annual manual repair-cost reduction | : | : | $1.67 million |
| Estimated annual savings | : | : | $6.9 million |
The savings estimate combines reduced fail-related costs, lower manual repair effort and reduced capital carrying costs. It excludes technology investment, implementation costs, training and any market-specific charges.
A robust business case should validate each assumption using finance-approved data. The Business Benefit Assessment and financial calculator resources can help structure that analysis.
Ninety-Day Kaizen Sequence
A disciplined implementation sequence reduces risk and makes improvement measurable.
Days 1–30: Define and Measure
- Confirm the scope and process owner.
- Establish a baseline for affirmation time, fail rate and manual touches.
- Stratify failures by cause: allocation, SSI, counterparty mismatch, inventory, funding and system issue.
- Create a daily visual management board.
- Identify the top three failure modes using Pareto analysis.
- Validate the measurement system and timestamp definitions.
Days 31–60: Improve and Pilot
- Pilot automated SSI validation for one asset class or trading region.
- Introduce pre-match checks for the highest-volume trade types.
- Configure exception-based alerts at defined time thresholds.
- Replace broad exception reports with prioritised work queues.
- Test a standard escalation path for trades approaching the 9:00 p.m. operational cut-off.
- Compare pilot performance with a controlled baseline.
Days 61–90: Control and Scale
- Expand successful automation across additional counterparties or portfolios.
- Establish control charts for affirmation time and fail rate.
- Review daily Andon-style alerts and weekly root-cause trends.
- Document standard work for exceptions and approvals.
- Assign ownership for SSI governance and reference-data quality.
- Confirm financial benefits and publish a control plan.

Build the Capability to Improve the Value Stream
Trade settlement is an information-intensive process. Its performance depends on accurate data, rapid decisions, disciplined governance and the ability to distinguish normal flow from meaningful exceptions.
For operations analysts, Lean Six Sigma Yellow Belt training provides a practical foundation in process mapping, waste identification, root-cause analysis and improvement participation. For analysts leading a substantial workstream, Green Belt capability adds statistical analysis, project management, control planning and structured solution validation.
Operations managers responsible for cross-functional transformation should consider Black Belt training. Black Belts lead complex projects, mentor Green Belts and connect operational improvements to enterprise-level financial and risk outcomes.
Lean 6 Sigma Hub offers CSSC-accredited Green Belt training and CSSC-accredited Black Belt training, both designed around practical tools, case studies and self-paced learning.
Start building the capability to map, measure and improve your trade settlement value stream. Enrol in Lean Six Sigma Yellow Belt or Green Belt training as an operations analyst, or pursue Black Belt certification to lead enterprise-level settlement improvement.
Kaizen. Kai-Care. Kai-Done. ( Lean Six Sigma)