

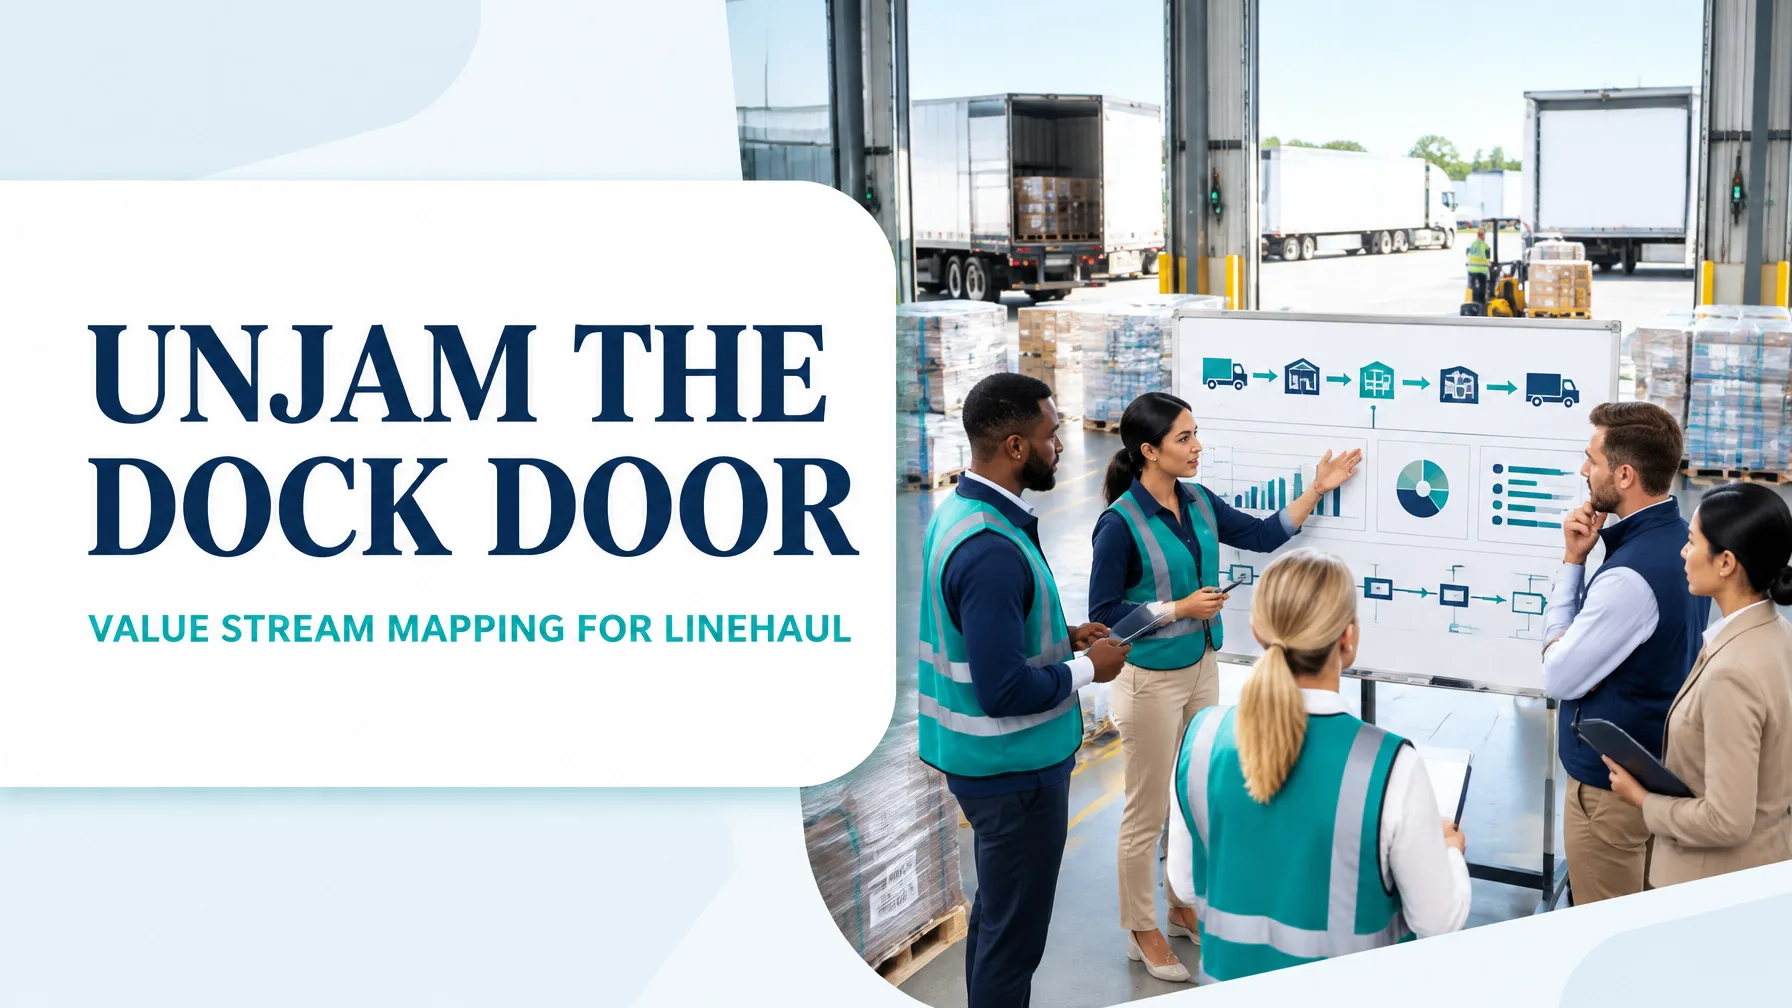
In freight operations, the dock door is rarely the only problem. Delays often originate earlier: an inbound trailer arrives before the floor has capacity, freight is unloaded without a confirmed downstream pull signal, operators search for lane locations, and outbound trailers wait for paperwork, scans, or the final pallet.
Value stream mapping makes this entire system visible.
Rather than examining unloading, sorting, staging, and loading as isolated activities, a value stream map connects the material flow and information flow from inbound trailer arrival to outbound departure. The objective is to see where customer value is created, where freight waits, where capacity is constrained, and how scheduling decisions create congestion.
The Lean Enterprise Institute defines value-stream mapping as the visualisation of every step in the material and information flows required to move a product from order to delivery. In a cross-dock, the equivalent journey is from inbound linehaul arrival to outbound linehaul departure. The Lean Enterprise Institute’s VSM overview provides the broader method, while this guide applies it to a freight network.
1. Select a Focused Freight Product Family and Boundary
A map becomes useful when its scope is specific enough to measure and improve.
For this worked simulation, the selected product family is:
- Product family: Palletised general freight
- Network: One regional cross-dock serving overnight linehaul lanes
- Boundary start: Inbound trailer checked in at the gate
- Boundary end: Outbound trailer released for departure
- Demand pattern: 2,160 pallets per overnight operating cycle
- Operating window: 10 hours from first inbound arrival to final outbound departure
The map excludes long-haul travel between origin and destination terminals. However, it includes the information signals that control the freight: trailer appointments, lane plans, cut-off times, scan confirmations, load status, and release authorisations.
This boundary is important. Mapping the entire transport network in one exercise would create excessive complexity. A focused cross-dock map can reveal the local constraint first, then support an extended value stream mapping exercise across multiple terminals.
2. Build the Current-State Map at the Gemba
The current-state map should be built through direct observation rather than relying solely on TMS, WMS, or yard reports. Walk the freight flow and record what actually happens:
- Trailer arrives and checks in.
- Yard assigns a dock door.
- Team unloads pallets.
- Freight is scanned and sorted by outbound lane.
- Pallets are staged on the cross-dock floor.
- Operators search, move, consolidate, or re-label freight.
- Loading team loads the outbound trailer.
- Supervisor verifies manifest and releases the trailer.
The information flow sits above these steps. It includes the planned arrival schedule, dock assignment, outbound cut-off, loading sequence, exception messages, and final departure approval.
Current-state worked numbers
The following data represents a realistic operating simulation for one overnight cycle:
| Measure | Current state |
|---|---|
| Inbound trailers | 18 |
| Outbound trailers | 12 |
| Pallets processed | 2,160 |
| Average inbound trailer load | 120 pallets |
| Average outbound trailer load | 180 pallets |
| Unload rate | 39 pallets per team-hour |
| Load rate | 34 pallets per team-hour |
| Dock doors | 24 |
| Dock door utilisation | 78% |
| Productive door time | 54% |
| Blocked or idle door time | 24% |
| Average trailer dwell | 7.8 hours |
| Average value-adding processing time | 2.4 hours |
| Cut-off miss rate | 11.8% |
| Average trailer fill | 82% |
| End-to-end transit lead time | 18.6 hours |
| Cross-dock process cycle efficiency | 30.8% |
| End-to-end process cycle efficiency | 12.9% |
The cross-dock process cycle efficiency is calculated as:
2.4 hours of processing ÷ 7.8 hours of cross-dock dwell × 100 = 30.8%
The end-to-end measure is:
2.4 hours of processing ÷ 18.6 hours of total transit lead time × 100 = 12.9%
The conclusion is clear: freight is physically handled for only a small portion of its total time in the network.

3. Identify the Eight DOWNTIME Wastes
A current-state map is not complete until the team connects delays and interruptions to specific forms of waste.
Defects
Mis-sorted freight, damaged pallets, missing labels, and incorrect re-labelling create rework. In the simulation, 4.6% of pallets require a correction scan or relabelling step, adding approximately 52 labour-hours per week.
Overproduction
Early unloading may appear productive, but unloading freight before the outbound lane is ready creates floor congestion. Approximately 260 pallets are unloaded more than two hours before their planned loading window, increasing staging pressure.
Waiting
Trailers wait for doors, drivers wait for paperwork, and outbound loads wait for final scan confirmation. Waiting represents 5.4 of the 7.8 hours of average cross-dock dwell.
Non-utilisation of talent
Supervisors spend an estimated 31% of their shift firefighting door, labour, and exception issues instead of analysing trends, balancing lanes, or coaching standard work.
Transportation
Pallets are moved from an inbound door to a temporary staging zone, then to a consolidation area, and finally to an outbound door. This double handling creates unnecessary forklift travel and increases damage exposure.
Inventory
Freight dwelling on the floor is work in process. At peak, the cross-dock holds 410 pallets, compared with a proposed future-state limit of 240 pallets.
Motion
Operators walk to find freight, labels, scanners, or paperwork. A sample observation found that loaders walked an average of 1.7 kilometres per shift searching for pallets or resolving location uncertainty.
Excess processing
Re-scanning, duplicate manifests, repeated status checks, and manual reconciliation consume time without increasing customer value. Approximately 8% of outbound shipments receive a duplicate verification event.
This analysis follows the central VSM principle: identify not only waste, but the system conditions that create it. In this case, push-based unloading, uneven door allocation, and incomplete information flow are major contributors.
4. Design the Future State: Pace, Pull, and Standardise
The future-state map should describe a practical operating condition that can be achieved within a defined improvement window. It should not be an abstract vision.
The proposed future state uses five design principles.
1. Create a paced freight flow
Establish a lane-level pitch rather than unloading freight whenever a trailer becomes available. For example, each three-lane cluster releases approximately 24 pallets every 20 minutes, matched to outbound loading capacity and departure cut-offs.
2. Level-load the dock doors
Assign doors using arrival profile, lane demand, trailer cube, and departure priority. Reserve a controlled number of flex doors for exceptions rather than allowing every door to become an informal overflow location.
3. Define standard work per lane
Each lane receives a standard sequence covering:
- Trailer check-in and door confirmation
- Pallet scan and destination verification
- Direct-to-lane placement rules
- Exception identification
- Staging maximums
- Loading sequence
- Final departure release
4. Use pull-based trailer release
An outbound trailer is released for loading when the required freight is available, scans are complete, and the departure window is open. This prevents premature loading and reduces finished-but-waiting trailers.
5. Install visual escalation
A simple Andon-style signal can identify blocked doors, missing freight, scan exceptions, and cut-off risk in real time. The aim is rapid response based on clear triggers, not additional reporting.

5. Current Versus Future-State Performance
| Metric | Current state | 90-day future state | Improvement |
|---|---|---|---|
| Average trailer dwell | 7.8 hours | 4.6 hours | 41.0% reduction |
| Dock door utilisation | 78% | 81% | Better balance |
| Productive door time | 54% | 74% | 20-point increase |
| Blocked or idle door time | 24% | 7% | 17-point reduction |
| Cut-off miss rate | 11.8% | 3.5% | 70.3% reduction |
| Average trailer fill | 82% | 91% | 9-point increase |
| Peak floor WIP | 410 pallets | 240 pallets | 41.5% reduction |
| Rework and relabelling | 4.6% | 1.8% | 60.9% reduction |
| Cross-dock process cycle efficiency | 30.8% | 45.7% | 14.9-point increase |
| End-to-end transit lead time | 18.6 hours | 14.2 hours | 23.7% reduction |
The future-state design does not simply ask teams to work faster. It changes the flow rules so that freight arrives at the right door, at the right time, with the right information.
6. Execute the 90-Day Kaizen Sequence
A value stream map becomes operational only when translated into owners, actions, and targets.
Days 1–30: Stabilise and make the flow visible
Owners: Cross-dock manager, operations supervisors, process improvement lead
Actions:
- Validate trailer, pallet, dwell, and cut-off definitions.
- Complete a door-by-door utilisation study.
- Mark standard inbound, outbound, and exception zones.
- Introduce a visual hourly flow board.
- Publish standard work for scanning, staging, and exception handling.
Targets:
- Reduce blocked or idle door time from 24% to 15%.
- Reduce peak WIP from 410 to 340 pallets.
- Improve data completeness to 95% of trailers.
Days 31–60: Pilot paced flow and pull release
Owners: Linehaul planning manager, dock supervisor, WMS analyst
Actions:
- Pilot 20-minute freight pitches on three high-volume lanes.
- Introduce door levelling by departure priority.
- Set staging maximums for each lane.
- Replace premature unloading with a pull signal.
- Test Andon escalation for cut-off risk and missing freight.
Targets:
- Reduce average dwell from 7.8 to 5.8 hours.
- Reduce cut-off misses from 11.8% to 6.0%.
- Improve average trailer fill from 82% to 87%.
Days 61–90: Scale, control, and sustain
Owners: Regional operations leader, Black Belt or improvement lead, finance partner
Actions:
- Extend the pilot to all priority lanes.
- Confirm standard work through layered process audits.
- Track daily performance using a control plan.
- Review weekly variation by shift, lane, and carrier.
- Quantify labour, damage, rework, and service benefits.
Targets:
- Reach 4.6 hours average dwell.
- Achieve 3.5% or lower cut-off misses.
- Reduce rework and relabelling to 1.8%.
- Sustain process cycle efficiency above 45% for four consecutive weeks.

Build the Capability to Lead Better Flow
Value stream mapping is most powerful when teams can connect observation to data, data to root cause, and root cause to controlled improvement. That capability supports broader Lean Six Sigma frameworks, including DMAIC, Theory of Constraints, standard work, visual management, and control planning.
If you lead freight, warehouse, transport, or operations teams, Lean Six Sigma Green Belt training can help you build practical skills in process mapping, measurement planning, root-cause analysis, statistical thinking, and improvement validation. Explore the CSSC-accredited Lean Six Sigma Green Belt Online Training from Lean 6 Sigma Hub, or review the wider range of Lean Six Sigma online training options.
Start mapping the flow, quantify the constraint, and pursue Lean Six Sigma certification to lead measurable improvement across your network.
Kaizen. Kai-Care. Kai-Done. Lean Six Sigma





