
In property management, a maintenance request rarely fails because one person is unwilling to help. More often, the process contains unclear priorities, fragmented information, approval delays, unavailable parts, repeated data entry, and poorly defined handoffs.
Value stream mapping makes those conditions visible.
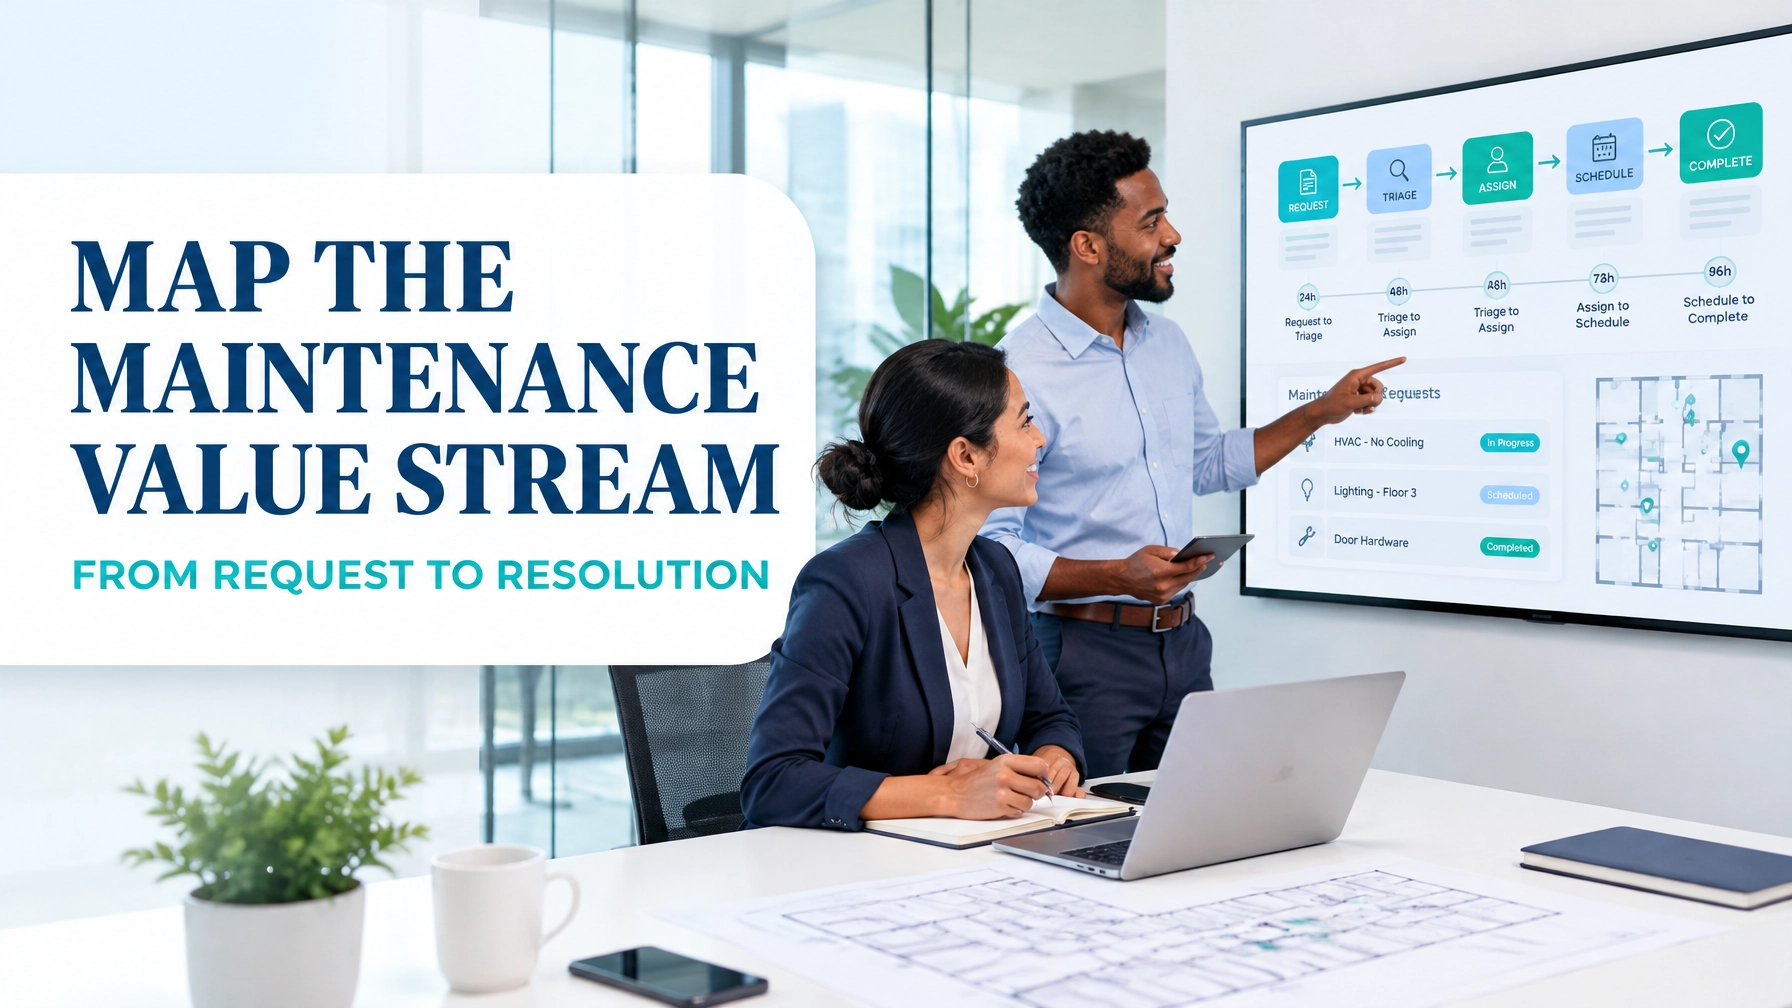
Applied to facilities maintenance, value stream mapping follows the complete journey from a tenant’s initial request to a verified repair, system close-out, and tenant notification. The objective is not to identify who made a mistake. It is to understand how the system creates delay, variation, rework, and avoidable cost.
This deep guide shows how property managers, facility managers, and real estate operations leaders can map and improve the maintenance request process using Lean Six Sigma principles.
1. Select a Focused Maintenance Value Stream
A value stream includes every activity and information flow required to deliver a service to the customer. In property management, the customer is usually the tenant, resident, building occupant, or internal business unit.
Do not begin by mapping every maintenance category at once. Select a focused product family, such as:
- Routine plumbing repairs
- HVAC comfort complaints
- Electrical faults
- Lift or access-control issues
- Common-area lighting repairs
- Urgent water leaks
For this worked example, the scope is:
From tenant submission of a routine in-unit plumbing request to verified repair, tenant notification, and work-order closure.
The process begins when the tenant submits the request and ends when:
- The technician confirms the issue is resolved.
- The property team completes inspection or sign-off.
- The tenant receives a completion update.
- The work order is closed with accurate cost and labour data.
This boundary prevents the team from confusing emergency response, capital projects, preventive maintenance, and routine reactive repairs.
2. Build the Current-State Map Without Assigning Blame
A cross-functional team should include:
- Property managers
- Maintenance coordinators
- Facilities supervisors
- Technicians
- Approved vendors
- Procurement or stores personnel
- Finance representatives
- Tenant-service staff
Use CMMS records, interviews, direct observation, and a sample of actual work orders. The Lean Enterprise Institute’s value stream mapping overview reinforces the importance of mapping both process steps and information flow.
A practical current-state sequence may look like this:
Tenant request → Intake and logging → Triage → Approval → Vendor selection → Scheduling → Parts procurement → Dispatch → First visit → Repair or revisit → Inspection sign-off → Tenant update → Work-order closure
Map the actual process, including workarounds. If a coordinator copies an email into a spreadsheet before entering it into the CMMS, include it. If a technician waits for tenant access, include it. If an approval sits in an inbox for two days, include it.
Worked current-state example
A 1,200-unit residential portfolio reviewed 90 routine plumbing work orders over a 30-day period. The broader monthly workload was:
- 444 routine tickets
- 36 urgent tickets
- 480 total maintenance requests
- 86 open work orders at month-end
- 9.4 days average backlog age
The sample revealed the following average performance:
| Process measure | Current state |
|---|---|
| Request intake and logging | 22 minutes |
| Wait for triage | 9 hours |
| Triage activity | 12 minutes |
| Approval wait | 14 hours |
| Approval activity | 6 minutes |
| Scheduling wait | 2.4 days |
| Vendor dispatch and coordination | 14 minutes |
| Parts procurement wait | 2.1 days |
| First-visit fix rate | 62% |
| Repeat-visit rate | 38% |
| Inspection sign-off wait | 1.2 days |
| Closure administration wait | 18 hours |
| Mean time to resolve | 7.6 calendar days |
| Tenant satisfaction | 3.2 out of 5 |
| Average cost per work order | $186 |
| Active processing time | 86 minutes |
The 86 minutes of active work is small compared with the 7.6-day total lead time, which equals approximately 10,944 minutes. The process cycle efficiency is therefore:
[
\text{PCE} = \frac{86}{10,944} \times 100 = 0.79%
]
This does not mean the maintenance team is unproductive. It means most elapsed time exists between activities rather than within the repair itself.

3. Identify the Eight DOWNTIME Wastes
The current-state map provides evidence for discussing waste objectively. The eight DOWNTIME categories can be applied as follows:
- Defects: Incorrect categorisation, incomplete repair notes, or a failed first visit.
- Overproduction: Creating duplicate work orders or requesting reports no one uses.
- Waiting: Delays for triage, approval, tenant access, parts, or inspection sign-off.
- Non-utilized talent: Technicians spending time chasing approvals instead of resolving issues.
- Transportation: Unnecessary movement of parts between offices, stores, and properties.
- Inventory: Overstocked slow-moving parts alongside shortages of commonly used items.
- Motion: Searching through systems, inboxes, keys, photographs, and vendor records.
- Extra-processing: Re-entering the same request into email, spreadsheets, CMMS, and billing systems.
The largest visible constraints in this example are waiting, parts availability, and first-visit quality. The approval process is also a bottleneck because every work order above $250 requires a separate review, including common repairs with predictable costs.
This is where value stream mapping changes the conversation. Instead of asking, “Who caused the delay?” the team asks, “Which condition allows this queue to form?”
4. Connect the Map to Customer and Process Requirements
The Voice of the Customer may include:
- Fast acknowledgement
- Clear appointment times
- Safe and durable repairs
- Fewer repeat visits
- Proactive updates
These requirements can be translated into critical-to-quality measures, or CTQs:
- First response within 30 minutes for urgent tickets
- Routine requests triaged within 4 business hours
- First-visit fix rate above 80%
- Tenant satisfaction above 4.2 out of 5
- Accurate completion notification within one business day
The Voice of the Business may prioritise cost control, vendor performance, compliance, and asset reliability. The Voice of the Process comes from timestamps, backlog data, defect records, and work-order history. A sustainable future state balances all three voices rather than improving speed at the expense of safety or quality.
5. Design the Future-State Value Stream
The future state should remove unnecessary handoffs while preserving governance and control. In the example, the improvement team proposes:
- A single digital intake form with required photos, location, access details, and issue category.
- Standard triage rules separating urgent and routine work.
- Delegated approval for routine repairs up to $500 using an approved price catalogue.
- A daily scheduling board with visible capacity and priority rules.
- Standard parts kits for the ten most frequent plumbing repairs.
- Technician access to repair history, photographs, and parts availability before dispatch.
- Same-day inspection sign-off for completed work.
- Automated tenant updates at intake, scheduling, completion, and closure.
- A weekly review of repeat visits, aged backlog, and vendor performance.
The target is not “work faster” in isolation. It is better flow, fewer defects, and more predictable service.

Current versus future state
| Measure | Current state | Future-state target |
|---|---|---|
| Intake and logging | 22 minutes | 5 minutes |
| Triage wait | 9 hours | 1 hour |
| Approval wait | 14 hours | 1 hour |
| Scheduling wait | 2.4 days | 0.8 days |
| Parts procurement wait | 2.1 days | 0.6 days |
| First-visit fix rate | 62% | 84% |
| Repeat-visit rate | 38% | 16% |
| Inspection sign-off wait | 1.2 days | Same day |
| Mean time to resolve | 7.6 days | 2.4 days |
| Backlog | 86 work orders | 28 work orders |
| Average backlog age | 9.4 days | 3.1 days |
| Tenant satisfaction | 3.2/5 | 4.4/5 |
| Cost per work order | $186 | $151 |
| Active processing time | 86 minutes | 74 minutes |
| Process cycle efficiency | 0.79% | 2.14% |
The future state reduces lead time by 68%, lowers average cost by approximately 18.8%, and increases first-visit fixes by 22 percentage points.
6. Use the Wider Lean Six Sigma Toolkit
Value stream mapping is strongest when supported by structured analysis.
During the Analyse Phase of DMAIC, use an affinity diagram to organise large volumes of tenant and technician ideas into natural categories such as access, parts, communication, scheduling, and quality.
Use a time observation sheet to record actual step times. Attribute data, such as Pass/Fail inspection results, supports quality analysis. The average, or mean, establishes a baseline, while a box plot shows spread, skewness, and outliers. A z-score helps compare unusually long work orders across different buildings.
For deeper analysis:
- ANOVA can compare mean resolution times across vendors or property types.
- Bartlett’s Test can assess whether group variances are sufficiently equal before ANOVA.
- Bias must be checked if technicians or coordinators record timestamps inconsistently.
- An X-bar chart with an R chart can monitor average response time and variation over time.
- Y = f(x) reminds the team that resolution time is influenced by inputs such as request quality, parts availability, priority rules, and technician capability.
- Takt time, calculated as available service capacity divided by customer demand, helps determine whether coordinator and technician capacity can support the incoming ticket volume.
- Throughput measures how many work orders are closed per period.
- Yield, including first-pass yield and rolled throughput yield, shows how many requests move through the process without rework.
- Andon-style visual signalling can alert teams to urgent safety issues or stalled work orders in real time.
- Autonomation, or Jidoka, can be applied through system rules that detect missing information, duplicate tickets, or overdue approvals and trigger an appropriate response.
Agile practices also complement Lean Six Sigma. Instead of waiting for a perfect transformation plan, the team can test one standard triage rule, review results over a two-week sprint, and adjust the process using evidence.
7. Sequence the Kaizen Events
A practical improvement sequence is:
Kaizen Event 1: Intake and triage
- Standardise request categories.
- Define urgent versus routine criteria.
- Add mandatory information fields.
- Set response-time alerts.
- Establish clear service-level expectations.
Kaizen Event 2: Approval and scheduling
- Create delegated approval limits.
- Build a daily visual scheduling board.
- Set workload rules for vendors and internal technicians.
- Make approval status visible to all relevant roles.
Kaizen Event 3: Parts and first-visit quality
- Analyse the top ten repeat repair types.
- Create standard parts kits.
- Add diagnostic checklists.
- Confirm parts availability before dispatch.
- Track first-visit fix rate by vendor and issue type.
Kaizen Event 4: Verification and close-out
- Introduce same-day inspection rules.
- Standardise completion photographs and notes.
- Automate tenant notifications.
- Close work orders only when quality and cost fields are complete.
Kaizen Event 5: Control and sustainment
- Review weekly lead time, backlog, cost, first-visit fix rate, and satisfaction.
- Use control charts to identify variation.
- Audit adherence to the future-state process.
- Escalate recurring bottlenecks through the governance structure.
Formal approval remains important for safety, compliance, and financial control. However, unnecessary approval layers can become bottlenecks. The business case should show where controls are essential and where standard work can safely replace repeated individual review.
8. Build Capability Beyond One Improvement Project
A White Belt can understand the basic principles and DMAIC awareness needed to participate in a mapping exercise. A Yellow Belt can support data collection, problem solving, and smaller improvement activities. A Black Belt leads complex cross-functional projects, applies advanced statistical methods, and mentors Green Belts. Master Black Belt capability supports governance, coaching, and enterprise deployment.
Property and facilities leaders can explore the Lean Six Sigma practitioner guide, the Yellow Belt online training course, and the broader Lean Six Sigma training pathway.
Start your Lean Six Sigma certification journey today and learn how to turn maintenance delays, backlog, and variation into measurable improvements in tenant experience, cost, and operational flow.
Kaizen. Kai-Care. Kai-Done. ( Lean Six Sigma)


