
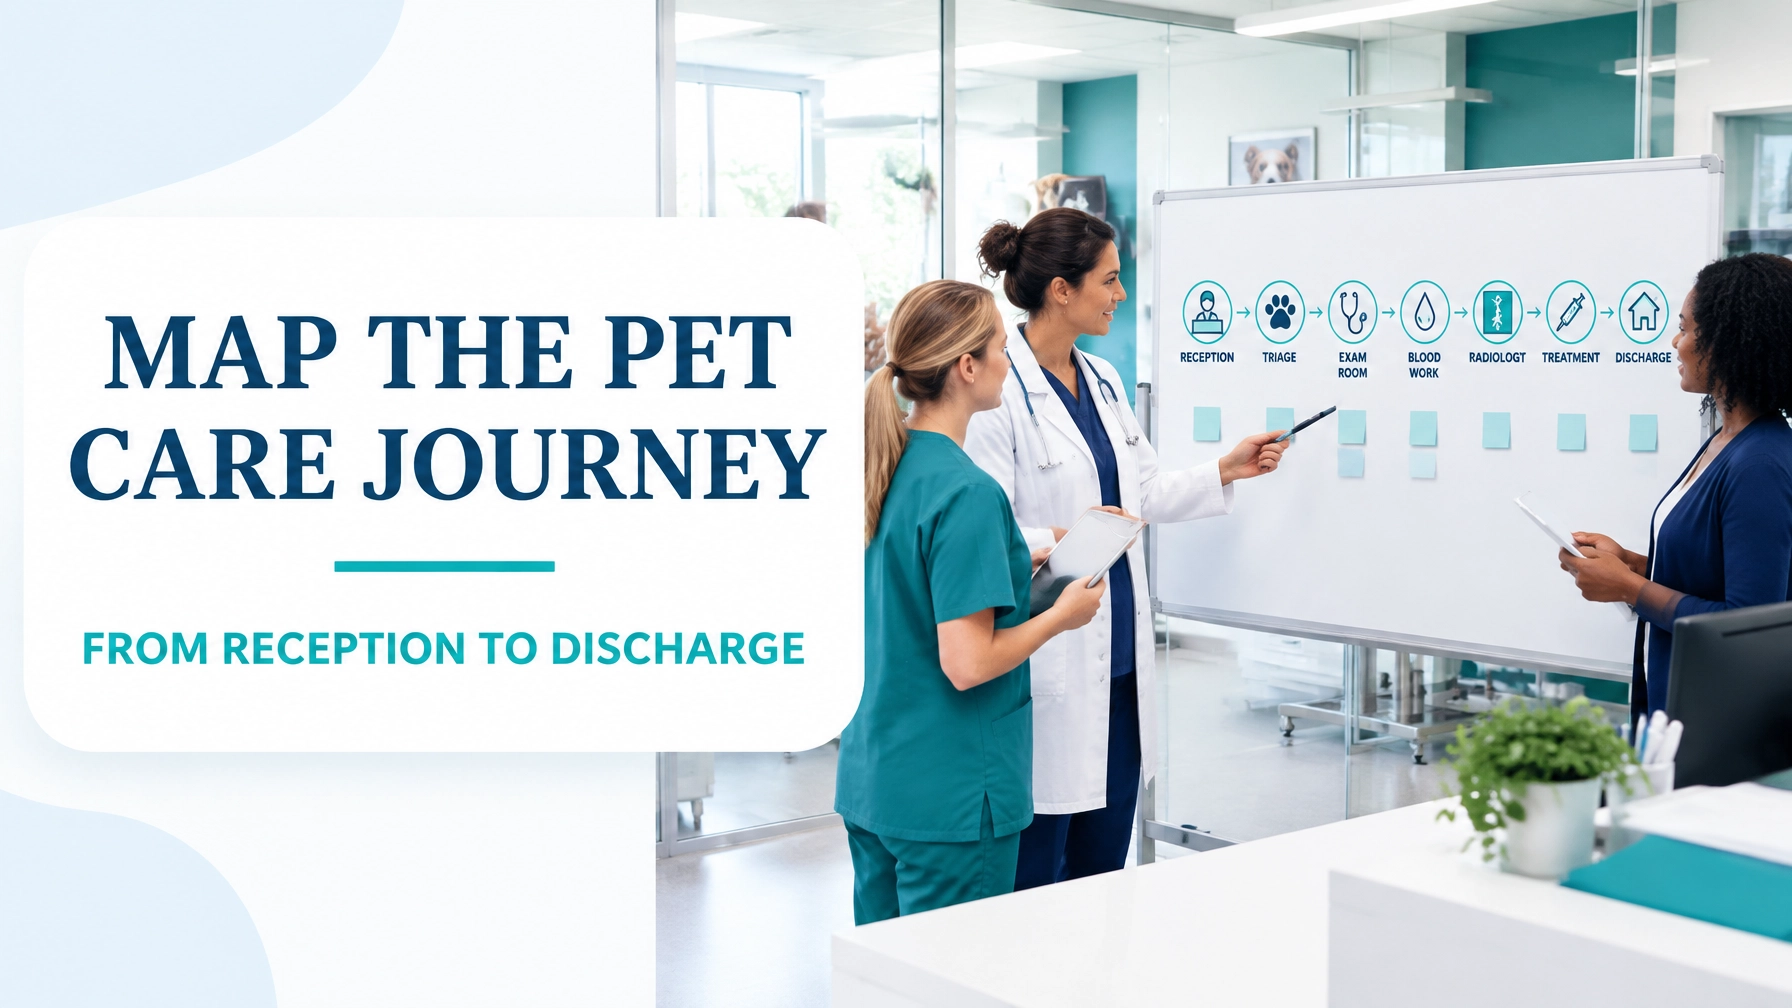
In a veterinary clinic, excellent medical care can still be undermined by long queues, repeated questions, unavailable exam rooms and delayed discharge. Value stream mapping provides a practical way to see the entire client-and-patient journey: not just the veterinarian’s consultation.
The fundamental purpose of value stream mapping is to distinguish value-adding clinical work from waiting, rework, movement and administrative delay. For veterinary practice managers and clinic owners, the method creates a shared view of how reception, technicians, veterinarians, diagnostics, treatment and billing interact.
This guide presents a worked example for a hypothetical small-animal clinic. The figures are illustrative, but the method can be applied directly using your own practice-management data.
1. Select a Focused Value Stream
Do not begin by mapping every service in the clinic. Select one representative patient stream with a clear start and finish.
For this example:
- Start: Client and pet arrive at reception.
- End: Patient is discharged, payment is completed and follow-up is scheduled.
- Patient type: General small-animal appointment, including wellness and sick visits.
- Scope: Check-in, triage, consultation, blood work or radiology, treatment and discharge.
- Exclusions: Surgery, overnight hospitalisation and emergency intensive care.
The clinic has four exam rooms, two veterinarians and four veterinary technicians. It operates for 10 hours per day.
A useful value definition is: the pet receives safe, timely assessment and treatment, while the client receives clear communication and an efficient experience. Activities that directly support diagnosis, treatment, education or safety are generally valuable. Activities such as searching for supplies, correcting incomplete notes or waiting for an available room do not create equivalent value.
2. Map the Current State at the Gemba
A value stream map should be based on observation, not assumptions. Walk with several patients through the real process and record:
- Arrival and check-in time
- Triage start and completion
- Time waiting for the veterinarian
- Consultation duration
- Diagnostic turnaround time
- Treatment duration
- Invoice preparation and discharge time
- Queue size at each step
- Handoffs, duplicate data entry and rework

The clinic’s current-state map revealed the following flow:
Reception → Triage → Exam room → Consultation → Diagnostics → Treatment → Discharge
The information flow was more complicated. Reception entered client details, technicians re-entered the presenting complaint, and veterinarians often repeated questions because triage notes were incomplete. Diagnostic orders were sometimes written in the consultation room and entered later by another team member.
Current-State Worked Example
The clinic records an average of 50 completed patient visits per day:
- 50 scheduled appointments booked
- 12% no-show rate, equivalent to approximately six missed appointments
- 44 scheduled patients arriving
- Six walk-in patients accepted
- Completed mix: 88% scheduled and 12% walk-in
- Average appointment duration from arrival to discharge: 91 minutes
- Average client waiting time: 39 minutes
The following data represents the average journey for a patient requiring diagnostics:
| Process step | Value-added or processing time | Average waiting time | Current observation |
|---|---|---|---|
| Reception/check-in | 5 minutes | 8 minutes | Forms and payment details frequently incomplete |
| Technician triage | 7 minutes | 7 minutes | Vital signs and history captured inconsistently |
| Veterinarian consultation | 15 minutes | 13 minutes | Primary queue forms outside exam rooms |
| Blood work or radiology | 10 minutes | 6 minutes | Blood turnaround averages 18 minutes; radiology averages 28 minutes |
| Treatment | 8 minutes | 5 minutes | Technician waits for room or order confirmation |
| Discharge/checkout | 7 minutes | : | Invoice and instructions prepared late |
| Total | 52 minutes | 39 minutes | 91-minute patient journey |
The process cycle efficiency is:
[
\text{PCE} = \frac{52}{91} \times 100 = 57.1%
]
This is a useful baseline, but it should be interpreted carefully. Not every minute of clinical work has the same importance, and diagnostic turnaround may be necessary even when it is not directly value-adding from the client’s perspective.
The operational indicators show a clearer bottleneck:
- Technician utilisation: 91%
- Veterinarian utilisation: 86%
- Exam-room occupancy: 94%
- Average exam-room queue: 3.2 patients
- Revenue per exam-room hour: $178
- Average consultation duration: 15 minutes
- No-show rate: 12%
The exam rooms are operating close to full capacity, but this does not mean the system is flowing well. At 94% occupancy, there is little capacity to absorb walk-ins, complex consultations, late arrivals or diagnostic delays.
3. Identify the Eight DOWNTIME Wastes
The current map exposes all eight forms of Lean waste:
- Defects: Incomplete histories, incorrect patient details and missing diagnostic consent create rework.
- Overproduction: Printing duplicate forms and preparing information before it is required adds administrative work.
- Waiting: Clients wait at reception, patients wait for triage, and veterinarians wait for rooms or diagnostic results.
- Non-utilised talent: Technicians spend time searching for supplies or performing duplicate data entry instead of supporting clinical flow.
- Transportation: Patients move between exam rooms, treatment and radiology because case routing is not standardised.
- Inventory: Overstocked rooms contain slow-moving consumables while commonly used items run short.
- Motion: Staff walk to printers, medication storage, diagnostic equipment and billing terminals repeatedly.
- Extra processing: The same history is collected verbally, on paper and in the practice-management system.
The most significant constraint is the combination of high exam-room occupancy and variable veterinarian availability. The room is not always the true cause of delay; it becomes the visible queue when upstream triage and downstream diagnostics are not synchronised.
4. Build the Future-State Map
A future-state value stream should create smoother flow without compromising clinical judgement or patient safety. The proposed design uses several countermeasures:
- Send digital pre-visit forms and medication questions before arrival.
- Use a standard triage template covering weight, temperature, pain, chief complaint and medication review.
- Create a visible room-status system: Needs Cleaning, Ready, Patient Present and Awaiting Vet.
- Separate routine technician appointments from veterinarian consultation capacity.
- Pre-label common blood-work and radiology orders within approved clinical protocols.
- Prepare the invoice progressively rather than waiting until discharge.
- Assign one team member to coordinate diagnostic status and room readiness.
- Reserve a small daily capacity buffer for walk-ins and overruns.
- Standardise discharge instructions and follow-up scheduling.

The target state does not attempt to eliminate every wait. It places necessary waiting under control and removes preventable queues.
| Metric | Current state | Future-state target | Improvement |
|---|---|---|---|
| Completed visits per day | 50 | 53 | +6% |
| Scheduled no-show rate | 12% | 6% | 50% reduction |
| Walk-in share of completed visits | 12% | 11% | Better planned capacity |
| Average appointment duration | 91 minutes | 67 minutes | 24 minutes shorter |
| Average client waiting time | 39 minutes | 17 minutes | 56% reduction |
| Technician utilisation | 91% | 84% | More capacity for patient care |
| Veterinarian utilisation | 86% | 82% | More stable workload |
| Exam-room occupancy | 94% | 84% | Buffer for variation |
| Blood-work turnaround | 18 minutes | 11 minutes | 39% reduction |
| Radiology turnaround | 28 minutes | 18 minutes | 36% reduction |
| Revenue per exam-room hour | $178 | $215 | 21% increase |
| Process cycle efficiency | 57.1% | 74.6% | +17.5 percentage points |
The projected revenue figure is based on room-attributable daily revenue increasing from approximately $7,100 to $8,600, divided by 40 available exam-room hours. It is a planning estimate, not a guarantee. The clinic should validate the result against its own pricing, case mix and staffing model.
You can calculate your baseline using the Process Cycle Efficiency Calculator, which separates value-added time from waiting, rework and queueing.
5. Sequence the Kaizen Events
Implement the future state in a sequence that protects patient care and allows the team to learn.
Kaizen Event 1: Standardise Reception and Pre-Visit Intake
Timing: Week 1
- Introduce digital forms.
- Confirm presenting complaint before arrival.
- Create an express check-in route for completed forms.
- Track arrival-to-check-in time and registration defects.
Target: Reduce check-in waiting from 8 minutes to 3 minutes.
Kaizen Event 2: Stabilise Triage and Room Readiness
Timing: Week 2
- Introduce the standard triage template.
- Define technician responsibilities.
- Stock each exam room using a minimum-and-maximum system.
- Add visual room-status signals.
Target: Reduce triage waiting from 7 minutes to 3 minutes and room-related delays by 50%.
Kaizen Event 3: Improve Diagnostic Flow
Timing: Week 3
- Create standard blood-work and radiology request pathways.
- Assign diagnostic ownership.
- Track order-to-result time.
- Use a visible queue for samples and imaging.
Target: Reduce blood-work turnaround to 11 minutes and radiology turnaround to 18 minutes.
Kaizen Event 4: Redesign Discharge
Timing: Week 4
- Begin invoice preparation during treatment.
- Standardise medication verification.
- Use digital discharge instructions.
- Schedule follow-ups before the client leaves.
Target: Reduce checkout waiting and improve discharge completeness to at least 98%.
Kaizen Event 5: Control and Sustain
Timing: Week 5 onward
Review the following metrics daily or weekly:
- Client waiting time
- Exam-room occupancy
- No-show rate
- Diagnostic turnaround
- Rework incidents
- Completed visits per day
- Revenue per room-hour
- Client and staff feedback
Use a control chart where appropriate, and distinguish normal process variation from special causes such as staff absence, equipment failure or an unusual emergency case.
6. Turn the Map into Management Capability
Value stream mapping is not simply a drawing exercise. It is a structured method for aligning the Voice of the Customer, the Voice of the Process and the Voice of the Business.
Clients want timely care, clear explanations and predictable communication. The process must reliably deliver safe clinical decisions. The business must maintain sustainable utilisation, revenue and staff capacity. A well-designed future state balances all three.
For further Lean Six Sigma guidance, explore the complete material-flow improvement guide and the Lean Six Sigma practitioner guide.
Build the capability to map, measure and improve your clinic’s most important workflows with Lean Six Sigma certification from Lean 6 Sigma Hub. Explore the Yellow Belt or Green Belt programme and turn operational insight into measurable patient, client and business results.
Kaizen. Kai-Care. Kai-Done. ( Lean Six Sigma)


