

In the realm of Statistical Process Control (SPC), organizations strive to achieve a state of "predictable performance." To reach this level of operational maturity, Lean Six Sigma practitioners rely on specific visual tools to interpret the performance of their processes over time. Among the most critical of these tools is the P Chart.
The fundamental purpose of a P Chart is to monitor the proportion of nonconforming (defective) items in a process where the data is binary: meaning an item either passes or fails. Understanding what is a p chart and how it serves as the definitive voice of process is essential for any professional looking to drive quality improvements.
Defining the P Chart: Tracking Attribute Data
To fully appreciate the utility of a P Chart, one must first understand the type of data it is designed to handle. In Six Sigma, we categorize data into two primary streams: continuous (variable) and discrete (attribute).
A P Chart is specifically utilized for attribute data. This involves categorical classifications such as:
- Pass/Fail
- Go/No-Go
- Correct/Incorrect
- Compliant/Non-compliant
Unlike a U Chart, which counts the number of defects (where one item could have multiple flaws), a P Chart tracks defective units. If a car has a scratch, a dent, and a broken light, a U Chart might record three defects, but a P Chart simply records one defective unit. The "P" stands for Proportion, representing the fraction of nonconforming units out of the total sample size.
The Mechanics of the P Chart
The P Chart is a dynamic control chart that plots the proportion of defects on the y-axis against time or subgroup sequences on the x-axis. It consists of three primary statistical components:
- The Center Line (p-bar): This represents the average proportion of defectives across all subgroups. It is the baseline expectation of the process.
- Upper Control Limit (UCL): Usually set at three standard deviations above the center line. It defines the maximum threshold of variation that can be attributed to common causes.
- Lower Control Limit (LCL): Set at three standard deviations below the center line. If the proportion falls below this, it may indicate a significant improvement in the process that warrants investigation to sustain the gain.
A unique characteristic of the P Chart is its ability to handle variable subgroup sizes. Because it measures proportions, the control limits will "zigzag" or adjust if the number of items inspected changes from one interval to the next. For instance, if you inspect 100 units on Monday and 500 units on Tuesday, the P Chart mathematically adjusts the limits to maintain statistical validity. For a deeper look at how sampling affects these results, you may explore understanding statistical sampling plans.
Voice of Process (VOP) vs. Voice of Customer (VOC)
A common point of confusion for those new to Lean Six Sigma is the distinction between the Voice of the Process (VOP) and the Voice of the Customer (VOC).
Voice of the Customer (VOC)
The VOC represents the requirements, expectations, and specifications set by the end-user. It is external and dictates what "good" looks like. If a customer requires a loan application to be processed in 24 hours, that is the VOC. We often capture and prioritize these needs using tools like the Voice of Customer Priority Matrix.
Voice of the Process (VOP)
The VOP is the internal reality of what the process is actually capable of delivering. The P Chart is the primary megaphone for the VOP. It tells you if the process is stable and predictable.
The critical realization: A process can be "In Control" according to the VOP (meaning it is stable and predictable) but still failing to meet the VOC (meaning it is producing too many defects for the customer's liking). The P Chart helps you identify if a sudden spike in defects is a "Special Cause" (a one-time glitch) or "Common Cause" variation (the process is simply not designed to do better).
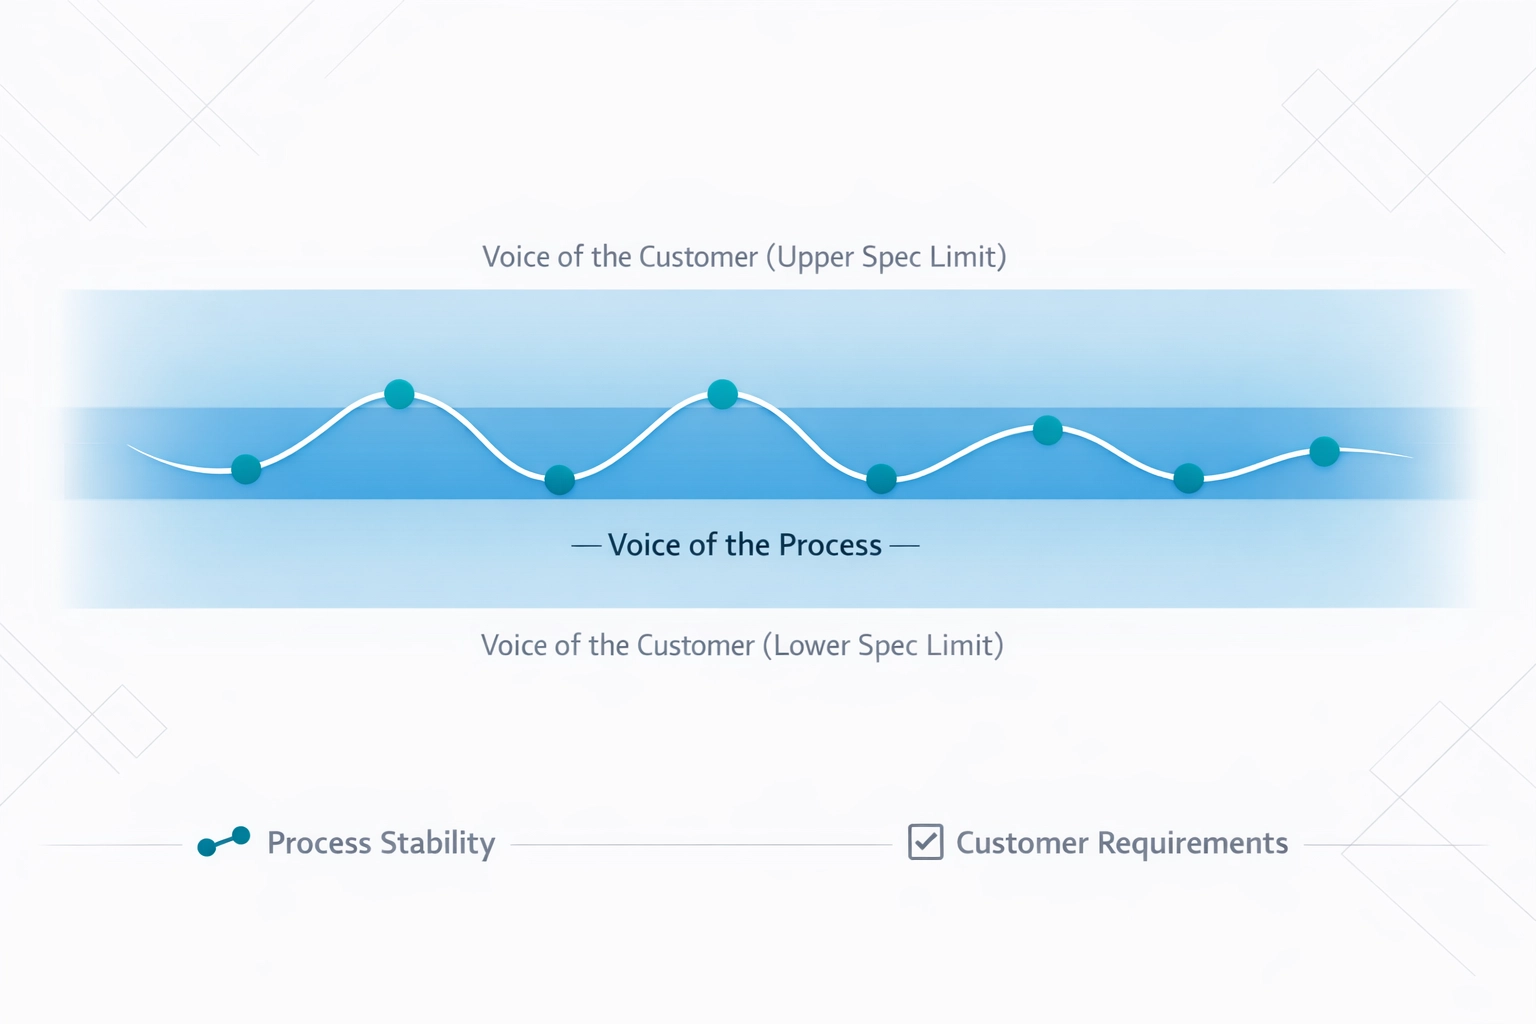
Suggested caption: A visual comparison showing a P Chart representing the VOP and a specification limit representing the VOC.
Interpreting P Charts in Sigma Magic
Modern Lean Six Sigma practitioners rarely calculate these limits by hand. Software such as Sigma Magic provides a robust platform for generating attribute control charts with precision. Using Sigma Magic, a user can simply input their "Number of Defectives" and "Subgroup Size" to generate a professional-grade P Chart.
When interpreting the output in Sigma Magic, look for the following "Out of Control" signals:
- Points outside limits: Any point above the UCL or below the LCL suggests a special cause variation.
- Trends: Six or more consecutive points steadily increasing or decreasing.
- Shifts: Eight or more consecutive points on one side of the center line.
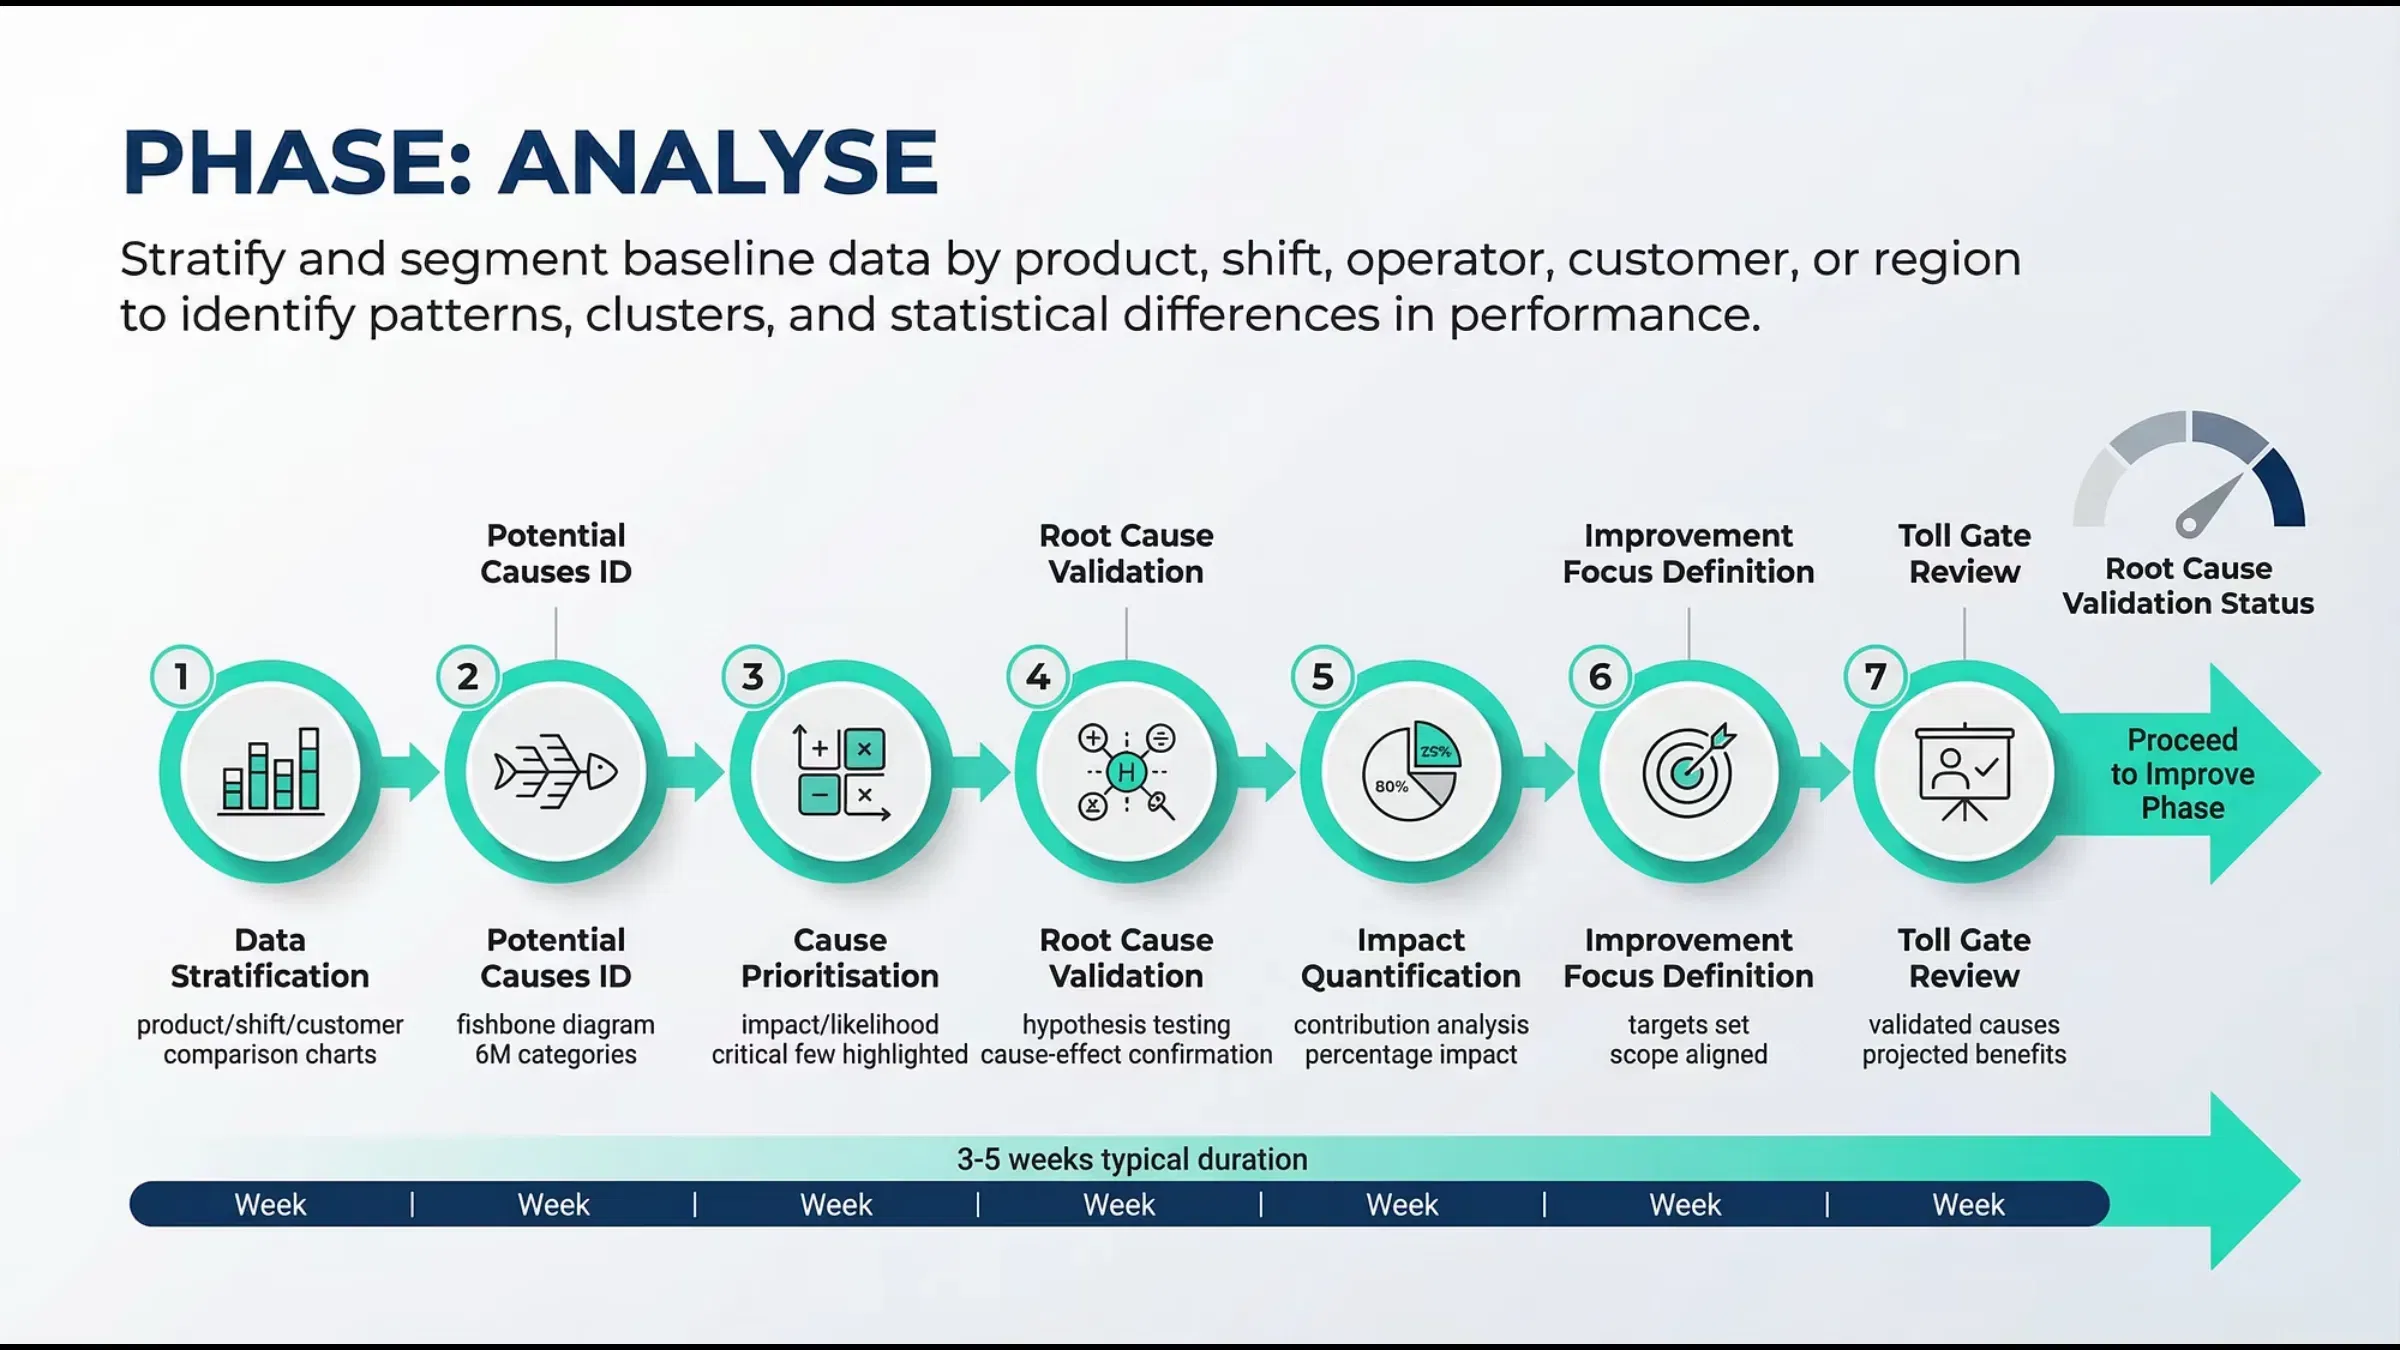
If your process shows these signs, it is time to transition into the Analyse phase to identify root causes. You can utilize our Analyse phase roadmap to guide your investigation into why the proportion of defectives has shifted.
Practical Example: Insurance Claims Processing
Consider an insurance firm that processes 1,000 claims daily. They want to track the proportion of claims rejected due to missing documentation.
- Day 1: 1,050 claims processed, 52 rejected (p = 0.049)
- Day 2: 980 claims processed, 44 rejected (p = 0.044)
- Day 3: 1,100 claims processed, 115 rejected (p = 0.104)
Upon plotting this on a P Chart, Day 3 appears as a significant outlier above the UCL. Because the P Chart accounts for the "Voice of the Process," the manager knows this isn't just a "bad day": it is a statistically significant event. Investigation reveals that a new software update was rolled out on Day 3, causing a glitch. This is a Special Cause variation. Without the P Chart, the manager might have dismissed the 115 rejections as standard fluctuation.
For teams looking to validate their own process data, using a free six sigma calculator can assist in basic proportion checks before committing to full software suites.
Integration Within the DMAIC Framework
The P Chart is not a standalone tool; it is an integral part of the DMAIC (Define, Measure, Analyse, Improve, Control) methodology.
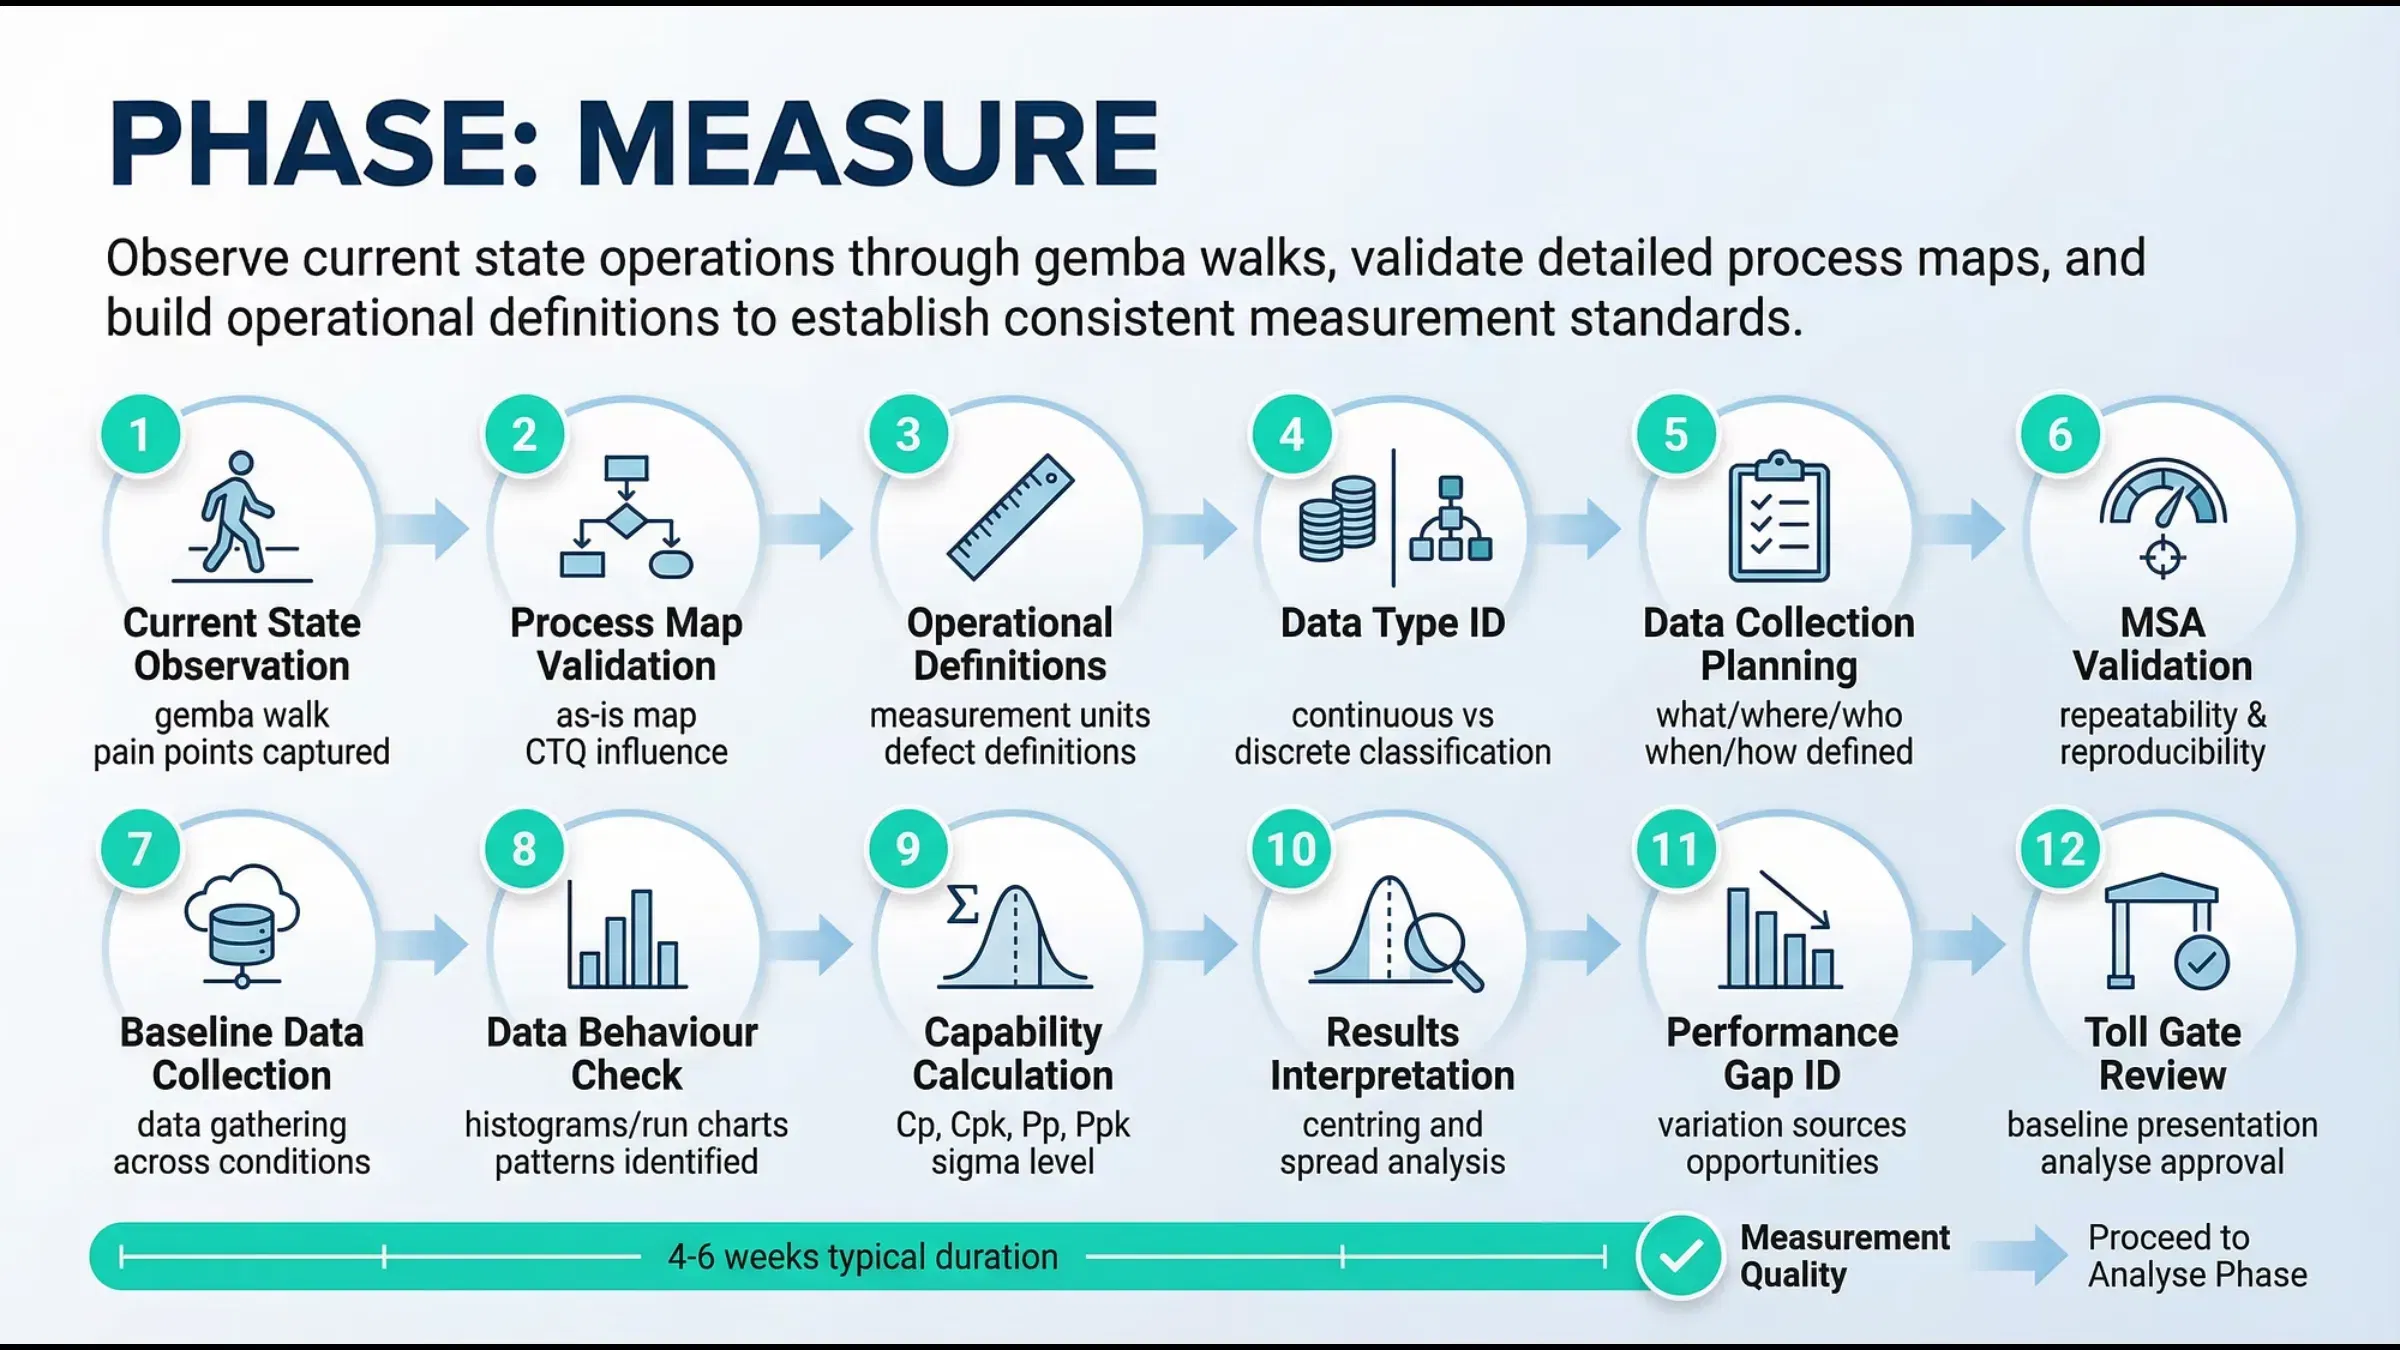
- Measure Phase: Used to establish the baseline "Voice of the Process." Before you can improve a process, you must know its current defect rate.
- Analyze Phase: Used to verify if improvements have actually shifted the mean proportion of defects.
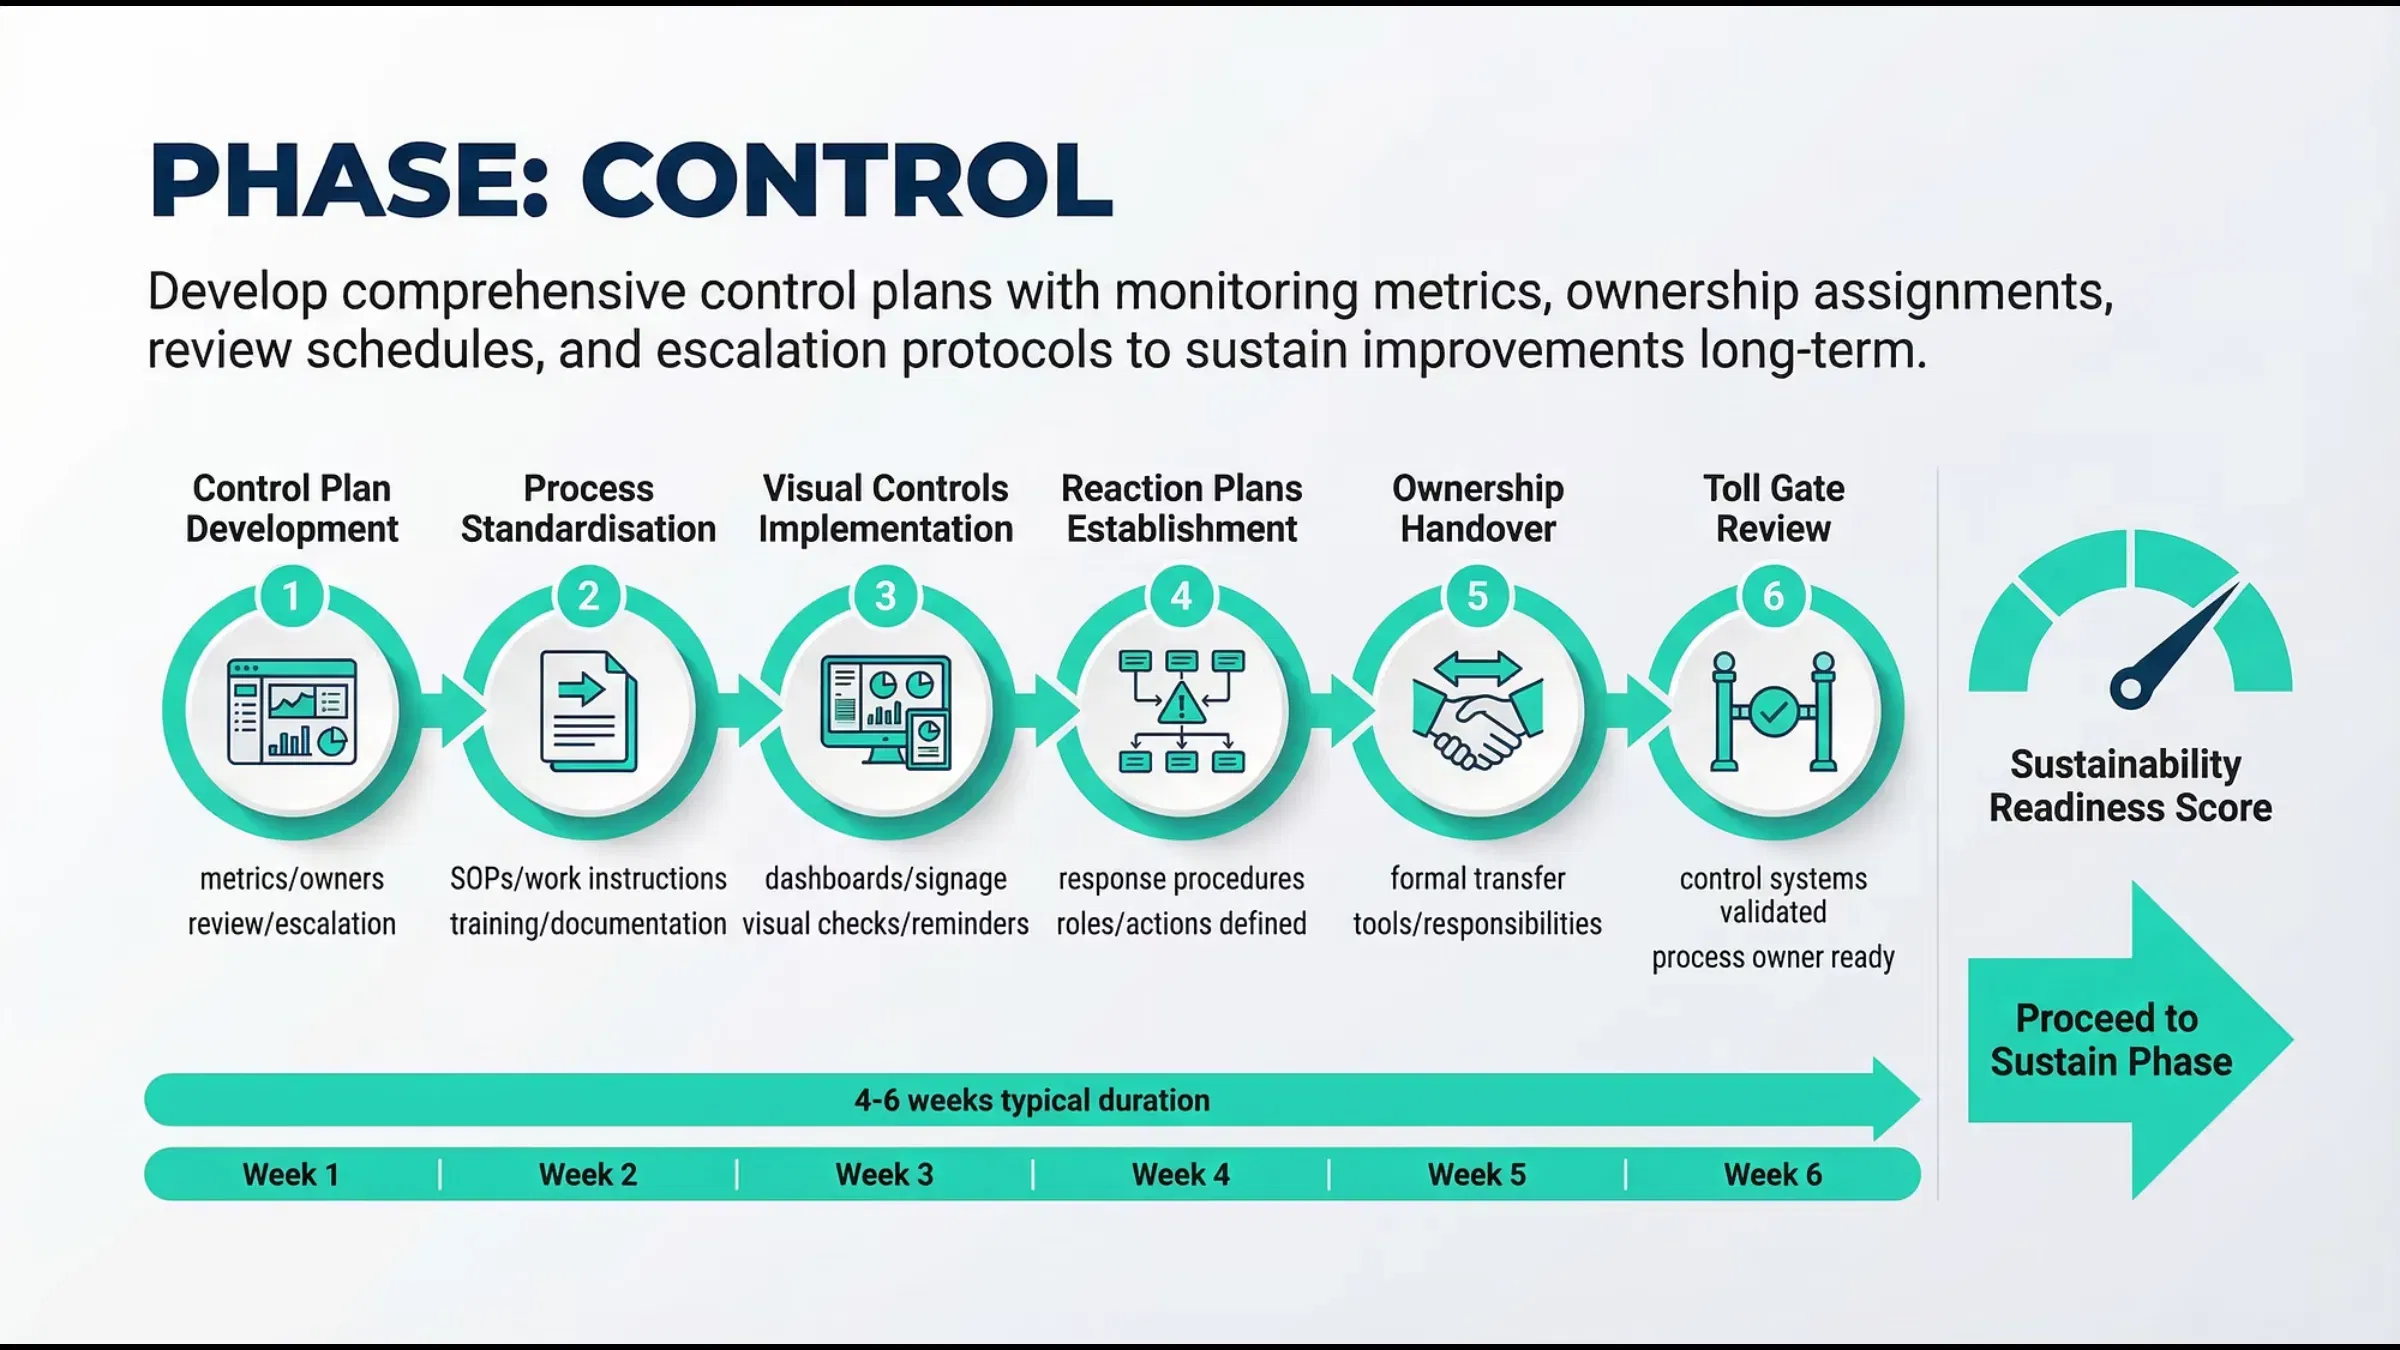
- Control Phase: This is where the P Chart shines. It acts as an early warning system. By monitoring the P Chart daily, process owners can ensure that improvements are sustained and that the process does not revert to its previous state.
Conclusion: Mastering the Voice of Your Process
Understanding what is a p chart provides more than just a statistical metric; it provides a narrative of how your business operates. By listening to the voice of process, organizations can move away from reactive "firefighting" and toward proactive, data-driven management. Whether you are tracking manufacturing defects, software bugs, or administrative errors, the P Chart is your window into stability and capability.
To effectively implement these tools in your organization, professional training is paramount. At Lean 6 Sigma Hub, we provide the comprehensive resources and certifications needed to turn data into actionable intelligence.
If you are ready to master the tools of Statistical Process Control and elevate your career, explore our certification programs today:


