

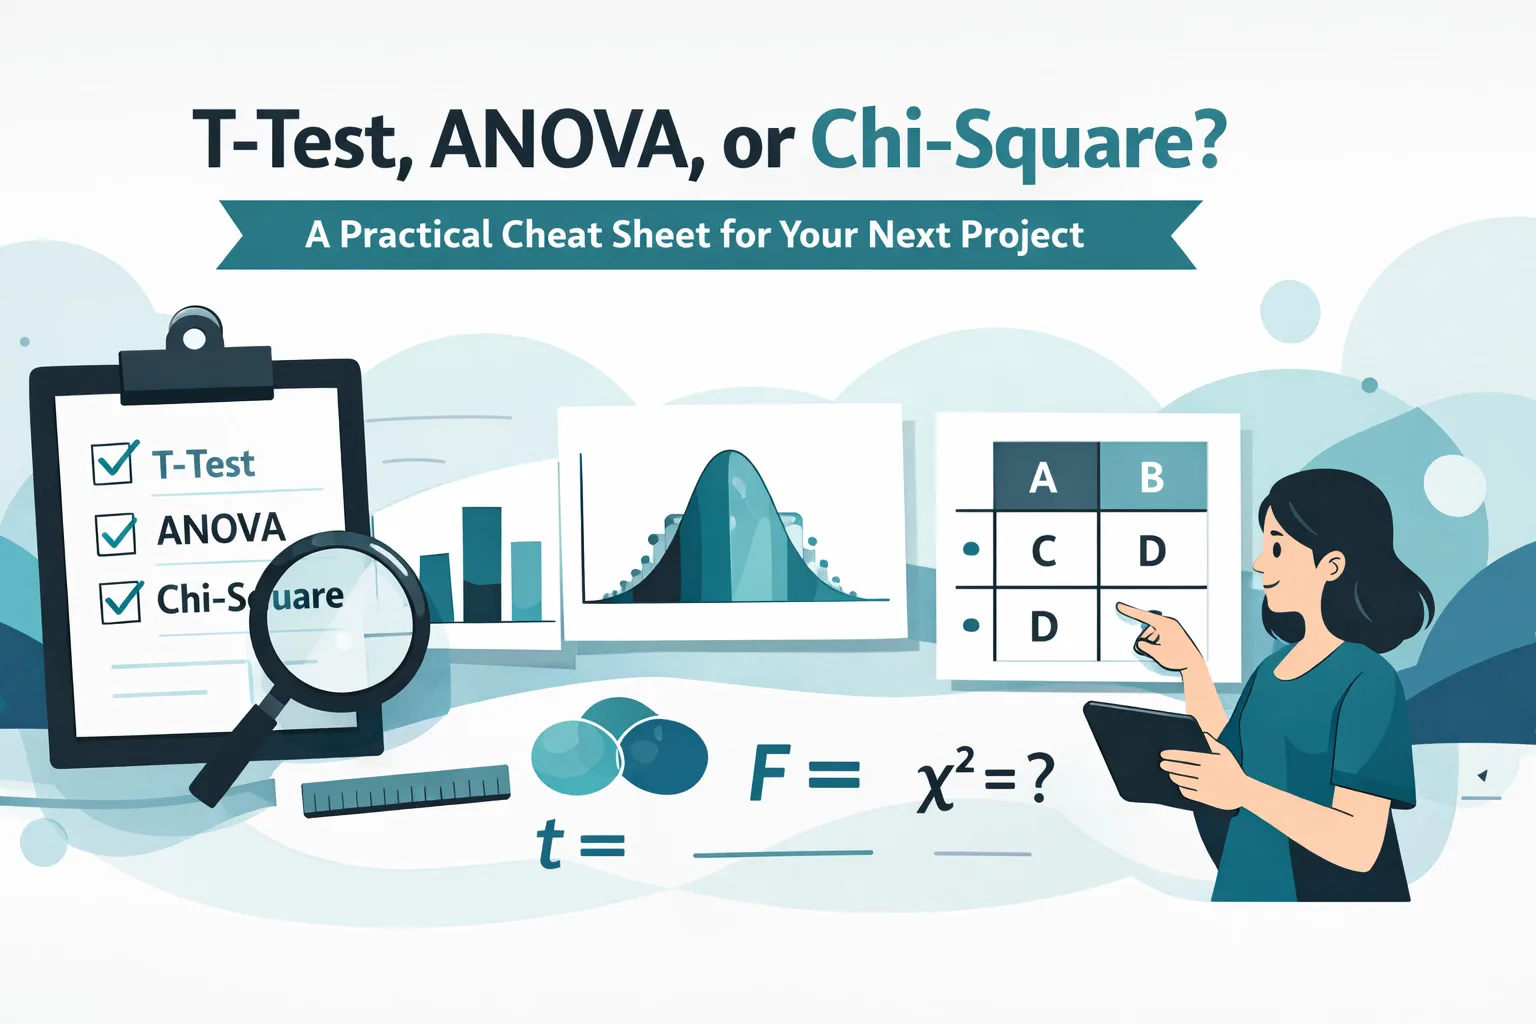
In the realm of operational excellence, the transition from the Measure phase to the Analyze phase represents a critical juncture in any DMAIC (Define, Measure, Analyze, Improve, Control) project. It is the moment where practitioners must move beyond mere observation and begin the rigorous process of root cause validation. The fundamental purpose of hypothesis testing within the Six Sigma framework is to provide a mathematical "filter" that separates true process signals from random environmental noise.
For many professionals undergoing six sigma training, the statistical component can appear daunting. However, the efficacy of a Green or Black Belt lies not in their ability to perform manual calculus, but in their capacity to select the correct statistical tool for a specific business problem. Whether you are investigating bottleneck identification or validating a new supplier's performance, understanding the distinction between a T-Test, ANOVA, and Chi-Square is essential for data-driven decision-making.
The Foundation: Data Types and the Null Hypothesis
Before selecting a test, one must first categorize the data being analyzed. In Six Sigma, we generally deal with two types of data:
- Continuous Data (Variable): Data that can be measured on an infinitely divisible scale, such as time, weight, temperature, or distance.
- Attribute Data (Categorical): Data that falls into discrete categories, such as Pass/Fail, Type A/Type B, or shifts (Morning, Afternoon, Night).
Every hypothesis test begins with the Null Hypothesis (H0), which posits that there is no significant difference or relationship between the variables. The goal of the statistical test is to determine if the evidence is strong enough to reject the Null Hypothesis in favor of the Alternative Hypothesis (Ha).

1. The T-Test: Comparing Two Means
The T-Test is the primary tool used when a practitioner needs to compare the means of two distinct groups to determine if a difference is statistically significant. In the context of six sigma training, the T-Test is often used during the Analyze phase success criteria to validate if a specific factor is indeed a root cause.
When to Use a T-Test:
- Data Type: The Y (Output) is Continuous, and the X (Input) is Categorical (with exactly two levels).
- Business Scenario: You want to know if the average lead time from Supplier A is significantly different from Supplier B.
- Example: A logistics manager suspects that the "Express" shipping route is not actually faster than the "Standard" route. By collecting cycle time data for 50 shipments from each and performing a Two-Sample T-Test, the manager can prove or disprove this suspicion with a defined level of confidence.
To fully appreciate the utility of the T-Test, one must consider its variations:
- One-Sample T-Test: Compares the mean of a single group against a known standard or target.
- Two-Sample T-Test: Compares the means of two independent groups.
- Paired T-Test: Compares means from the same group at different times (e.g., Before vs. After an improvement).
2. ANOVA: Analysis of Variance
When the business problem involves comparing more than two groups, the T-Test becomes insufficient. This is where anova vs t-test six sigma discussions typically begin. While one could theoretically run multiple T-Tests to compare three or more groups, doing so increases the "Type I Error" rate: the risk of finding a "false positive" significance where none exists.
When to Use ANOVA:
- Data Type: The Y (Output) is Continuous, and the X (Input) is Categorical (with three or more levels).
- Business Scenario: You are comparing the average defect rates across four different manufacturing shifts.
- Example: A financial institution is analyzing banking compliance and wants to see if the time taken to process regulatory reports differs across five regional branches. Using a One-Way ANOVA, the team can determine if at least one branch’s mean performance is statistically different from the others.

3. Chi-Square: Testing Categorical Relationships
Unlike the T-Test and ANOVA, which focus on means of continuous data, the Chi-Square test is designed for attribute data. It evaluates the relationship between two categorical variables by comparing the observed frequencies in each category to the frequencies we would expect to see if there were no relationship at all.
When to Use Chi-Square:
- Data Type: Both the Y (Output) and the X (Input) are Categorical.
- Business Scenario: You want to determine if the type of error made in an insurance claim (Type A, B, or C) is related to the department that processed it (Claims vs. Underwriting).
- Example: In a project focused on rework and scrap rates, a team might use a Chi-Square Test of Independence to see if the "Pass/Fail" rate of a product is dependent on the machine used during production. If the p-value is less than 0.05, it indicates a significant correlation between the machine and the quality outcome.

The Practical Decision Cheat Sheet
To streamline your next project, utilize this decision matrix to select the appropriate test based on your data types and project goals.
| If your Y (Output) is… | And your X (Input) is… | Use this Statistical Test |
|---|---|---|
| Continuous (e.g., Time) | Categorical (2 Groups) | T-Test |
| Continuous (e.g., Weight) | Categorical (3+ Groups) | ANOVA |
| Categorical (e.g., Pass/Fail) | Categorical (2+ Groups) | Chi-Square |
| Continuous | Continuous | Regression / Correlation |
Interpreting the Results: The P-Value
Regardless of the test chosen, the output will yield a p-value. In the context of professional Lean Six Sigma projects, the p-value is the probability that the observed difference occurred by pure chance.
- P < 0.05: We reject the Null Hypothesis. There is a statistically significant difference. You have found a likely root cause or a validated improvement.
- P > 0.05: We fail to reject the Null Hypothesis. Any observed difference is likely due to random variation. You should look elsewhere for your root cause.
For instance, when conducting a pilot study, a p-value of 0.02 provides the statistical confidence needed to justify a full-scale rollout of a new process.
Moving Beyond Theory: Hands-On Simulations
At Lean 6 Sigma Hub, we recognize that reading about statistical tests is vastly different from applying them under the pressure of a real-world project. To bridge this gap, our six sigma training programs feature hands-on simulations. These simulations allow students to generate their own data in controlled environments: such as a virtual manufacturing line or a service desk: and then use T-Tests, ANOVA, and Chi-Square to solve simulated process failures.
This practical approach ensures that when you return to your organization, you aren't just reciting definitions; you are confidently executing the Analyze phase with precision.

Conclusion
Hypothesis testing is the cornerstone of the Lean Six Sigma methodology. It prevents organizations from wasting resources on "solutions" that address symptoms rather than causes. By mastering the T-Test for dual-group comparisons, ANOVA for multi-group analysis, and Chi-Square for categorical data, you position yourself as a data-driven leader capable of delivering measurable financial impact.
The ability to translate complex data into actionable business intelligence is what distinguishes a certified professional from a standard manager. As processes become more complex and data-rich, the demand for these analytical skills will only continue to rise.
Take the next step in your professional journey and master these tools through our CSSC-accredited programs. Enrol in a Lean Six Sigma Green Belt or Black Belt certification course today to gain access to our exclusive project templates and hands-on statistical simulations.





