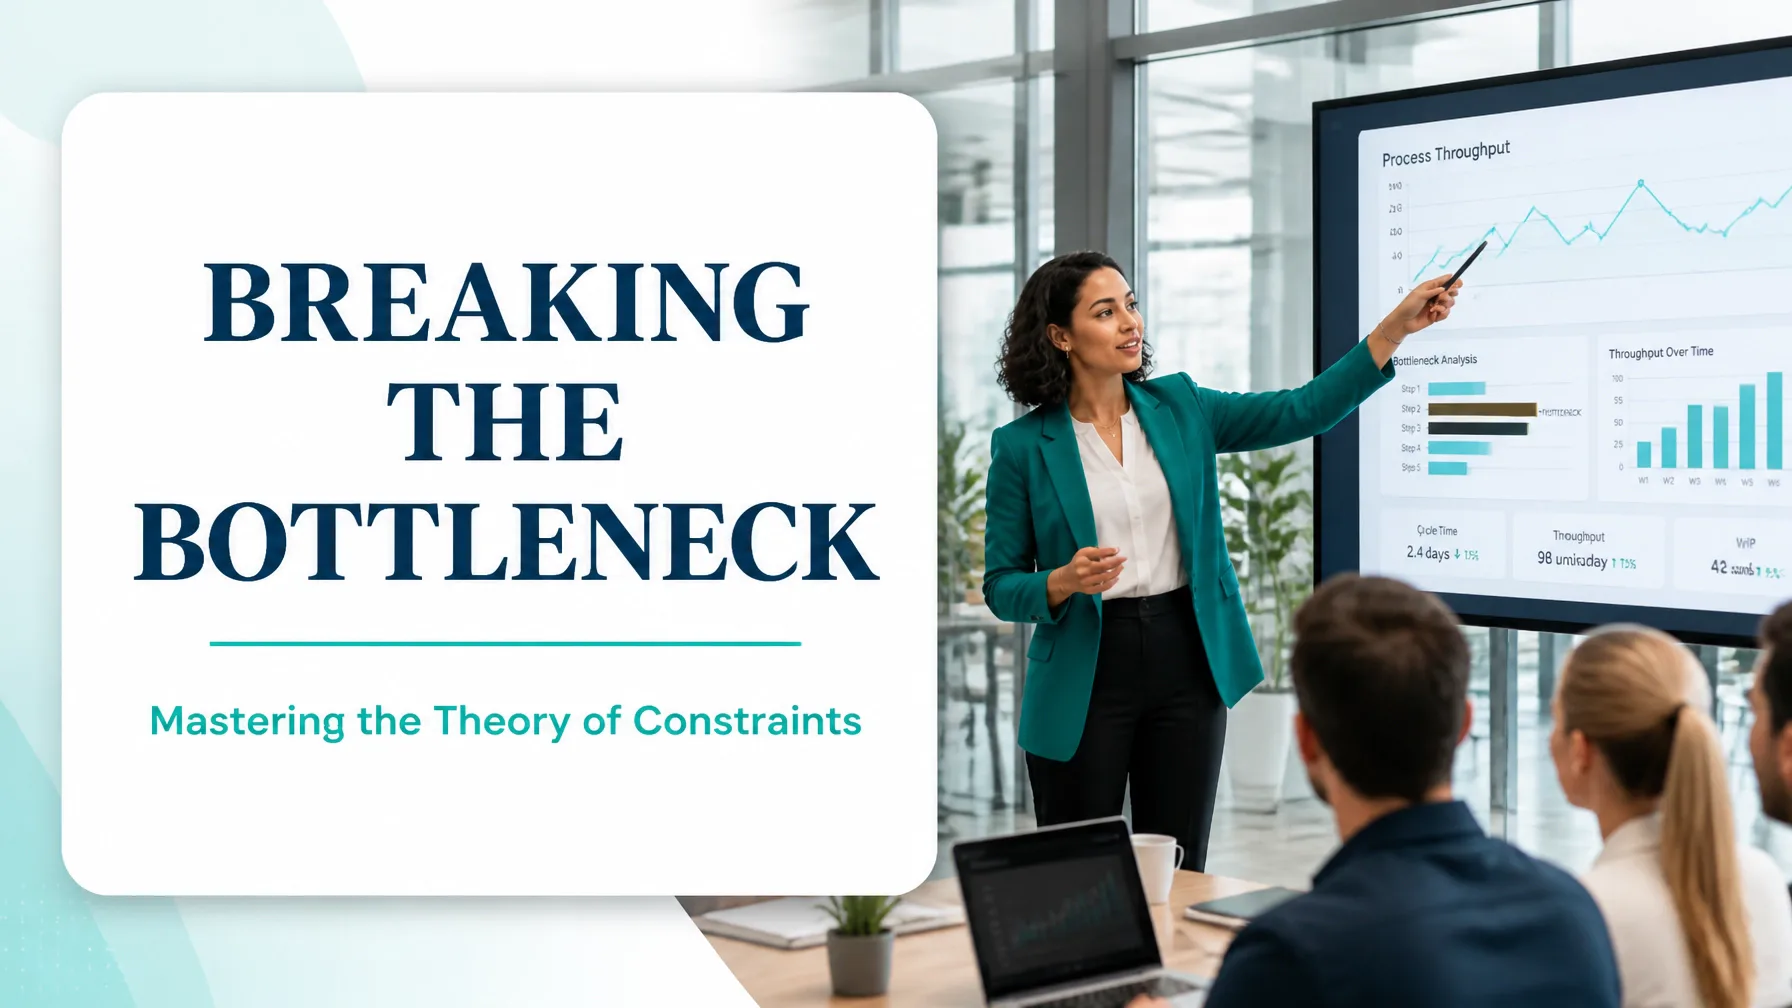
In the realm of operational excellence, organisations often try to improve every department, machine, or team at once. That approach appears balanced, but it can dilute investment and produce limited business results.
The more powerful question is: Which single constraint is limiting the performance of the entire system?
That constraint is the bottleneck. It may be a machine, approval point, employee capability, software system, supplier, or policy. Whatever its form, the bottleneck restricts the flow of work through the wider process. Improving other steps may increase local efficiency, but it will not necessarily increase the organisation’s overall output.
The fundamental purpose of bottleneck analysis is to locate the constrained step, understand why it limits flow, and increase the throughput of the complete value stream.
What Is a Bottleneck?
A bottleneck is a process step whose available capacity is lower than the demand placed upon it. It becomes the narrowest point in the process and limits the maximum output of every connected step.
Consider a three-stage process:
- Step A can process 12 units per hour
- Step B can process 8 units per hour
- Step C can process 15 units per hour
Even though Steps A and C have higher capacity, the entire process can sustainably produce only 8 units per hour. Step B sets the pace for everyone.
This is why increasing Step A from 12 to 15 units per hour does not improve total throughput. It simply creates more work waiting for Step B.
Bottlenecks are not restricted to manufacturing. Examples include:
- A hospital diagnostic department with limited imaging capacity
- A logistics hub with insufficient loading dock availability
- A finance team with one specialist approving every transaction
- An IT service desk waiting for a small infrastructure team
- A customer onboarding process delayed by compliance reviews
In each case, the constrained step determines how quickly value can reach the customer.

Bottleneck, Throughput and Capacity: The Essential Relationship
Throughput is the rate at which a process produces completed, usable output during a defined period. It may be measured in units per hour, applications per day, patients per week, or completed service requests per month.
The central relationship is straightforward:
System throughput cannot sustainably exceed the capacity of its bottleneck.
If a process has four steps with capacities of 20, 18, 11, and 24 units per hour, the maximum theoretical throughput is 11 units per hour. The 11-unit step is the constraint.
This distinction is important because local utilisation can be misleading. A non-bottleneck may be operating at 95% utilisation while the bottleneck is operating at 100%. Improving the non-bottleneck may have no effect on customer delivery, revenue, or lead time.
A bottleneck typically creates several visible symptoms:
- Work in Process (WIP) accumulates before the constrained step
- People or equipment downstream experience waiting
- Upstream teams may remain busy producing output that cannot move forward
- Lead times increase even when individual tasks appear efficient
- Overtime and expediting concentrate around one process step
- Customer delivery performance becomes constrained by one resource
The presence of WIP is not automatically proof of a bottleneck. However, persistent WIP accumulation, combined with high utilisation and downstream starvation, is strong evidence that the process requires further investigation.
How the Value Stream Reveals the Constraint
A value stream includes every step required to deliver a product or service from the initial request through to the customer. It includes both the physical movement of materials and the flow of information, decisions, approvals, and data.
To fully appreciate the impact of a bottleneck, analyse the entire value stream rather than one department in isolation.
A practical review should include:
- Map each process step from start to finish.
- Record available capacity and actual cycle time.
- Measure queue size and waiting time between steps.
- Compare process capacity with customer demand.
- Identify where WIP accumulates consistently.
- Confirm the suspected bottleneck through direct observation and data.
A value stream view prevents a common error: optimising a department that is not limiting the overall result.
For example, a warehouse may invest in faster picking equipment. If orders then wait three days for a constrained dispatch inspection, picking speed has not improved customer lead time. The constraint has simply moved downstream more visibly.
The Theory of Constraints: A Focused Improvement Method
The Theory of Constraints (TOC) provides a disciplined way to manage bottlenecks. It focuses improvement effort on the factor that most limits system performance.
The five focusing steps are:
1. Identify the constraint
Use process maps, capacity data, queue analysis, time observations, and frontline knowledge to locate the step that restricts throughput.
2. Exploit the constraint
Maximise the existing capacity before making major investments. This may involve:
- Reducing avoidable downtime
- Improving work instructions
- Ensuring the bottleneck receives complete, high-quality inputs
- Scheduling maintenance outside critical operating periods
- Removing unnecessary interruptions
- Assigning appropriately trained personnel
3. Subordinate everything else
Synchronise non-bottleneck activities to the pace of the constraint. Producing faster than the bottleneck can process creates excess WIP, storage requirements, handling, and waiting.
Subordination may require a non-bottleneck resource to operate below full utilisation. That is not a failure. It is often the correct system-level decision.
4. Elevate the constraint
If the constraint still cannot meet demand after exploitation and subordination, add capacity. Options may include:
- Additional staffing or shifts
- Improved tooling or equipment
- Automation
- Redesigning work allocation
- Outsourcing selected activities
- Removing a policy or approval restriction
5. Repeat the cycle
Once one bottleneck is relieved, another step may become the new constraint. Continuous improvement therefore requires the organisation to return to the first step and reassess the value stream.

Worked Example: Lifting Throughput by Improving the Bottleneck
Consider a hypothetical medical device component process operating for eight productive hours per day.
| Process step | Capacity per hour | Daily capacity |
|---|---|---|
| Step A: Preparation | 12 units | 96 units |
| Step B: Assembly | 8 units | 64 units |
| Step C: Inspection and packing | 15 units | 120 units |
Customer demand is 90 units per day, but the process can ship only 64 units per day because Step B is the bottleneck.
Assume each completed unit generates a contribution of $60.
Baseline performance
- Daily throughput: 64 units
- Daily contribution: 64 × $60 = $3,840
- Unmet daily demand: 90 − 64 = 26 units
- Annual opportunity at 250 working days: 26 × 250 = 6,500 units
Step A can produce 96 units per day, so releasing work at its full capacity creates a queue before Step B. If Step B processes 64 units while Step A releases 96, WIP increases by approximately 32 units per day, assuming no other controls are applied.
Exploit the bottleneck
The team reviews changeovers, work instructions, minor stoppages, and material presentation at Step B. Without purchasing equipment, it increases effective capacity by 15%:
- New Step B capacity: 8 × 1.15 = 9.2 units per hour
- New daily capacity: 9.2 × 8 = 73.6 units
- Practical throughput: approximately 73 units per day
The improvement adds approximately 9 units per day, or 2,250 units annually.
At $60 contribution per unit, the annual benefit is:
- 2,250 × $60 = $135,000
If the improvement costs $12,000 in training, setup, and process redesign, the simple payback is approximately:
- $12,000 ÷ ($135,000 ÷ 250) = 22 working days
Elevate the bottleneck
Demand remains higher than the improved capacity, so leadership invests $48,000 in specialised tooling and an additional operating arrangement. Step B capacity increases to 12 units per hour, matching Step A’s 96-unit daily capacity.
The process can now support up to 96 units per day, although customer demand initially limits shipments to 90 units.
Compared with the baseline, the organisation can deliver:
- Additional customer shipments: 90 − 64 = 26 units per day
- Daily contribution increase: 26 × $60 = $1,560
- Additional operating cost: $250 per day
- Net daily benefit: $1,560 − $250 = $1,310
- Annual net benefit: $1,310 × 250 = $327,500
The $48,000 elevation investment has a simple payback of approximately:
- $48,000 ÷ $1,310 = 37 working days
This example demonstrates why bottleneck-focused improvement can produce a superior return on investment. The organisation does not need to improve every step equally. It needs to increase the capacity of the step that controls system throughput.
Managing Waiting and Work in Process
When a bottleneck is not actively managed, waiting becomes embedded in the value stream. Materials wait for processing, employees wait for information, and customers wait for completion.
Excess Work in Process also creates several financial and operational consequences:
- Capital is tied up before revenue is realised
- Items require additional storage and handling
- Defects may remain hidden inside large batches
- Priorities become difficult to see
- Lead times become longer and less predictable
- Upstream teams produce output that customers cannot yet receive
A practical control method is to release work according to the bottleneck’s demonstrated capacity, not according to the maximum speed of every upstream process. This keeps WIP visible and protects the constraint from starvation without flooding it with excess work.
Use measures such as:
- Throughput per day or week
- WIP before and after the constraint
- Waiting time between process steps
- Bottleneck utilisation
- Customer lead time
- On-time delivery
- Cost per completed unit
Build Bottleneck Thinking into Your Improvement Capability
Bottleneck management is a core capability for professionals responsible for operational performance, process improvement, and financial results.
A Lean Six Sigma Green Belt course helps practitioners apply structured analysis, process mapping, measurement, and improvement methods to medium- and large-scale projects. For leaders managing complex, cross-functional constraints, Black Belt training develops the advanced statistical and project leadership skills required to deliver sustainable change.
You can also explore the Lean Six Sigma glossary and use the Business Case Financial Calculator to quantify the financial impact of a proposed bottleneck intervention.
Do not optimise blindly. Identify your constraint, protect its capacity, and improve the step that sets the speed for the entire value stream. Pursue CSSC-accredited Lean Six Sigma training and certification to build the capability to deliver measurable process and ROI improvements.
Kaizen. Kai-Care. Kai-Done. ( Lean Six Sigma)