In the realm of industrial manufacturing and process optimization, few metrics command as much authority as Overall Equipment Effectiveness (OEE). While many organizations focus on siloed data points like labor costs or raw material waste, the truly elite performers recognize that OEE is the gold standard for measuring manufacturing productivity. OEE is not merely a number on a dashboard; it is a strategic instrument that exposes the gap between potential and actual performance.
The fundamental purpose of tracking OEE is to identify the "hidden factory": the capacity that exists but is lost to inefficiencies. By dissecting production into tangible components, leadership can pivot from reactive troubleshooting to proactive value creation. To fully appreciate the impact of this metric, one must understand how it serves as a direct bridge between shop-floor mechanics and the corporate bottom line.
The Technical Pillars of OEE
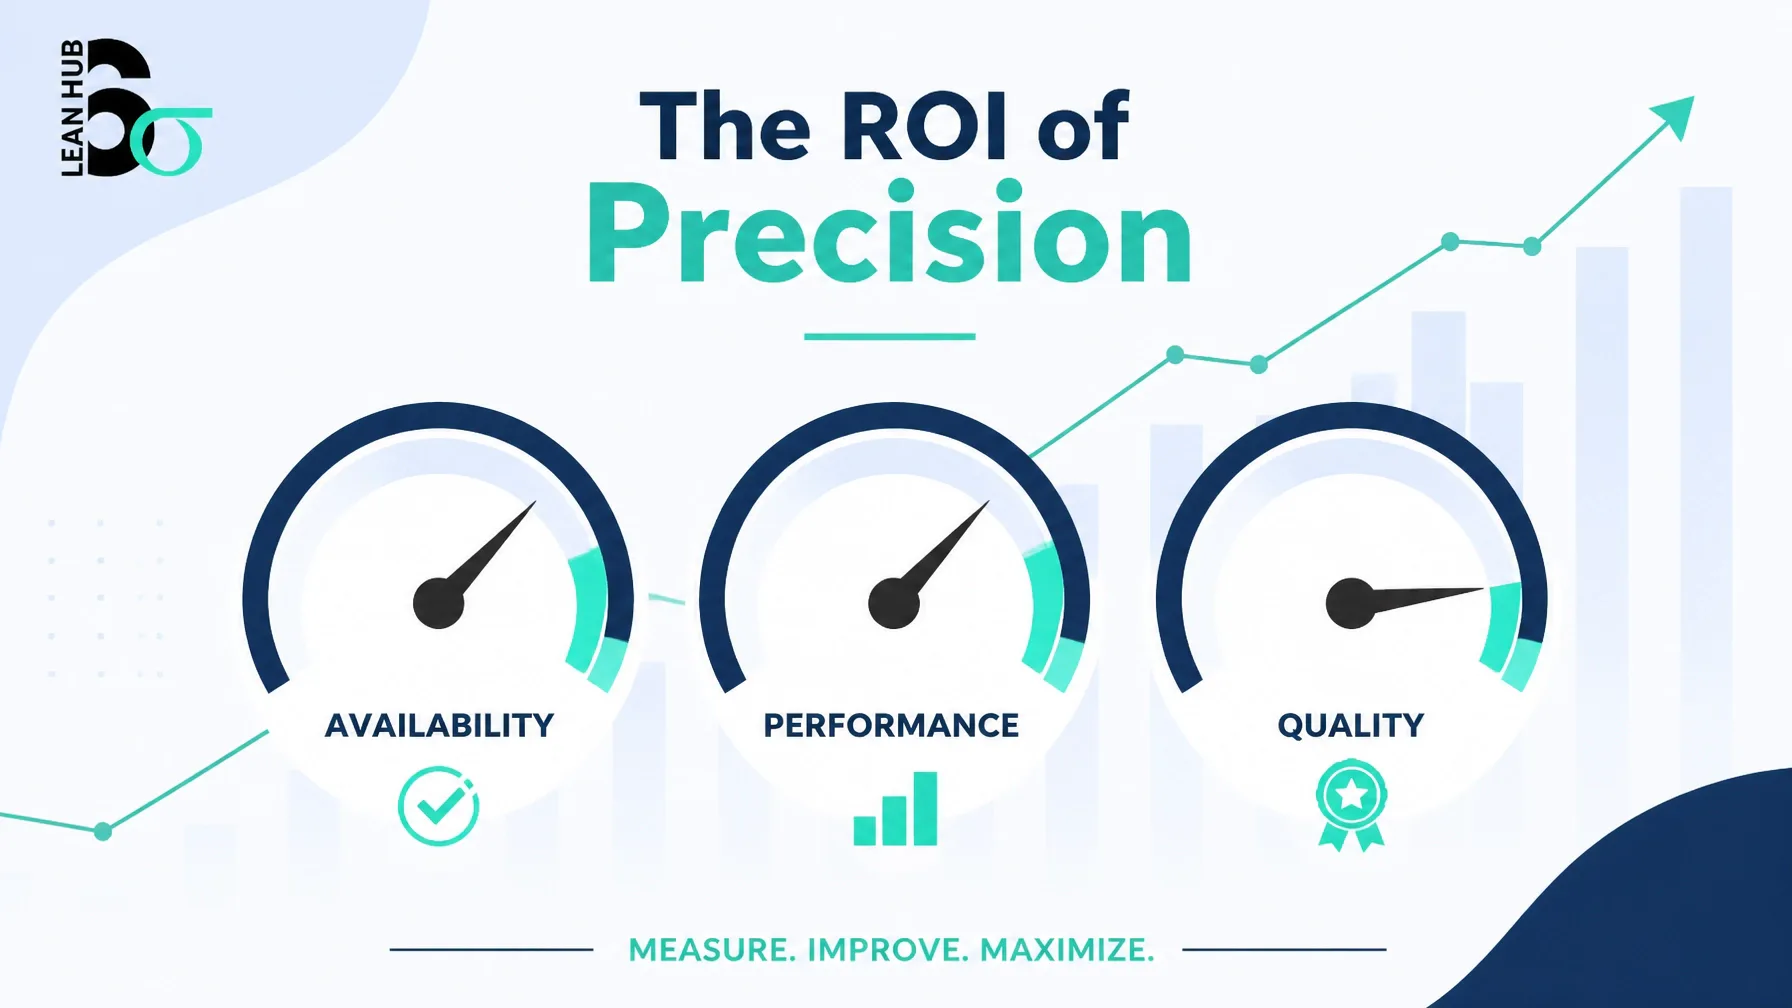
To calculate OEE, we must evaluate three primary components: Availability, Performance, and Quality. Each of these factors represents a distinct dimension of operational health. When multiplied together, they provide a comprehensive percentage that reflects the true efficiency of a machine or production line.

1. Availability
Availability accounts for Planned and Unplanned Downtime. It is the ratio of Run Time to Planned Production Time. In high-precision environments, Availability losses often stem from equipment failures, unplanned maintenance, or protracted changeovers. For instance, if a machine is scheduled to run for 8 hours but experiences 90 minutes of downtime due to a mechanical breakdown, its Availability score is significantly compromised.
2. Performance
Performance measures speed loss. It is the ratio of Net Run Time to Run Time. Even if a machine is running, it may not be operating at its Ideal Cycle Time. Factors such as equipment wear, substandard materials, or inefficient operator handling can cause "minor stops" and "reduced speed," which erode the Performance metric. This represents the silent thief of productivity, as the machine appears active while delivering less than its theoretical maximum output.
3. Quality
Quality focuses on yield. It is the ratio of Fully Productive Time (good parts) to Net Run Time (total parts). Any unit that requires rework or is discarded as scrap represents a Quality loss. For a deeper understanding of how these metrics interface with broader process excellence, professionals often refer to Measure Phase concepts like First Pass Yield.
The Six Big Losses: Identifying the Enemy
To maximize the ROI of Precision, practitioners must look beyond the three pillars and attack the Six Big Losses. These categories provide a granular roadmap for improvement by categorizing precisely where time and value are being dissipated.

- Unplanned Stops: These include equipment failures and breakdowns that halt production entirely.
- Planned Stops: While necessary, setup and adjustment times (changeovers) often represent a significant portion of lost Availability.
- Small Stops: Frequent, short-duration interruptions (idling and minor stops) that collectively degrade Performance.
- Slow Cycles: Operating equipment below its nameplate capacity, often due to aging machinery or environmental factors.
- Production Rejects: Defects produced during steady-state production that fail to meet quality standards.
- Startup Rejects: Scrapped parts produced during the "warm-up" phase or after a changeover before the process stabilizes.
By systematically addressing these losses through a structured Lean Six Sigma approach, organizations can drive their OEE from mediocre levels (60-70%) toward the "World Class" benchmark of 85% or higher.
Data-Heavy Example: The ROI of a Packaging Line Bottleneck
To illustrate the financial magnitude of OEE improvements, let us examine a data-heavy case study featuring a high-speed carton packaging line. In this scenario, the packaging line is the bottleneck: the single point in the facility that limits total throughput.

The Baseline Scenario
- Operating Schedule: 4,000 hours/year (16 hours/day, 5 days/week, 50 weeks).
- Ideal Cycle Time: 3,000 units/hour.
- Profit per Unit (Contribution Margin): €0.30.
- Current Metrics:
- Availability: 80.0%
- Performance: 85.0%
- Quality: 95.0%
- Baseline OEE: 0.80 × 0.85 × 0.95 = 64.6%
In this state, the facility produces 7,752,000 good units per year, generating an annual contribution profit of €2,325,600.
The Improvement Initiative
A Lean Six Sigma Black Belt leads a project focused on reducing changeover times (SMED) and eliminating minor stops on the packaging line. After a six-month implementation phase, the metrics are recalibrated:
- Improved Availability: 90.0% (Reduced downtime)
- Improved Performance: 92.0% (Optimized speed)
- Improved Quality: 97.0% (Enhanced setup verification)
- New OEE: 0.90 × 0.92 × 0.97 = 80.3%
The Financial Outcome
The shift from 64.6% to 80.3% OEE at the bottleneck has a transformative effect on the bottom line:
- New Annual Output: 9,636,000 good units.
- Incremental Output: 1,884,000 additional units.
- Incremental Profit: 1,884,000 units × €0.30 = €565,200 per year.
If the project cost was €250,000 (including software, sensors, and training), the first-year ROI is approximately 126%, with a payback period of just 5.3 months. This demonstrates that precision in OEE measurement is not an academic exercise; it is a high-yield financial strategy.
Strategic Integration: Scaling Excellence
The real power of OEE is realized when it is integrated into a broader organizational excellence framework. By leveraging advanced statistical tools and data analysis, such as identifying outliers in production data, managers can ensure that improvements are not just temporary spikes but sustainable gains.
When you master the art of interpreting OEE, you gain the ability to justify capital expenditures, optimize labor allocation, and provide clear, data-driven reports to executive leadership. It transforms the role of a Process Analyst or Operations Manager from a supervisor of tasks to a driver of enterprise capability.
Conclusion: Take Command of Your Operational Future
OEE is the "secret weapon" because it provides absolute clarity in an environment often clouded by anecdotal evidence and "gut feelings." It quantifies the cost of inefficiency and points precisely to the remedy. However, identifying the problem is only the first half of the equation; possessing the skills to solve it is the second.
To truly weaponize OEE in your career and your organization, you must master the methodologies that drive these metrics upward. Whether you are looking to kickstart your journey or lead complex, enterprise-wide transformations, specialized training is the catalyst.
We invite you to advance your professional capability by enrolling in our CSSC-accredited training programs. Master the tools of precision and start driving significant ROI today.
- Lean Six Sigma White Belt – Build your foundation in process improvement.
- Lean Six Sigma Yellow Belt – Master essential tools for small project management.
- Lean Six Sigma Green Belt – Lead data-driven projects with confidence.
- Lean Six Sigma Black Belt – Drive organizational change and manage complex initiatives.