

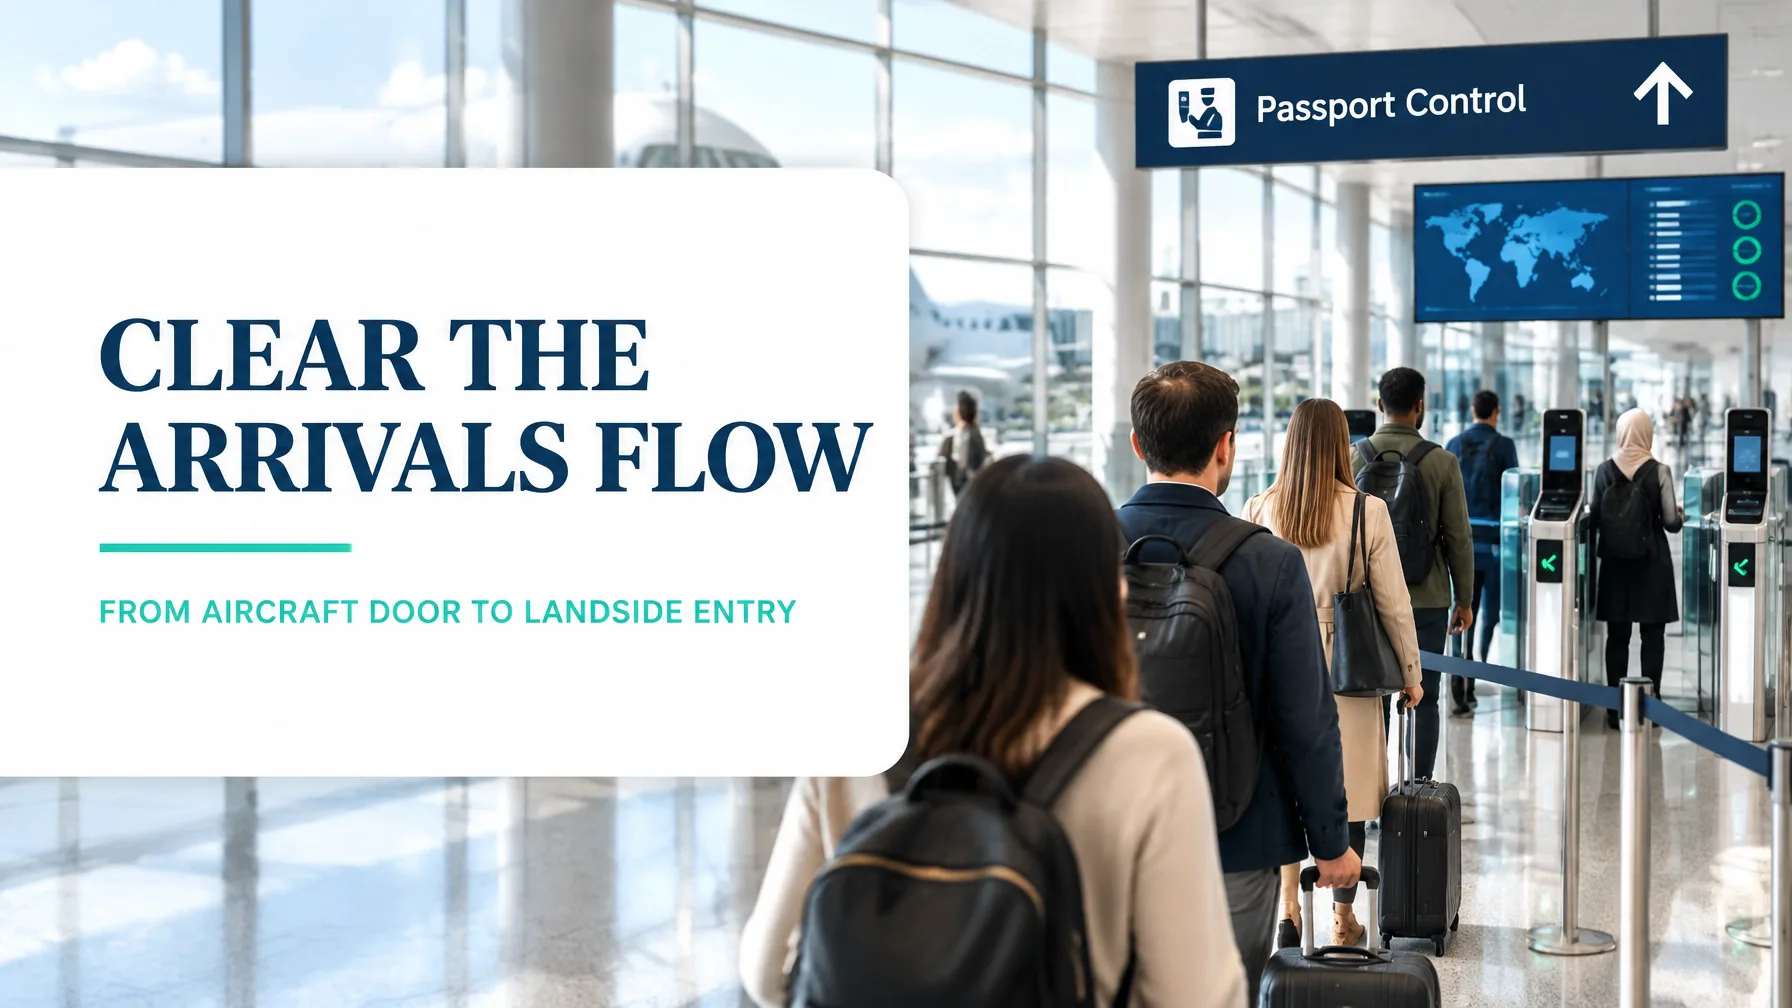
In the realm of airport operations, passengers experience arrivals as one connected journey. They do not separate aircraft disembarkation, immigration, baggage reclaim and biosecurity into independent departments. They experience the total time from the aircraft door to cleared landside entry.
That makes Value Stream Mapping (VSM) a powerful method for improving border control and immigration processing. It reveals where passengers wait, where agencies hand work to one another, where capacity is constrained and where legitimate compliance controls become surrounded by avoidable delay.
This worked case study uses an illustrative peak-hour model. The objective is not to reduce the quality of border decisions. It is to improve flow, predictability and capacity while preserving security, inspection and regulatory requirements.
Scope the Arrivals Value Stream Before Measuring It
The selected value stream begins when the aircraft door opens and ends when the passenger has completed primary processing, collected or progressed through baggage and biosecurity requirements, and entered the landside area.
Included in scope
- Aircraft door arrival and passenger disembarkation
- Passenger movement to the immigration hall
- Primary processing through automated gates and manual counters
- Secondary referral and inspection
- Baggage reclaim interaction
- Biosecurity queue and X-ray re-inspection
- Cleared landside entry
Excluded from scope
- Outbound departure and emigration processing
- Airline check-in and security screening
- Aircraft turnaround activities
- Customs investigations after landside clearance
- Long-term visa policy and border-policy design
The key Voice of the Customer (VOC) requirements are a short, predictable wait, clear instructions and fair queue management. The Voice of the Business (VOB) includes regulatory compliance, efficient use of officers, manageable operating cost and resilience during arrival banks. The Voice of the Process (VOP) is represented by queue time, processing time, referral rates, lane availability and throughput.
The IATA Level of Service framework provides a useful external reference because it considers passenger-flow performance across terminal subsystems, including immigration, baggage reclaim and customs.
The Capacity Question: Demand, Takt and Throughput
At peak demand, the airport receives 1,800 arriving passengers per hour.
There are eight primary-processing lanes available for 60 minutes each:
- 8 lanes × 60 minutes = 480 lane-minutes
- 480 lane-minutes × 60 seconds = 28,800 lane-seconds
- 28,800 seconds ÷ 1,800 passengers = 16 seconds per passenger
Therefore, the demand rhythm, or takt time, is 16 seconds per passenger.
This does not mean one officer or one gate must process every passenger in 16 seconds. It means the combined system must release one passenger into primary processing every 16 seconds to keep pace with demand. The distinction matters because automated gates currently average 42 seconds per passenger, while manual counters average 96 seconds. The process therefore depends on parallel capacity, passenger eligibility, reliable lane availability and controlled arrival waves.
A further challenge is demand variation: 12% of passengers arrive in waves exceeding 300 people from a single wide-body bank. Average hourly demand can therefore appear manageable while short arrival bursts overwhelm the immigration hall.
Current-State Map: From Aircraft Door to Landside Entry

The illustrative current-state map is:
Aircraft door opens
   ↓ 6.5 minutes
Disembarkation and walk to immigration hall
   ↓ 11.2-minute average queue
Primary immigration processing
   ├─ Automated gate: 42 seconds
   └─ Manual counter: 96 seconds
   ↓ 3.1% referred
Secondary inspection: 14.5 minutes average
   ↓
Baggage reclaim: 9.8-minute average wait
   ↓
Biosecurity queue: 4.3 minutes
   └─ 2.4% X-ray re-inspection
   ↓
Cleared landside entry
The current performance baseline is:
- Peak demand: 1,800 passengers per hour
- Primary lane availability: 86%
- Primary queue wait: 11.2 minutes average, reaching 24 minutes during peaks
- Secondary referral rate: 3.1%
- Secondary inspection time: 14.5 minutes average
- Baggage reclaim wait: 9.8 minutes
- Biosecurity queue: 4.3 minutes
- Biosecurity X-ray re-inspection: 2.4%
- Gate-to-landside average: 27.4 minutes
- Gate-to-landside 78th percentile: 41 minutes
- Value-added processing time: 51 seconds
- Flow efficiency: under 4%
The stage averages do not add directly to the 27.4-minute end-to-end average because some baggage and biosecurity activity overlaps with immigration processing. This is an important VSM lesson: do not add every local average without checking the timestamps and parallel paths.
The value-added time is only 51 seconds. Using the average end-to-end time:
[
\text{Flow efficiency} = \frac{51\text{ seconds}}{27.4 \times 60\text{ seconds}} \times 100
]
This produces approximately 3.1%, consistent with the measured result of under 4%. Most of the passenger journey is therefore waiting, movement, queue exposure or inspection-related delay rather than direct processing.
The Eight DOWNTIME Wastes in Arrivals Processing
The DOWNTIME framework provides a structured way to identify waste without dismissing necessary controls.
- Defects: Incomplete passenger information, unreadable documents or failed biometric attempts create avoidable referrals and rework.
- Overproduction: Repeated status checks, duplicate queue reports and unnecessary manual reviews consume capacity without moving passengers closer to clearance.
- Waiting: Passengers wait before primary processing, during secondary referral, at baggage reclaim and before biosecurity inspection.
- Non-utilised talent: Skilled officers may be unavailable while queues build because rostering and lane deployment do not respond to actual arrival waves.
- Transportation: Passengers are directed between lanes, counters, referral points and inspection areas when signage or eligibility information is unclear.
- Inventory: Waiting passengers become work in process. Bags awaiting reclaim and referral cases awaiting officers are also forms of operational inventory.
- Motion: Passengers change lanes or walk unnecessary distances; staff move between workstations to manage avoidable exceptions.
- Extra-processing: Data may be checked repeatedly, passengers may be redirected after reaching an unsuitable lane, and X-ray re-inspection may occur when upstream information or preparation is incomplete.
The principal constraint is not necessarily the physical number of gates. It is the interaction between arrival waves, lane availability, passenger segmentation and uneven flow into primary processing.
Future-State Design: Build Flow Around Demand

The future-state value stream should be designed around real arrival patterns rather than static rosters:
Airline schedule and arrival data
   ↓
Bank-by-bank demand forecast
   ↓
Passenger information before arrival
   ↓
Dynamic lane opening and visual flow board
   ↓
Standard work at automated gates
   ↓
Exception-based secondary referral
   ↓
Baggage and biosecurity coordination
   ↓
Landside entry with hourly performance control
Five changes form the core of the future state:
- Level arrival demand by bank. Use airline schedule data, aircraft capacity, estimated off-block performance and historical disembarkation profiles to forecast when passengers will reach immigration.
- Open lanes dynamically. Use a visual flow board showing arrivals by bank, queue length, lane status, referral volume and hourly throughput. This creates an Andon-style signal for operational response.
- Standardise automated-gate work. Apply standard work and single-piece pacing so passengers are presented to gates consistently, with clear preparation instructions and rapid response to failed attempts.
- Use pre-arrival information. Provide passengers with clear guidance on documents, declarations, eligibility and biosecurity requirements before they reach the hall. The aim is to reduce avoidable referrals without weakening legitimate screening.
- Manage by tiered huddles. Hold daily operational huddles, supported by hourly throughput reviews. Escalate lane, staffing, technology and arrival-bank issues at the point they emerge.
Current Versus Future Performance
The future figures below are design targets for the worked case study. They require validation through pilot data.
| Metric | Current state | Future-state target |
|---|---|---|
| Average gate-to-landside transit | 27.4 minutes | 14 minutes |
| 95th-percentile transit time | 41 minutes at the measured upper percentile baseline | Under 25 minutes |
| Average primary queue wait | 11.2 minutes | 5.5 minutes or less |
| Primary processing time | 42 sec automated; 96 sec manual | 38 sec automated; 82 sec manual |
| Secondary referral rate | 3.1% | 1.9% |
| Lane availability | 86% | Above 95% |
| Flow efficiency | Under 4% | Above 7% |
| Staffing per active lane | 0.86 FTE-equivalent roster coverage | 1.00 FTE-equivalent coverage |
The staffing measure describes roster coverage per active lane, not a recommendation to remove professional judgement or specialist roles. The future state should preserve contingency capacity for vulnerable passengers, families, accessibility needs and legitimate secondary inspection.
How VSM Links to DMAIC
VSM provides the end-to-end view; DMAIC provides the disciplined improvement structure.
- Define: Confirm the scope, customer requirements, compliance boundaries and project business case.
- Measure: Capture timestamps from aircraft arrival through landside entry. Validate queue, referral, staffing and lane-availability data.
- Analyse: Use Pareto charts, run charts, queue distributions, spaghetti diagrams and root-cause analysis to explain delay and variation.
- Improve: Test arrival levelling, dynamic lane opening, standard work and pre-arrival communication.
- Control: Monitor hourly throughput, queue percentiles, referrals, lane availability and process stability through a control plan.
The Process Cycle Efficiency Calculator can support the baseline by separating value-added processing from waiting, movement, inspection and rework.
For a multi-agency environment, a platform such as SigmaFlow VSM can support current- and future-state maps, swimlanes, handoffs and attached process data. This is particularly useful when airport operators, airlines, border agencies, baggage services and biosecurity teams must see one shared value stream rather than isolated departmental workflows. See the SigmaFlow VSM reference material for the platform’s mapping concepts.
Ninety-Day Kaizen Sequence

Days 1–30: Define and Measure
- Map one representative arrival bank in detail.
- Integrate airline schedule data with actual passenger show-up patterns.
- Confirm timestamp definitions for queues, processing and landside clearance.
- Establish the hourly throughput metric.
- Display lane status, queue length and referral volume on a visual flow board.
- Stratify delays by airline, arrival bank, passenger pathway and processing type.
Days 31–60: Improve and Pilot
- Pilot bank-by-bank arrival levelling with one or two airline partners.
- Test dynamic lane opening rules when queue or forecast thresholds are reached.
- Introduce standard work and single-piece pacing at automated gates.
- Provide pre-arrival information about documents, eligibility and biosecurity requirements.
- Trial a defined escalation path for technology failures, staffing gaps and sudden arrival waves.
Days 61–90: Control and Scale
- Expand successful lane and information practices across arrival banks.
- Hold daily tiered huddles with an hourly throughput review.
- Track average and 95th-percentile transit time, not only averages.
- Create control limits for secondary referrals, lane availability and biosecurity re-inspection.
- Assign process ownership across airport, border, airline, baggage and biosecurity stakeholders.
- Review benefits against the future-state targets and update the control plan.
Build the Capability to Improve Complex Service Flows
Airport arrivals are a high-stakes service value stream involving safety, regulation, technology, people and fluctuating demand. Effective improvement requires more than a diagram. Teams need the ability to collect reliable data, identify root causes, manage variation and lead cross-agency change.
Lean 6 Sigma Hub’s online training programmes provide practical, self-paced learning across White Belt, Yellow Belt, Green Belt and Black Belt levels. The courses are CSSC-accredited and use case studies, worked examples, process maps and improvement tools.
Pursue Lean Six Sigma certification to learn how to map complex value streams, reduce waiting and lead measurable improvements across airport and border-control operations.
Kaizen. Kai-Care. Kai-Done. Lean Six Sigma.





