

1. Why value stream mapping matters in a commercial bakery
In a commercial bakery, a line can be busy at every station and still deliver too few loaves on time. The reason is often the flow between stations: dough waits for proofing capacity, baked loaves accumulate on a cooling conveyor, or wrapping runs out of product after a brief stoppage.
Value stream mapping (VSM) makes the full journey visible. It documents both material and information flow, from order and ingredient release through mixing, dividing, moulding, proofing, baking, cooling, slicing, wrapping and dispatch. A current-state map captures what happens now; a future-state map describes how work should flow to meet customer demand with less waiting and inventory. The Lean Enterprise Institute’s VSM overview describes the method as mapping the steps needed to bring a product from order to delivery.
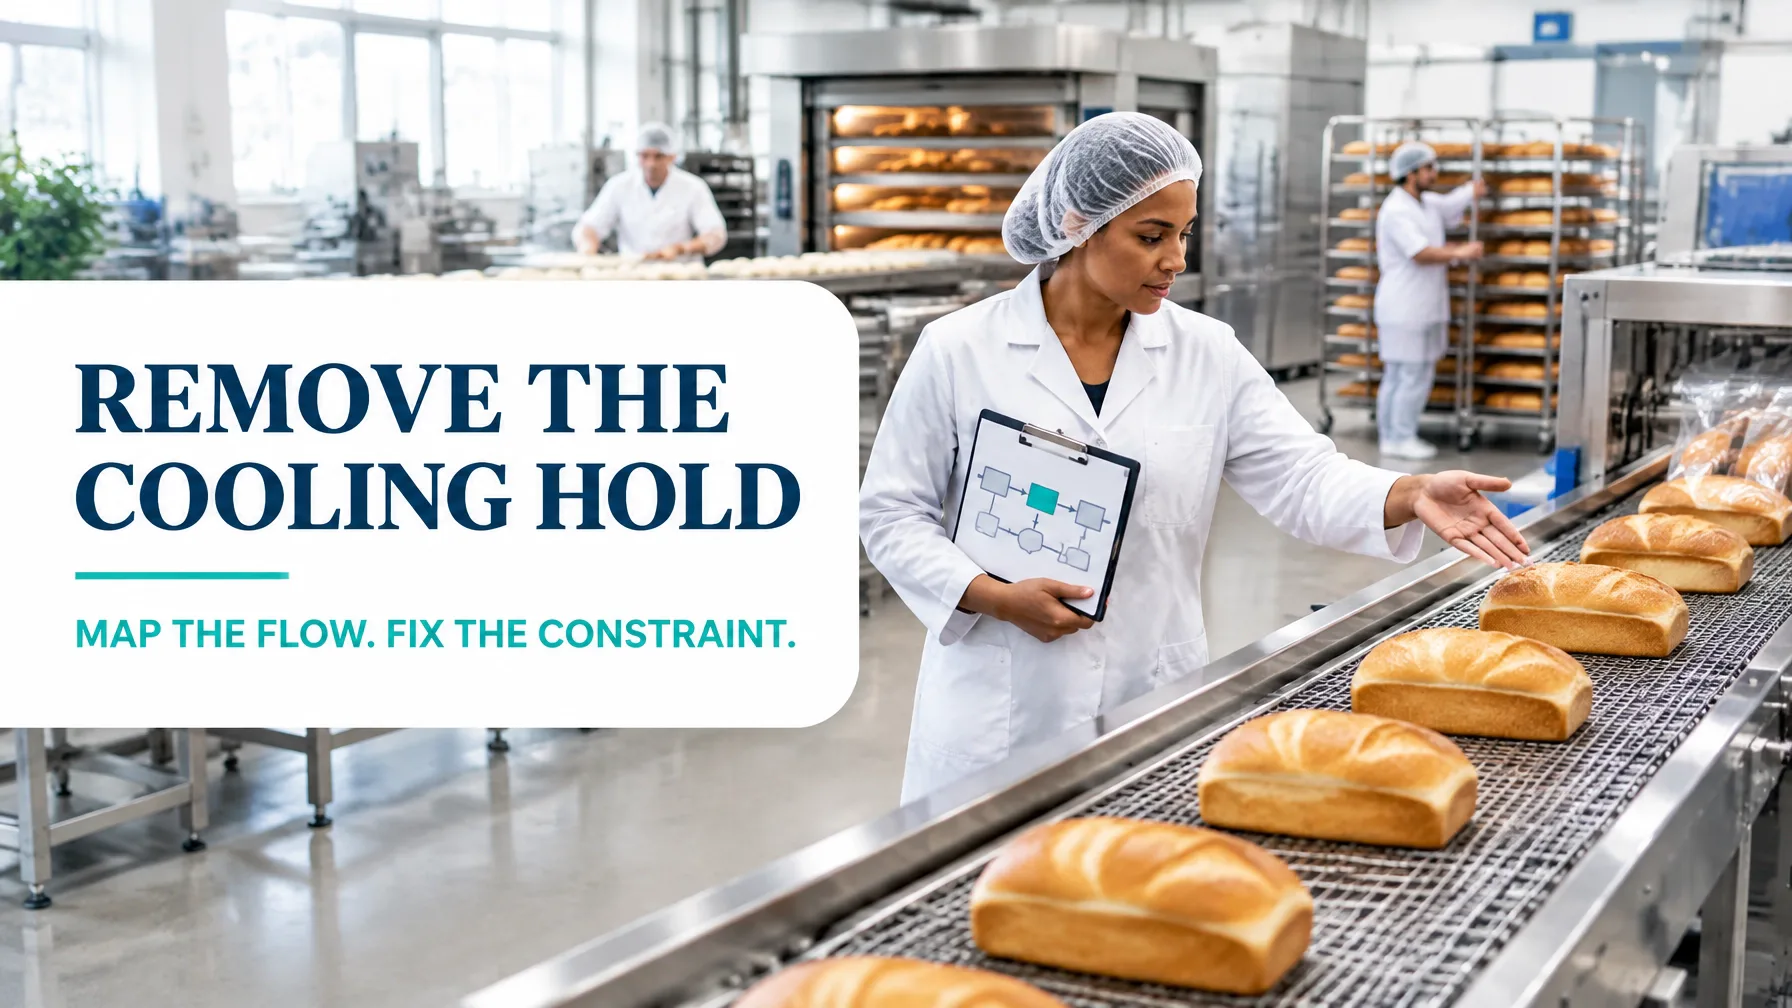
A cooling conveyor deserves particular attention: some dwell time is essential for product quality and safe handling, but a queue caused by an unbalanced line or repeated downstream stops is not the same thing as required cooling time. Map the difference before proposing a faster belt or additional equipment.

2. Scope the map: choose one product family
Start with a product family whose process and equipment are sufficiently similar to map together. For this worked example, scope is packaged sliced sandwich bread on one high-volume line, from the release of ingredients for a planned shift to finished cases entering the dispatch rack.
Include the people who operate and support the line: production, maintenance, quality, planning and dispatch. Observe the process at the bakery floor, and record actual cycle times, stoppages, inventory and information signals. This builds on the practical approach in our guide to creating a detailed process map.
The numbers below are illustrative worked-example data, not an industry benchmark. A real bakery should validate its own demand, product specifications and food-safety controls.
3. Current state: map the flow and calculate takt
Assume the line has 28,800 seconds of net production time per shift after planned breaks, with customer demand of 1,600 good loaves per shift.
Takt time = available production time ÷ customer demand
28,800 ÷ 1,600 = 18 seconds per loaf. This is the customer-demand rhythm the line needs to meet; it is not a target for reducing essential proofing or cooling residence time.
The process data below combines output pace with dwell time where relevant. Cycle times are seconds per loaf, except mixing, which is a 500-loaf batch. Changeover is approximate time per product change.
| Process step | Current cycle time / residence | Uptime | Changeover | First-pass yield |
|---|---|---|---|---|
| Mixing | 20 min per 500-loaf batch | 96% | 20 min | 99.8% |
| Dividing | 15.2 sec/loaf | 95% | 18 min | 98.5% |
| Moulding | 16.0 sec/loaf | 94% | 15 min | 99.2% |
| Proofing | 16.5 sec discharge pace; 50 min residence | 96% | 10 min | 99.7% |
| Baking | 15.5 sec discharge pace; 24 min through oven | 92% | 20 min | 98.0% |
| Cooling | 15.5 sec discharge pace; 45 min residence | 80% | 25 min | 99.5% |
| Slicing | 16.2 sec/loaf | 91% | 12 min | 98.5% |
| Wrapping | 15.8 sec/loaf | 93% | 14 min | 99.1% |
| Dispatch | 16.0 sec/loaf equivalent | 95% | 8 min | 99.8% |
Compare each cycle time with the 18-second takt, while accounting for uptime. As a simple capacity check, cooling’s effective cycle time is 15.5 ÷ 0.80 = 19.4 seconds per loaf. At that observed average, it cannot sustain takt. In this example, the cooling conveyor is the leading constraint: its availability loss and discharge interruptions restrict the flow to slicing and wrapping.
Inventory counts add the time dimension to the map:
- Proofing: 640 loaves waiting or in process, with a 50-minute proof residence.
- Cooling: 1,120 loaves in the cooling zone or its queue, with a 45-minute cooling residence.
- Other mapped inventory: ingredient staging 1,600; dough buffer 320; sliced bread before wrapping 320; finished goods awaiting dispatch 1,440.
These six inventory points total 5,440 loaves. At demand of 1,600 per shift, that represents approximately 3.4 shifts of inventory-based lead time (5,440 ÷ 1,600), before considering variability in orders or schedules. By contrast, adding the batch and required process residence times gives approximately 2.3 hours of processing and dwell time. The gap between lead time and process time signals substantial waiting and inventory.
Multiply the step yields to estimate rolled throughput yield (RTY): 99.8% × 98.5% × 99.2% × 99.7% × 98.0% × 99.5% × 98.5% × 99.1% × 99.8% ≈ 92.4%. This estimate represents the chance a loaf passes every mapped step without a defect or rework, assuming consistent definitions and reliable data.
4. Worked problem statement
Over the last 20 production shifts, the line averages 1,350 conforming loaves dispatched against demand of 1,600, an attainment rate of 84.4%. Cooling availability is 80%, the cooling-zone inventory reaches 1,120 loaves, and the total mapped WIP is 5,440 loaves.
A focused problem statement is:
For packaged sliced sandwich bread on Line 1, average dispatch is 1,350 conforming loaves per shift against demand of 1,600. The cooling area has 80% uptime and holds up to 1,120 loaves. Within 90 days, improve cooling flow and connected process performance to consistently dispatch at least 1,600 good loaves per shift, while maintaining validated cooling requirements and reducing total mapped WIP to no more than 2,800 loaves.
This defines the product, location, baseline, gap, target and timeframe without assuming the solution in advance.
5. Find all eight wastes with DOWNTIME
Use DOWNTIME to review the map with the people doing the work:
- Defects: Rejects or rework from inconsistent loaf shape, proof, bake, cooling or slice quality.
- Overproduction: Mixing or baking more than downstream demand can absorb, enlarging queues.
- Waiting: Dough, baked loaves, operators or wrappers idle during interruptions.
- Non-utilisation of talent: Operators’ improvement ideas and line knowledge are not routinely used to solve recurring stops.
- Transportation: Extra transfers of racks or trays between oven, cooling, slicing and packing.
- Inventory: Excess proofing, cooling, pre-wrap and finished-goods buffers.
- Motion: Operators make avoidable trips for tools, labels, film, or checks.
- Extra-processing: Duplicate inspections, repeated handling or recording the same production data in multiple places.
Categorise observations using evidence. For example, distinguish necessary cooling residence from extra time caused by a stopped slicer or wrapper.

6. Build the future state: countermeasures linked to causes
Set the production schedule at a suitable pacemaker, often the wrapping or pack-out process, and use customer demand to guide the upstream release. Where continuous flow is impractical, establish a clearly controlled FIFO buffer with a quantity limit and replenishment rule. These principles align with the Lean Enterprise Institute’s guidance on future-state flow.
Prioritise countermeasures that address measured causes:
- Stabilise the cooling conveyor. Standardise loaf spacing and loading; inspect belt tracking, drives and sensors; and address the stop causes responsible for lost uptime.
- Coordinate cooling with downstream capacity. Set belt speed and accumulation limits around validated cooling needs and wrapper demand. Add visual signals and defined responses for a downstream stop.
- Reduce avoidable changeover time. Separate internal and external changeover tasks, prepare tools and materials in advance, and trial standardised setup checks.
- Manage release and inventory. Use a defined FIFO limit between decoupled steps, and release work in small increments tied to the pacemaker rather than sending large batches forward.
- Protect quality and food safety. Validate any change affecting cooling time, product temperature, handling or slicing conditions with the appropriate technical and quality owners.
Only after piloting and measuring these actions should the team assess capital options such as added cooling capacity or a parallel packaging resource. Increasing capacity at an unconfirmed constraint can simply move the queue elsewhere.
7. Current state versus future state
The future-state values are 90-day targets for this example, not guaranteed results.
| Measure | Current state | 90-day future-state target |
|---|---|---|
| Customer demand per shift | 1,600 loaves | 1,600 loaves |
| Takt time | 18 sec/loaf | 18 sec/loaf |
| Cooling uptime | 80% | At least 96% |
| Cooling-zone WIP | Up to 1,120 loaves | No more than 320 loaves |
| Total mapped WIP | 5,440 loaves | No more than 2,800 loaves |
| Inventory-based lead time | About 3.4 shifts | About 1.75 shifts |
| Rolled throughput yield | About 92.4% | At least 96.5% |
| Conforming dispatched output | 1,350 loaves/shift | At least 1,600 loaves/shift |

8. A 90-day kaizen sequence
| Timing | Kaizen sequence and deliverables |
|---|---|
| Days 1–15 | Confirm scope and demand; walk the line; collect shift-level cycle, uptime, changeover, yield and WIP data; validate the current-state map and problem statement. |
| Days 16–30 | Analyse cooling and downstream stop reasons; review product and temperature checks; select root causes with operators; agree on baseline measures and pilot safeguards. |
| Days 31–45 | Trial standardised loading, maintenance checks, stop-response signals and changeover preparation on the selected product family. |
| Days 46–60 | Pilot a controlled FIFO limit and paced release; review daily output, queue size, quality and cooling compliance; adjust with the team. |
| Days 61–75 | Extend proven countermeasures across shifts; update standard work, visual controls and owner responsibilities; train affected team members. |
| Days 76–90 | Confirm results against targets; sustain through a control plan and regular review; publish the future-state map and prioritise the next improvement cycle. |
Turn the map into measurable improvement
Value stream mapping is most useful when it leads to validated changes, not just a well-drawn diagram. Lean Six Sigma training develops the practical skills to define problems, measure process performance, analyse causes and sustain gains. Lean 6 Sigma Hub offers CSSC-accredited certification from White Belt through Master Black Belt, with 100% self-paced online learning, simulations and end-to-end case studies.
Explore Lean Six Sigma online training and pursue the certification level that fits your role, from foundational White Belt learning to advanced project and capability leadership.
Kaizen. Kai-Care. Kai-Done. Lean Six Sigma





