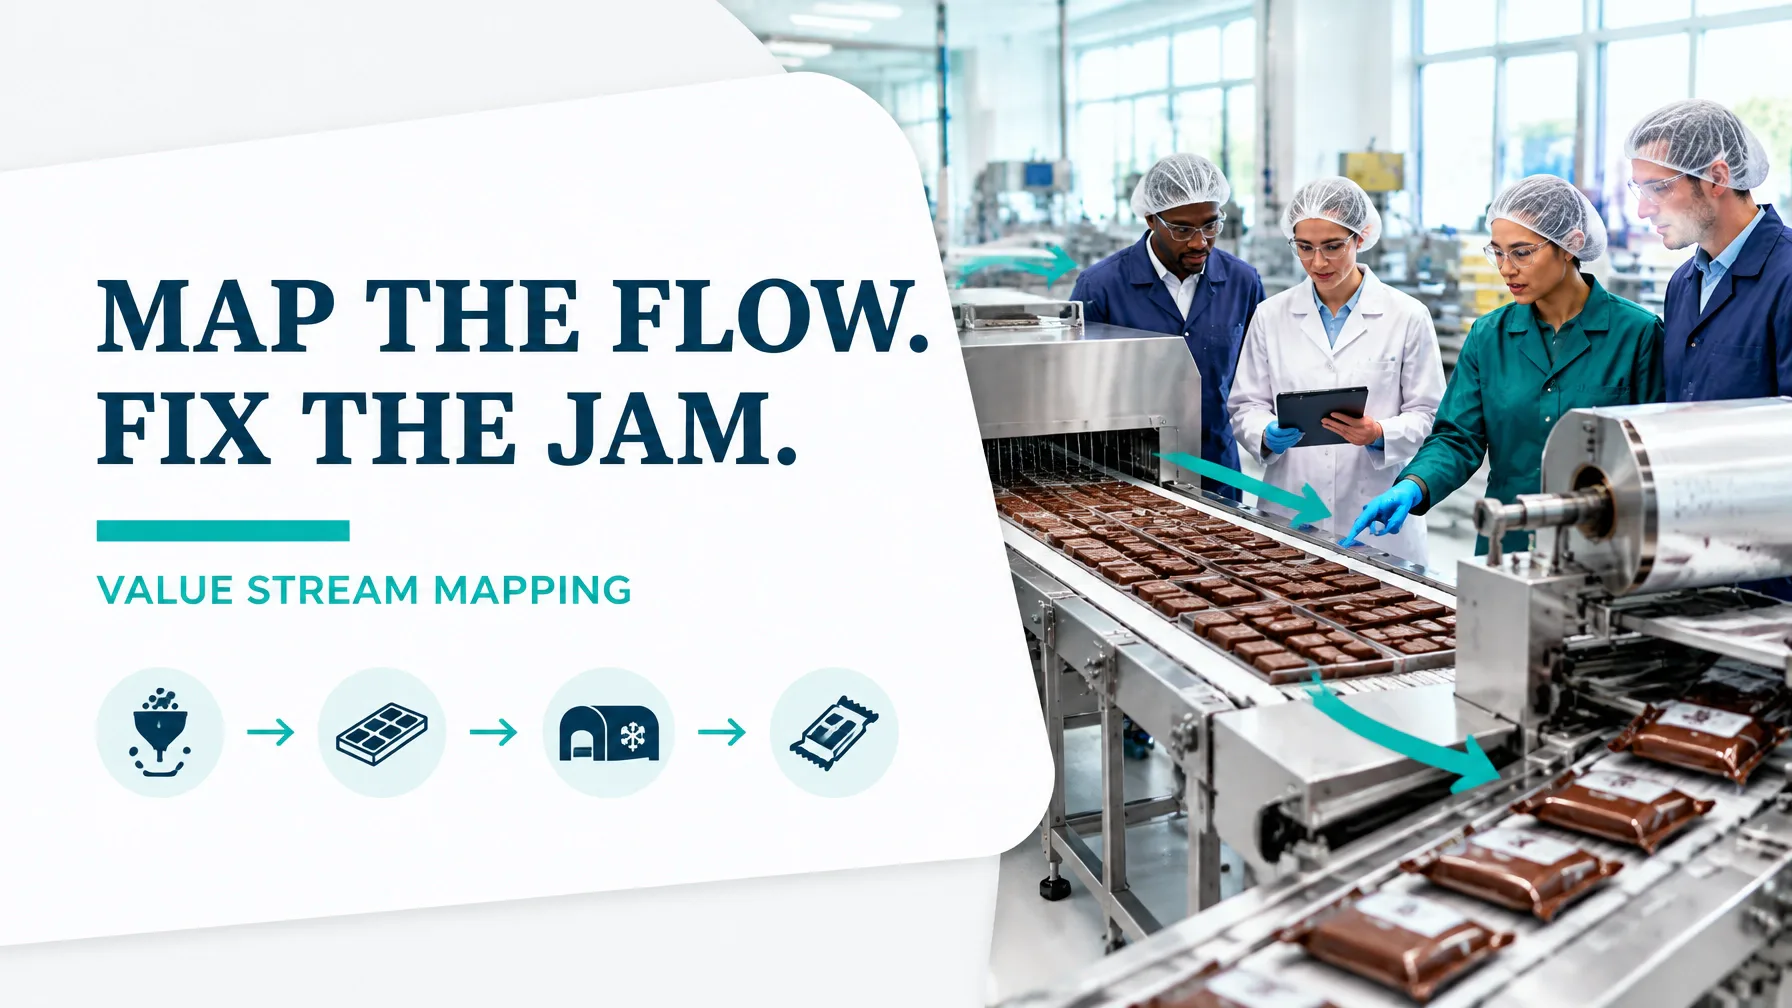
In confectionery and snack manufacturing, the most visible problem is often the wrapper jam. The deeper problem is usually less obvious: uneven production, oversized batches, excess cooling inventory, poor changeover discipline, and information delays between planning, production and quality.
Value Stream Mapping (VSM) makes the complete flow visible. It connects material movement, information flow, processing time, waiting, queues, quality losses and customer demand in one end-to-end view. Instead of improving the wrapper in isolation, the team can determine whether the real constraint is upstream cooking, extrusion, cooling capacity, scheduling or finished-goods release.
This guide uses an illustrative product family and measured-style dataset. The numbers are not a universal factory benchmark; they show how to structure a practical current-state and future-state analysis. For additional definitions, see the Lean Six Sigma Concepts and Glossary.
1. Select the Product Family and Map Boundaries
A useful product family should share the same major process route and equipment. For this example, the family includes:
- A 180g moulded chocolate bar.
- A 200g extruded corn snack packed on the same downstream wrapping, case-packing and palletising assets.
The chocolate route uses chocolate mass preparation, tempering and moulding. The snack route uses dry blending or slurry preparation, extrusion, drying and seasoning. Both routes converge at controlled cooling, retail wrapping, case packing and dispatch.
The map begins when raw materials are released to the syrup/slurry cook or chocolate-mass preparation area. It ends when wrapped cases are released from the finished-goods warehouse for customer delivery.
Assume:
- Net available production time: 7 hours per shift
- Customer requirement: 8,400 saleable packs per shift
- Available time: 7 × 60 × 60 = 25,200 seconds
- Takt time: 25,200 ÷ 8,400 = 3.0 seconds per pack
- Required demand rate: 20 packs per minute
This takt is the reference point for every process. A machine running below three seconds per pack may still fail to meet demand if uptime, quality or changeover losses are excessive.

2. Walk the Current-State Map
The current-state map should be built at the Gemba using a Time Observation Sheet, production records and direct observation. The following dataset represents one typical 1,200-pack batch moving through the line.
| Process step | Cycle or process time | Changeover | Uptime | Scrap/rework | Batch size | WIP and queue |
|---|---|---|---|---|---|---|
| Syrup/slurry cook or chocolate-mass preparation | 12 min/batch | 35 min | 92% | 1.5% / 0.5% | 1,200 | 2,400 packs; 45 min |
| Tempering or extrusion preparation | 2.4 sec/pack | 30 min | 90% | 1.0% / 0.4% | 1,200 | 600 packs; 20 min |
| Moulding or extrusion | 2.7 sec/pack | 40 min | 88% | 1.8% / 0.7% | 1,200 | 1,000 packs; 25 min |
| Cooling tunnel, including snack cooling after drying/seasoning | 35 min residence | 15 min | 93% | 0.8% / 0.3% | 1,200 | 2,400 packs; 60 min |
| Retail wrapping | 3.6 sec effective rate | 45 min | 78% | 3.2% / 0.8% | 1,200 | 1,200 packs; 35 min |
| Case packing | 1.8 sec/pack | 20 min | 95% | 0.3% / 0.1% | 12-pack cases | 600 packs; 15 min |
| Palletising | 1.2 sec/pack | 15 min | 97% | 0.1% / 0% | 300 packs | 300 packs; 10 min |
| Finished-goods warehouse | Release delay: 12 hours | n/a | n/a | 0.2% release loss | Pallet quantities | 720 min |
The wrapper appears to be the obvious constraint because its effective rate is 3.6 seconds per pack, slower than the 3.0-second takt. However, increasing wrapper speed alone would simply consume cooling inventory faster and intensify jams.
Lead Time Versus Value-Added Time
For this example, the value-added process time is:
- Cook or preparation: 12.0 minutes
- Tempering/extrusion preparation: 0.8 minutes per pack equivalent
- Moulding/extrusion: 0.9 minutes per pack equivalent
- Cooling: 35.0 minutes
- Wrapping: 0.06 minutes
- Case packing: 0.04 minutes
- Palletising: 0.02 minutes
Total value-added process time = 48.82 minutes
Waiting and queue time is:
- Raw-material staging: 120 minutes
- Process queues: 45 + 20 + 25 + 60 + 35 + 15 + 10 = 210 minutes
- Finished-goods warehouse dwell: 720 minutes
Total non-value-added time = 1,050 minutes
Therefore:
- Total lead time = 48.82 + 1,050 = 1,098.82 minutes
- Flow efficiency = 48.82 ÷ 1,098.82 × 100 = 4.4%
Cooling is treated here as value-added because it transforms the product into a stable, packable state. Inspection, rework, transport and queue time are excluded because they do not transform the product for which the customer is willing to pay.
3. Identify the DOWNTIME Waste
The eight wastes provide a disciplined way to interpret the map.
Defects
- Chocolate bars with temper instability, bloom or chipped edges.
- Snack bags with incorrect weight, poor seals, excessive seasoning or metal-detector rejects.
The illustrative wrapper defect rate is 3.2%. At 8,400 packs per shift, that equals approximately 269 rejected packs. At an estimated material and conversion cost of $0.85 each, the direct loss is approximately $229 per shift, excluding rework and customer risk.
Overproduction
- Cooking a full 1,200-pack batch before the wrapper has capacity.
- Producing one flavour or coating variant early because the schedule is based on machine utilisation rather than demand.
Two excess batches create 2,400 packs of additional inventory. At $0.85 of material and conversion value per pack, that represents $2,040 of tied-up value per cycle.
Waiting
- Cooled bars waiting for an available wrapper.
- Finished cases waiting for quality release, pallet collection or a dispatch slot.
The current map contains approximately 15.5 hours of waiting and warehouse dwell per representative flow. At an illustrative constrained-line cost of $420 per hour, that represents $6,510 of line-equivalent exposure per batch. This is not automatically a cash saving, but it shows the economic scale of the opportunity.
Non-utilised Talent
- Operators repeatedly clearing wrapper faults without participating in root-cause analysis.
- Experienced packers unable to adjust standard work, changeover methods or centreline settings.
Transportation
- Pallets moved multiple times between cooling, temporary storage and wrapping.
- Ingredients or packaging film transported from distant storage locations during a changeover.
Inventory
- Cooling-tunnel accumulation hiding an imbalance between continuous production and intermittent packaging.
- Excess printed film, cartons or seasoning staged for products that are not yet scheduled.
Motion
- Operators walking to retrieve film splices, tools or cleaning equipment.
- Quality staff moving between the wrapper, laboratory and warehouse to complete release checks.
Excess Processing
- Manual weight checks repeated after an automated checkweigher has already verified the pack.
- Repacking cases because coding, carton orientation or label placement was not controlled at source.
4. Build the Future-State Map

A practical future state should connect specific countermeasures to measurable targets.
-
Make the wrapper the pacemaker. Schedule the line to the 3.0-second takt, or 20 packs per minute, rather than pushing production from the cook or extrusion area.
-
Create a supermarket between cooling and wrapping. Set a controlled minimum of 600 packs and maximum of 1,200 packs. A Kanban signal triggers replenishment only when the supermarket reaches its minimum. This replaces uncontrolled accumulation with visible pull.
-
Level the schedule. Use a 60-minute heijunka sequence across chocolate and snack variants. Sequence compatible products together and avoid producing an entire day’s demand in one large batch.
-
Apply SMED to changeovers. Reduce wrapper changeover from 45 to 20 minutes by pre-staging film, guides, tools and recipes; converting internal tasks to external tasks; using quick-release fixtures; and assigning parallel work to the operator and technician.
-
Improve wrapper reliability. Raise wrapper OEE from 78% to 88% by separating breakdowns, film-splice failures, photo-eye faults, minor stops and speed losses. Use a short-interval Andon response process for repeated jams.
-
Install in-line metal detection and checkweighing. Verify every pack at the point of production. Target less than 0.5% false rejects, stable weight control and 100% documented challenge-test compliance.
-
Control the cooling interface. Use temperature and humidity centreline settings, defined residence time and maximum supermarket levels. For extruded snacks, control moisture and product temperature before seasoning and packing to prevent condensation and seal instability.
-
Use built-in quality. Integrate seal verification, code checks and automatic reject confirmation so defects do not travel into case packing. The goal is to reduce blended line scrap from 4.1% to 1.5%.
5. Current-State Versus Future-State Results
| Metric | Current state | Future-state target |
|---|---|---|
| Total lead time | 1,098.8 min | 360 min |
| Value-added process time | 48.82 min | 41.82 min |
| Wrapper changeover | 45 min | 20 min |
| Wrapper OEE | 78% | 88% |
| Blended scrap/rework | 4.1% | 1.5% |
| Total WIP | 9,700 packs | 2,100 packs |
| On-time-in-full delivery | 91% | 98% |
| Flow efficiency | 4.4% | 11.6% |
The future state does not depend on achieving a generic “world-class” OEE number. It focuses on the losses that prevent this specific product family from meeting demand reliably.
6. Execute the 90-Day Kaizen Sequence

Days 1–30: Stabilise and Measure
Owners: Production Manager, Quality Manager and Green Belt
- Validate takt, cycle time, WIP and downtime definitions.
- Create a wrapper-loss Pareto.
- Perform a measurement-system review for weight, temperature and seal checks.
- Establish the cooling-to-wrapper supermarket boundaries.
- Standardise jam recording and Andon response.
Metrics: 100% downtime coding, baseline OEE, WIP accuracy and defect stratification by SKU.
Expected result: Reliable baseline data, visible queues and a confirmed constraint.
Days 31–60: Improve Flow and Changeover
Owners: Engineering Manager, Maintenance Lead and Black Belt
- Run a SMED event on the wrapper.
- Pre-stage film, tooling and cleaning materials.
- Pilot the supermarket pull signal.
- Introduce a level-loaded schedule.
- Install or validate in-line metal detection and checkweighing.
Metrics: Wrapper changeover below 30 minutes, WIP below 4,000 packs, wrapper OEE above 83%.
Expected result: Fewer wrapper jams, shorter changeovers and reduced cooling accumulation.
Days 61–90: Control and Scale
Owners: Site Director, Operations Manager and Quality Lead
- Finalise standard work and centreline settings.
- Create daily control charts for weight, seal quality, temperature and OEE.
- Review OTIF and flow efficiency weekly.
- Train operators and supervisors on escalation rules.
- Extend the future-state design to additional SKUs.
Metrics: Changeover at 20 minutes, scrap at or below 1.5%, OTIF at 98% and flow efficiency above 10%.
Expected result: A repeatable system that protects throughput without creating excess inventory or relying on heroic intervention.
Become the Practitioner Who Can Lead This Improvement
A successful VSM requires more than drawing process boxes. It requires sound measurement, root-cause analysis, statistical thinking, financial justification and disciplined control. Build those capabilities through CSSC-accredited Lean Six Sigma training from Lean 6 Sigma Hub. Enrol in the online Lean Six Sigma training pathway, then develop the advanced skills required to lead manufacturing improvements through Green Belt and Black Belt certification.
Kaizen. Kai-Care. Kai-Done. Lean Six Sigma