In linehaul trucking, a load rarely loses time on the highway alone. Driver assignment, dock readiness, yard queues, detention and documentation all shape how quickly a tender becomes a confirmed delivery. Value stream mapping makes these connected delays visible by showing both freight movement and information flow from end to end.
The central constraint is often the utilisation of drivers and equipment across long distances, not simply truck speed. A truck delayed at a dock may miss its next dispatch window, while a driver’s available hours remain bounded by rest and hours-of-service rules. A useful map therefore seeks smoother flow and better asset turns without treating safety-critical rest as waste.
The method follows a familiar Lean sequence: map the current state, design a practical future state, then sequence improvements through measurable kaizen. The Lean Enterprise Institute’s VSM overview explains how maps connect process steps, timelines and information flow.
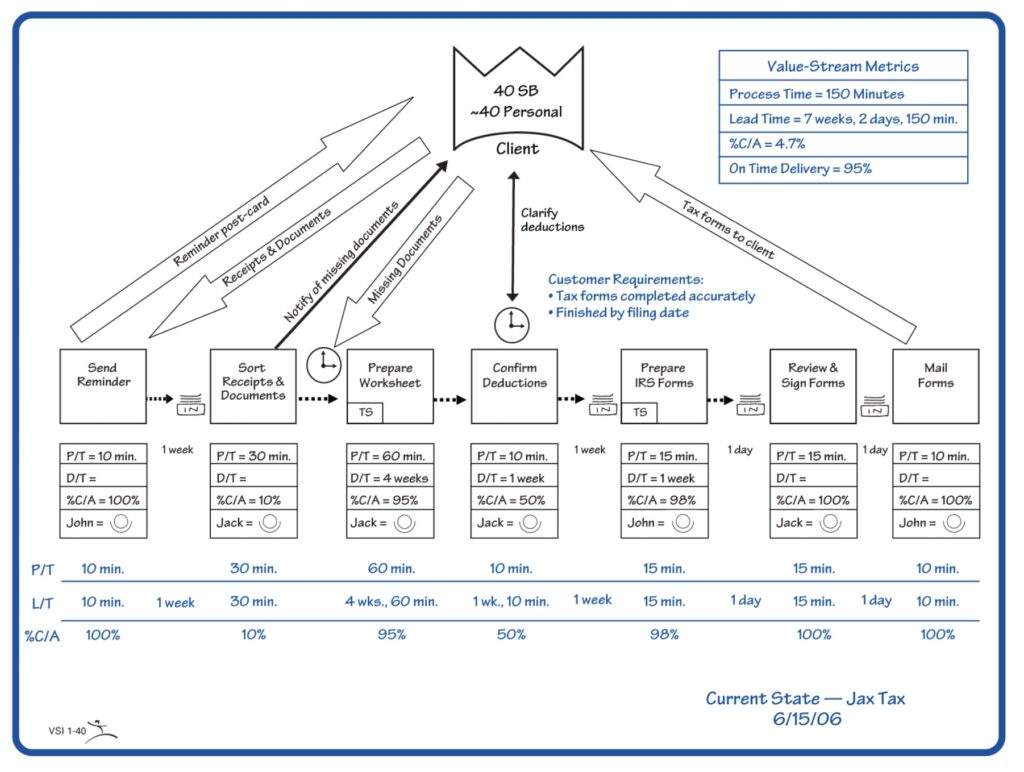
Example of a current-state map format. The freight figures below are a separate illustrative case, not data from this image.
1. Select a lane family and define the boundaries
Start with a repeatable product family: scheduled, dry-van linehaul loads between Distribution Centre A and Distribution Centre B. Set the boundary at load tender acceptance and end it at confirmed delivery and proof of delivery (POD).
This scope is useful because it includes the carrier, dispatch team, origin and destination facilities, driver, tractor and trailer, and the handoffs connecting them. It is specific enough for reliable measurement, but broad enough to reveal whether a delay at one facility affects downstream service.
Agree on the operational definitions before collecting data. For example, define on-time pickup and delivery against the contracted appointment window, and record detention as wait time beyond the facility’s agreed operating threshold. Capture timestamps from the TMS, yard system, appointment system, ELD or geofence events, and POD workflow. Then reconcile gaps with people doing the work.
2. Map the current state: follow one load through the system
The following hypothetical lane has 12 loads of daily demand. Its tender-to-POD lead time is 30 hours. Driving time is 10.5 hours; this is treated as the value-time proxy for calculating process cycle efficiency (PCE). On that basis, PCE = 10.5 ÷ 30 = 35%.
| Current-state step | Cycle or elapsed time |
|---|---|
| Tender issue and acceptance | 15 min |
| Wait for driver assignment | 45 min |
| Driver assignment and pre-trip inspection | 30 min |
| Origin yard queue | 75 min |
| Loading at origin dock | 90 min |
| Departure checks and documentation | 30 min |
| Linehaul driving, total | 10 hr 30 min |
| Mandatory non-driving break | 30 min |
| Required off-duty rest period | 10 hr |
| Destination arrival and yard queue | 45 min |
| Dock detention before unloading | 2 hr 15 min |
| Unloading | 60 min |
| Documentation and delivery confirmation | 15 min |
| Total lead time | 30 hr |
The timeline separates driving value time from queues, handling, administration and legally required rest. The 10-hour off-duty period and 30-minute break are shown for transparency; they are not improvement targets. For U.S. property-carrying drivers, FMCSA’s summary outlines the 11-hour driving limit after 10 consecutive hours off duty, the 14-hour driving window and the required break provisions. Confirm applicable rules for the operation and jurisdiction.
For a practical lane rhythm, suppose the origin has 16 staffed dispatch hours and a forecast of 12 loads per day. The demand takt is 16 × 60 ÷ 12 = 80 minutes per load. This is an average interval for planning departures, not an instruction to compress rest, ignore route variation or dispatch without a compliant driver and ready freight.
The map should track service and asset measures alongside time: current on-time pickup of 86%, on-time delivery of 82%, 145 empty kilometres per load, 2.4 trailer turns per week and a modeled cost of $1,240 per load. These are illustrative baseline assumptions; replace them with validated lane data.
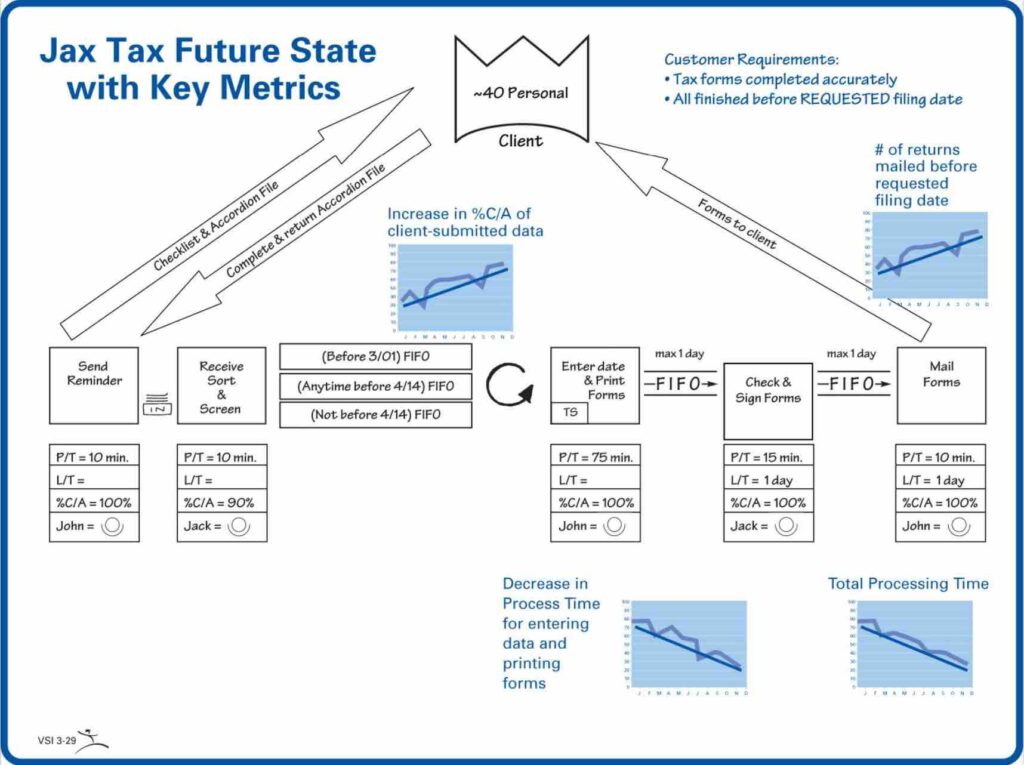
Example of a future-state map format; use it to structure the proposed freight flow, not as a source for the worked figures.
3. Identify waste with DOWNTIME
Use the eight-waste lens to turn map observations into actionable questions:
- Defects: A missing seal number or incorrect delivery document prompts manual investigation or redelivery.
- Overproduction: A trailer pool is built beyond lane demand, leaving equipment unused.
- Waiting: Drivers queue in the yard or wait for freight, a door or paperwork.
- Non-utilised talent: Drivers and dock teams lack a clear, quick channel to flag recurring appointment problems.
- Transportation: Empty running-145 km per load in this example, moves equipment without customer freight.
- Inventory: Excess work in process, including loaded trailers staged too early without a planned departure.
- Motion: Suboptimal trailer spotting creates extra yard moves and equipment searches.
- Extra processing: Dispatchers re-enter tender details or manually reconcile duplicate status updates.
Do not treat every non-driving minute as avoidable. First distinguish planned, necessary activity from preventable delay. In its 2024 report, the American Transportation Research Institute estimated 173 annual detention hours per truckload driver in 2023, with 97.7 hours unreimbursed. The report also found detention can disrupt schedules and HOS management. That makes dock flow a shared operational issue, not just an accessorial billing discussion.
4. Design the future state around reliable flow
Build the proposed map around readiness, predictable departures and fast exception handling:
- Schedule dock appointments to match door and labour capacity; spread arrivals rather than bunching them.
- Level-load departure waves to a realistic lane rhythm, aligned with confirmed demand and compliant driver availability.
- Use drop-and-hook where freight, yard space and trailer availability make it appropriate. Avoid creating a larger unused trailer pool than the lane needs.
- Align driver allocation with rest rules. Give dispatchers visibility of available hours and planned breaks when assigning loads.
- Capture digital POD at delivery to reduce paperwork handling and confirmation delays.
- Use exception-based dispatch: alert the team when freight is not ready, an appointment is at risk, a driver is delayed or a document is incomplete. Keep routine status updates automated where possible.
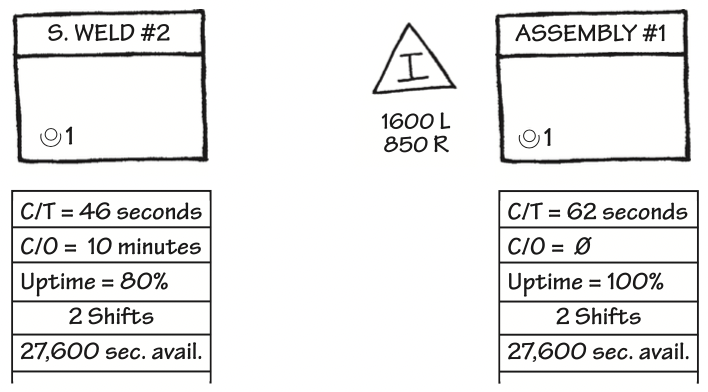
Process data boxes show where to document consistent measures. For a lane map, add appointment adherence, yard dwell, detention, loaded and empty kilometres, and status accuracy.
For the same hypothetical lane, set an initial future-state target of 25 hours tender-to-POD, retaining 10.5 hours of driving time. PCE becomes 10.5 ÷ 25 = 42%. The remaining lead-time reduction comes from less queueing and rework, not from shortening mandatory rest. Targets below are planning assumptions for a pilot, not guaranteed results:
| Measure | Current state | Future-state target |
|---|---|---|
| Tender-to-POD lead time | 30 hr | 25 hr |
| Driving value time | 10.5 hr | 10.5 hr |
| Process cycle efficiency | 35% | 42% |
| On-time pickup | 86% | 96% |
| On-time delivery | 82% | 94% |
| Empty kilometres per load | 145 km | 105 km |
| Dock detention | 135 min | 15 min |
| Trailer turns per week | 2.4 | 2.8 |
| Cost per load | $1,240 | $1,140 |
5. Sequence the kaizen work over 90 days
Use short improvement cycles, with owners and a shared definition of each metric.
| Wave | Focus and accountable owners | Example measurable target |
|---|---|---|
| Days 1–30: See and stabilise | Lane manager leads the map; dispatch and facility leads validate timestamps, delay codes and baseline definitions. | Capture complete tender-to-POD events on at least 90% of pilot loads; establish weekly baseline for dwell, empty km and service. |
| Days 31–60: Pilot flow changes | Origin and destination operations leads pilot appointment spacing, a digital yard queue and ready-to-load checks; dispatch lead pilots exception alerts. | Reduce median dock detention from 135 to 60 minutes; reach at least 92% on-time pickup on the pilot lane. |
| Days 61–90: Standardise and sustain | Transportation manager owns lane standards; finance validates cost; safety/compliance lead reviews HOS guardrails and exceptions. | Target 25-hour median lead time, 105 empty km per load and 94% on-time delivery; review performance weekly and assign countermeasures for misses. |
Treat these as testable goals, not promised savings. Compare like-for-like loads, account for volume and route mix, and check that the change does not shift delay to another facility or create safety risk. For the DMAIC project scope and charter, Lean 6 Sigma Hub’s guide to scoping Lean Six Sigma projects offers a useful starting point. The Process Cycle Efficiency Calculator can also help structure a before-and-after time analysis.
Turn the map into operational capability
A freight value stream map is most useful when it leads to clear ownership, reliable measures and sequenced experiments. It connects customer demand to dispatch rhythm, dock capacity, driver availability, asset turns and delivery confirmation, so teams can improve the whole lane rather than optimise isolated steps.
Build the skills to lead data-driven improvements: explore Lean 6 Sigma Hub’s self-paced, CSSC-accredited Lean Six Sigma training and certification courses, from White Belt through Master Black Belt.
Kaizen. Kai-Care. Kai-Done. Lean Six Sigma