1. What a Value Stream Means in a Paper Mill
In the realm of pulp and paper manufacturing, a value stream is the complete chain of material flow and information flow required to convert fibre into a customer-ready product.
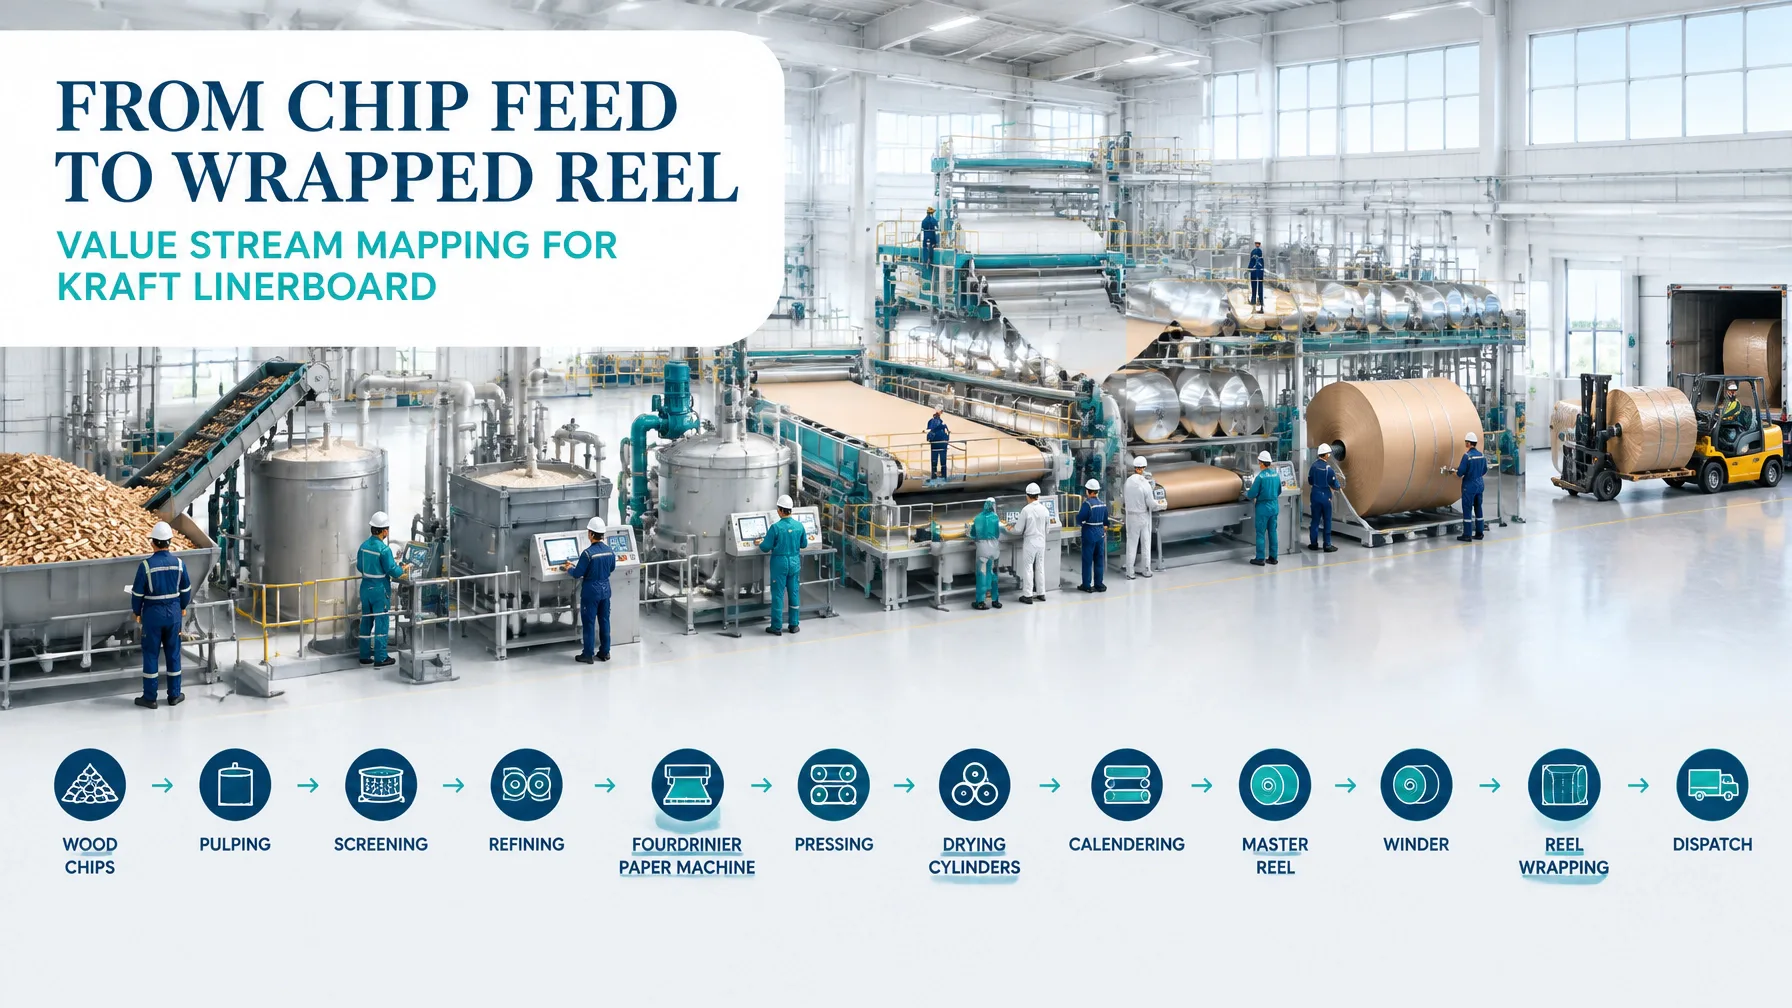
For a kraft linerboard mill, the physical flow begins with chip feed and continues through kraft pulping, screening, refining, fourdrinier forming, pressing, drying, calendering, reeling, winding, wrapping and dispatch. The information flow runs in parallel: customer orders become production requirements, production requirements become a grade schedule, and the distributed control system (DCS) provides operating signals and quality feedback.
The fundamental purpose of Value Stream Mapping is not to celebrate individual machine speed. A paper machine can run at 1,150 m/min and still deliver poor customer performance if reels wait for a winder, wrapped reels wait for a crane, or grade changes generate excessive broke.
Two connected but different streams must be distinguished:
- Order-to-reel stream: customer demand, quotation, order entry, production planning, grade scheduling and release of the finished reel.
- Physical pulp-to-reel stream: fibre transformation from chip feed through pulping, stock preparation, forming, pressing, drying, calendering and reeling.
The order-to-reel stream explains why material is produced. The physical pulp-to-reel stream explains how it is produced. A robust map connects both.
Industry references from the U.S. Department of Energy pulp and paper profile and the U.S. EPA pulp and paper technology guide confirm the energy-intensive role of pulping, papermaking and drying. In practice, this means lead time, uptime and flow stability matter more than isolated speed records.
2. Scope Selection: Establishing a Useful Boundary
This worked example maps one product family: 180 gsm kraft linerboard produced on Paper Machine 3.
The boundary begins at chip and unbleached feed and ends when the wrapped reel is ready for dispatch. It includes:
- Kraft pulping and screening
- Refining and stock preparation
- Fourdrinier forming
- Pressing
- Drying
- Calendering
- Reel building
- Winding
- Reel wrapping
- Warehouse staging and dispatch release
The demand assumption is 560 tonnes per day, with 24-hour production availability:
[
\text{Takt time}=\frac{1,440\text{ min/day}}{560\text{ t/day}}=2.57\text{ min/t}
]
Assuming one saleable reel weighs 25 tonnes:
[
2.57 \times 25=64.3\text{ min/reel}
]
The map deliberately excludes woodyard harvesting, external chip supply and outbound shipping. Those may be separate improvement projects, but including them would dilute the operational question: how can this mill move fibre from chip feed to a wrapped reel without machine-break drag?
3. Current-State Mapping
The current-state map shows a planning push system. Weekly planning releases a grade schedule, supervisors sequence work in the production meeting, and DCS signals control local process conditions. However, the physical system continues to create queues between major steps.

| Process box | Cycle time | Changeover | Uptime | WIP, batch and information |
|---|---|---|---|---|
| Chip feed, kraft pulping and screening | 2.5 min/t | 25 min | 98.5% | 14 hours of chip and pulp WIP; planning push |
| Refining and stock preparation | 1.1 min/t | 15 min | 97.4% | 0.6 days in stock chests; DCS freeness signals |
| Fourdrinier forming and pressing | 4 min/t equivalent | 74 min/grade | 95.5% | 1.2 hours of stock; grade schedule drives sequence |
| Drying, calendering and reel building | 13.4 min/reel gross | 74 min/grade | 94.2% | Two master reels; web-break and moisture signals |
| Winding | 5 min/master reel | 28 min/order pattern | 96.1% | Seven master reels queued; dispatch orders released weekly |
| Reel wrapping | 2 min/reel | 12 min/film specification | 95.0% | 38 min average queue; wrap instructions printed |
| Reel warehouse and crane dispatch | 7 min/reel | 10 min/truck pattern | 92.0% | 18 reels awaiting crane movement; truck plan is batch-based |
The true constraint is the combined paper machine dry-end and reel-to-warehouse crane interface. The dry end loses capacity through grade changes, web breaks and broke. The crane then amplifies the problem by releasing wrapped reels in batches rather than moving them according to customer pull.
4. Worked Example: One Reel Through the Stream
Consider one 25-tonne 180 gsm reel.
At a machine speed of 1,150 m/min and an assumed trimmed web width of 9.0 metres:
[
1,150 \times 9.0 \times 0.180=1,863\text{ kg/min}=1.863\text{ t/min}
]
Gross reel build time is:
[
\frac{25}{1.863}=13.4\text{ min}
]
Adjusting for 94.2% uptime:
[
\frac{13.4}{0.942}=14.2\text{ min effective cycle time}
]
Compared with the 64.3-minute reel takt, the dry end appears faster than demand. Yet this does not mean the stream is balanced. The 14.2-minute effective cycle excludes the consequences of a 74-minute grade changeover, web breaks, downstream queues and crane availability.
A representative lead-time calculation is:
- Chip and pulp WIP: 14.0 hours
- Pulping and screening: 8.0 hours
- Stock chest waiting: 3.0 hours
- Machine scheduling queue: 7.0 hours
- Forming, pressing, drying and reeling: 0.5 hours
- Winder queue: 5.0 hours
- Winding: 1.5 hours
- Wrapping queue: 0.633 hours, or 38 minutes
- Wrapping, warehouse and crane release: 1.867 hours
[
14+8+3+7+0.5+5+1.5+0.633+1.867=41.5\text{ hours}
]
Value-added time is approximately:
[
3+4+8+5+2=22\text{ minutes}
]
Therefore:
[
\text{PCE}=\frac{22}{41.5\times60}\times100=0.883%\approx\mathbf{0.9%}
]
During each grade change, the mill generates approximately 4.1 tonnes of broke. Deckle trim adds a further 2.3% trim loss. Over a 21-day on-time-in-full review window, the mill achieves only 91.8% OTIF, despite high nominal machine speed.
5. The Eight DOWNTIME Wastes
The following annualised estimates use an illustrative 180,000-tonne mill and a finished-product value of approximately $428 per tonne.
- Defects: Off-spec moisture and caliper create 1,150 tonnes of rework or downgrade, estimated at $0.49 million.
- Overproduction: The mill produces 2,400 tonnes ahead of confirmed demand to protect the schedule, creating approximately $0.09 million in carrying and discount cost.
- Waiting: Crane queues and release delays consume around 1,980 hours, representing approximately $0.32 million in lost contribution.
- Non-utilised talent: Operators spend an estimated 1,200 hours reconciling schedules, searching for reels and escalating delays, worth approximately $0.08 million.
- Transportation: Unnecessary forklift and crane travel consumes 1,400 hours, costing about $0.13 million.
- Inventory: Average excess reel and WIP inventory of 3,000 tonnes ties up approximately $0.05 million in annual carrying cost.
- Motion: Manual searching, repeated measurements and long walks around the dry end consume 2,600 labour hours, estimated at $0.12 million.
- Extra-processing: Re-slitting, re-wrapping and repeated quality checks affect 1,300 tonnes, adding approximately $0.07 million.
These are not merely housekeeping issues. They reduce available capacity, delay customer orders and increase the cost per tonne.
6. Future-State Build
The future state should establish flow around the constraint rather than pushing more material into it.

The design includes:
- Pacemaker at the winder: Sequence production to the winder’s customer-relevant demand rather than allowing the paper machine to run independently.
- Pull from the reel warehouse: Release reels to wrapping and dispatch through a controlled FIFO lane based on confirmed orders.
- Levelled grade wheel: Sequence compatible grades together to reduce the frequency and duration of grade changes.
- SMED on the size press: Separate internal and external setup work, pre-stage tools and use standard connection points.
- Dry-end standard work: Define stable startup, moisture-profile checks, web-break response and escalation triggers.
- Kanban for wrap film and cores: Replenish consumables at defined minimum and maximum levels.
- Visual uptime dashboards: Display uptime, web breaks, changeover minutes, broke tonnes and crane queue length by shift.
- Broke recovery loop: Segregate broke by grade and cause, return recoverable fibre promptly and use defect data to prevent recurrence.
7. Current-State vs Future-State Data
| Metric | Current state | Future state |
|---|---|---|
| Total lead time | 41.5 hours | 18.0 hours |
| Value-added time | 22 minutes | 22 minutes |
| PCE | 0.9% | 2.0% |
| Reel WIP | 18 reels | 6 reels |
| Grade changeover | 74 minutes | 40 minutes |
| Machine uptime | 94.2% | 97.0% |
| Broke rate | 3.4% | 1.8% |
| Tonnage on time | 91.8% | 97.0% |
| Cost per tonne | $428 | $395 |
Use the Process Cycle Efficiency Calculator to validate the PCE calculation with site data.
8. 90-Day Kaizen Sequencing

Days 1–30: Establish the baseline
- Time every queue, grade change and crane movement.
- Confirm the 41.5-hour lead-time baseline.
- Create a daily dry-end and crane constraint board.
- Assign the production manager as sponsor and the process engineer as data owner.
Metric that moves: measurement compliance, queue visibility and baseline accuracy.
Days 31–60: Stabilise the constraint
- Run a SMED event on the size press and grade transition.
- Introduce levelled sequencing for compatible grades.
- Create dry-end standard work for startup and web-break response.
- Assign the maintenance lead to the uptime dashboard.
Metric that moves: changeover from 74 to 55 minutes, uptime from 94.2% to 96%, and broke per change from 4.1 to 3.0 tonnes.
Days 61–90: Create pull and control
- Install winder pacemaker rules and reel-warehouse FIFO lanes.
- Introduce kanban for wrap film and cores.
- Start the broke recovery loop by cause and grade.
- Review OTIF, PCE, WIP and cost per tonne in a weekly governance meeting.
Metric that moves: lead time toward 18 hours, reel WIP toward six, and OTIF toward 97%.
9. Build the Capability Behind the Map
This example uses current-state mapping, future-state mapping, takt time, effective cycle time, SMED, PCE, WIP analysis, waste identification and kaizen sequencing. These tools become significantly more powerful when practitioners can connect operational data to root causes, financial impact and control plans.
Develop these capabilities through CSSC-accredited Lean Six Sigma training at Lean 6 Sigma Hub. Green Belt training builds the practical skills to lead data-driven improvement projects, while Black Belt training prepares professionals to lead complex transformations, mentor improvement teams and sustain measurable results. Start with the Lean Six Sigma concepts and glossary, then pursue the certification level that matches your role.
Kaizen. Kai-Care. Kai-Done. Lean Six Sigma