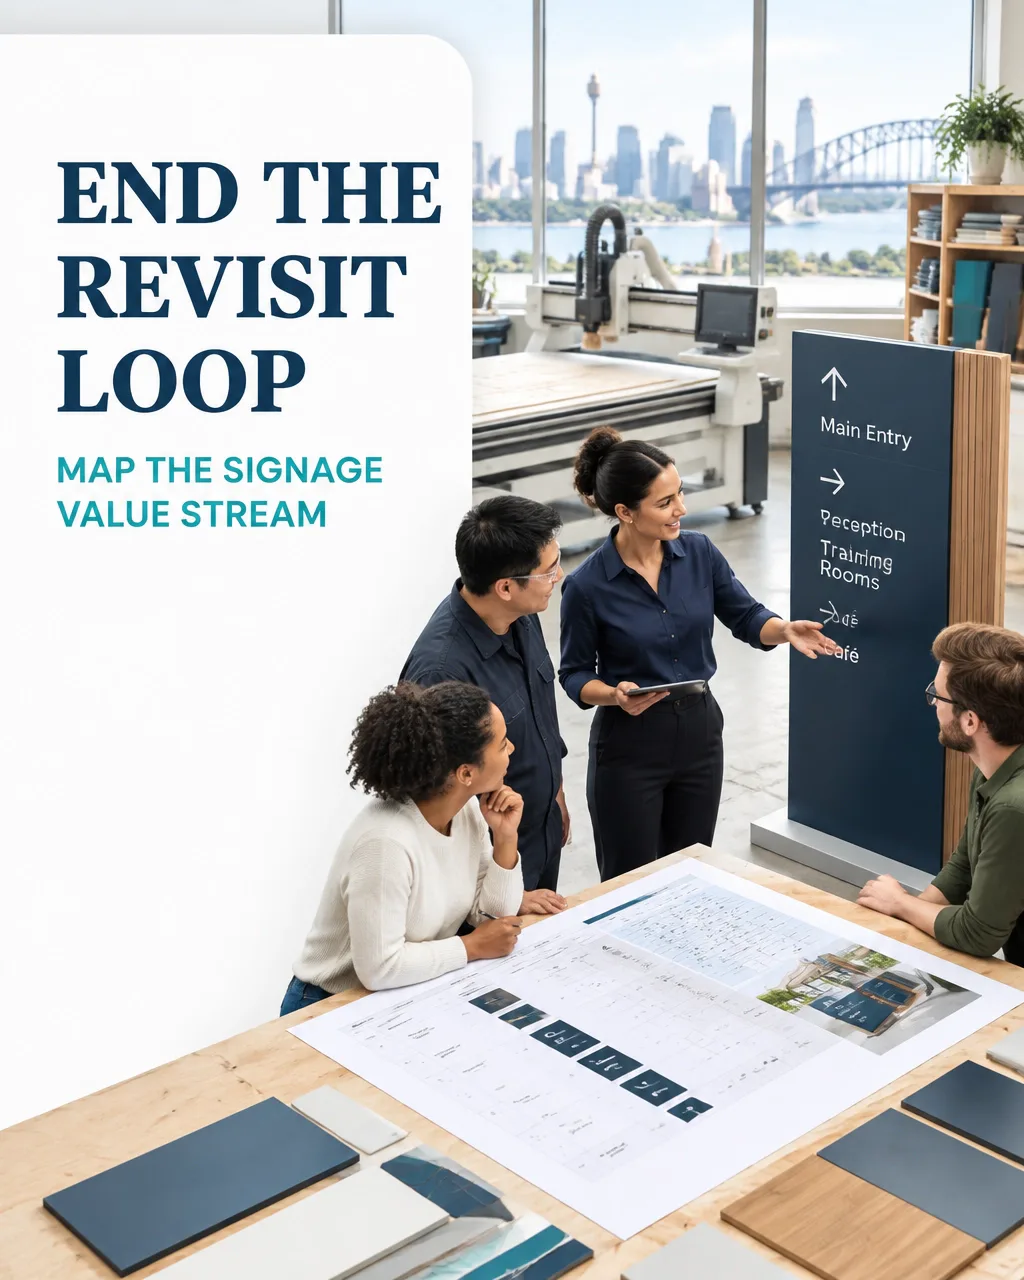
Why value stream mapping matters in signage fabrication
A wayfinding package is more than a collection of signs. It is a coordinated flow of information and materials: site details become a sign schedule, approved artwork becomes production files, fabricated components become labelled sign sets, and those sets must reach the right locations ready for installation.
Value Stream Mapping (VSM) makes that end-to-end flow visible. It captures value-adding work alongside queues, approvals, hand-offs, rework and information delays. In signage, the map must include both the physical route through print, cutting, fabrication and finishing, and the information route through client reviews, shop drawings, compliance checks and site coordination.
The worked example below represents an illustrative Australian project, not an industry benchmark: an 80-sign wayfinding package for a multi-level commercial building. Its figures are realistic planning assumptions for teaching the method; each business should replace them with observed data.
1. Select and define the value stream
Begin with one product family and a clear customer outcome. Avoid mapping every type of signage at once: illuminated external signs, printed graphics and tactile room signs may follow different routes.
For this example:
- Customer: the building owner or head contractor, with building users as the end beneficiaries.
- Value stream: one 80-sign wayfinding package, including internal directional, identification and required tactile signs.
- Start point: complete site information and approved project brief received by the signage provider.
- Finish point: signs installed, checked against their locations, and handed over with required close-out information.
- Scope boundary: design and shop drawings through approval, procurement, fabrication, quality checks, delivery and installation.
Record the customer’s critical requirements: correct message and location, approved brand treatment, compliant tactile details where applicable, installation by the agreed date, and no avoidable return visit.
For projects that include braille and tactile signage, check the applicable NCC provisions early. For example, NCC 2022 Specification 15 specifies requirements including tactile-character height and sign location. Confirm the applicable code edition, building classification and project requirements rather than relying on a generic checklist.
2. Map the current state with observed data
Walk the process with the people doing the work: project coordinators, designers, machine operators, finishers, quality staff and installers. Distinguish cycle time, active work time, from queue time, when the job is waiting. For a reliable map, collect both from recent jobs and verify them at the work area.
The following scenario assumes one 80-sign package. “Uptime” refers to the estimated availability of the relevant internal resource during planned production time; it is not applicable to an external approval queue.
| Current-state step | Cycle time per project | Changeover / setup | Uptime | Typical batch | WIP (project equivalents) | Queue time |
|---|---|---|---|---|---|---|
| Brief and site-information check | 2.0 h | 0.2 h | 95% | 1 project | 3 | 2 days |
| Artwork and shop drawings | 4.5 h | 0.5 h | 90% | 1 project | 6 | 4 days |
| Client, architect and compliance approvals | 1.0 h active coordination | – | N/A | 1 project | 8 | 8 days |
| Procurement and production planning | 1.5 h | 0.5 h | 92% | 80 signs ordered together | 5 | 5 days |
| Print, cutting and fabrication | 9.0 h | 2.0 h | 78% | 20 signs | 10 | 4 days |
| Finishing and assembly | 7.0 h | 1.5 h | 82% | 20 signs | 8 | 3 days |
| Quality check and packing | 2.5 h | 0.2 h | 96% | 20 signs | 4 | 1.5 days |
| Dispatch, installation and handover | 5.0 h | 1.0 h | 85% | 1 project | 6 | 4 days |
The queues total 31.5 business days. Active touch time totals 32.5 hours, or about 4.1 eight-hour workdays. If these times are treated as sequential for a simplified baseline, elapsed lead time is approximately 35.6 business days. Actual elapsed time can differ where tasks overlap, approvals run in parallel or external site conditions affect installation.
For an illustrative first-pass calculation, suppose each step passes without correction at the following rates: 94%, 92%, 95%, 98%, 93%, 94%, 96% and 90%. Rolled throughput yield is the product of those step yields:
0.94 × 0.92 × 0.95 × 0.98 × 0.93 × 0.94 × 0.96 × 0.90 ≈ 61%.
In other words, in this scenario, about 61% of packages would pass through every step without a correction or revisit. Define “pass” consistently and verify the actual rates with job records.

3. Find the eight wastes using DOWNTIME
Use the DOWNTIME framework to label specific evidence on the map, not general impressions:
- Defects: outdated artwork, incorrect location labels, finish variation, missing fixings or installation corrections.
- Overproduction: printing or fabricating a full batch before the approved revision or site sequence is stable.
- Waiting: client sign-off, missing site dimensions, material availability, machine queues or an unready installation area.
- Non-utilisation of talent: installers or operators spending time chasing status or resolving preventable information gaps instead of applying their technical knowledge.
- Transportation: panels moved repeatedly between print, cutting, fabrication, finishing and packing areas.
- Inventory: work-in-process waiting for approval, a machine slot, finishing or an installation date.
- Motion: staff searching for drawings, fixings, samples, tools or the latest revision.
- Extra processing: duplicate data entry, repeated artwork changes, unnecessary hand-offs or checking the same requirement at several late-stage gates.
Prioritise waste with evidence: frequency, delay, rework hours, customer impact and risk. A revisit may involve not only another installation trip but also access coordination, travel, inductions and disruption to other trades.
4. Build a future state around controlled flow
Design the future state to protect quality while reducing avoidable waiting and movement. A practical sequence is:
- Set a definition of ready: require confirmed site details, a controlled sign schedule, approved artwork and shop drawings, material specification, installation method and a realistic site date before release.
- Create one controlled job record: keep revision, approval status, location, owner, next action and promised date visible to design, production and installation teams.
- Group work by sign family and installation zone: release small, sequenced batches where feasible. Use a first-article check for a sign family before releasing the rest of that batch.
- Arrange a fabrication cell: position compatible print, cutting, assembly and quality activities to reduce travel and hand-offs. Keep specialist processes, such as paint curing, in their appropriate controlled areas.
- Use pull for shared materials and capacity: replenish common substrates and fixings from a visual Kanban signal; reserve constrained resources such as CNC time, finishing capacity or installation crews against the frozen plan.
- Build installation readiness into production control: verify access, inductions, permits, substrate conditions, lifting equipment and coordination with other trades before dispatch.
Calculate takt and a simple material Kanban
Assume demand is 80 sign-equivalents per week, across five working days, with 420 productive minutes available per day. Average daily demand is 16 sign-equivalents, so:
Takt time = 420 ÷ 16 = 26.25 productive minutes per sign-equivalent.
This is a planning rhythm for a mixed product family, not a promise that every custom sign takes the same time. Use it to compare demand with the workload at the pacemaker process and adjust for complexity.
For a common substrate replenished weekly, assume five business days of supplier replenishment time, 20% safety allowance and 10-sign containers:
Kanban cards = (16 signs/day × 5 days × 1.20) ÷ 10 signs per container = 9.6, rounded up to 10 cards.
Apply this only to suitable standard materials. Recalculate using actual consumption, replenishment variation and usable storage capacity.

5. Compare current and future-state targets
The future-state figures below are project targets for the example, to be validated during a pilot. They are not guaranteed results.
| Metric | Illustrative current state | Future-state target |
|---|---|---|
| Queue time across mapped steps | 31.5 business days | 10.5 business days |
| Active touch time | 32.5 hours | 25 hours |
| Simplified elapsed lead time | 35.6 business days | 13.6 business days |
| Average WIP across steps | 50 project equivalents | 21 project equivalents |
| Typical fabrication batch | 20 signs | 5–10 signs, sequenced by family/zone |
| Rolled throughput yield | 61% | 84% |
| Installation revisit rate | Establish baseline | Reduce through readiness and first-time checks |
The projected lead-time reduction is approximately 62% under the simplified assumptions. The priority is not simply to make each machine run faster. It is to make approved information, materials and site readiness available when the next step needs them.
6. Sequence kaizen across 90 days
Days 1–30: Establish the baseline and stabilise release
- Select one representative project and map it with the people who perform the work.
- Verify cycle, queue, changeover, uptime, WIP, first-pass yield and revisit data.
- Create a revision-controlled sign schedule and approval register.
- Introduce a definition-of-ready checklist and installation-readiness checklist.
Days 31–60: Pilot flow and pull
- Pilot smaller batches for one sign family or project zone.
- Trial a visual production-control board showing status, blocker, owner and due date.
- Establish Kanban levels for selected common materials using real demand and replenishment data.
- Run first-article checks and capture defect and rework causes at the point of work.
Days 61–90: Confirm results and standardise
- Compare pilot performance with the baseline, including lead time, WIP, rolled yield and revisits.
- Adjust cell layout, batch size and replenishment rules based on measured results.
- Document standard work for file release, quality checks, packing by zone and site handover.
- Assign process owners and review performance in a weekly improvement meeting.

Build the capability to lead measurable improvement
VSM connects Lean flow principles with the DMAIC discipline of defining the problem, measuring performance, analysing causes, improving the process and controlling the gains. A Green Belt can build the skills to lead structured improvement projects; a Black Belt develops advanced capability to lead complex, cross-functional change.
Explore Lean 6 Sigma Hub’s course range and consider Green Belt or Black Belt certification to strengthen your practical improvement toolkit. The courses are CSSC-accredited and self-paced, with real-world simulations and worked examples.
Choose your next certification and build the capability to map, improve and sustain better process flow.
Kaizen. Kai-Care. Kai-Done. Lean Six Sigma