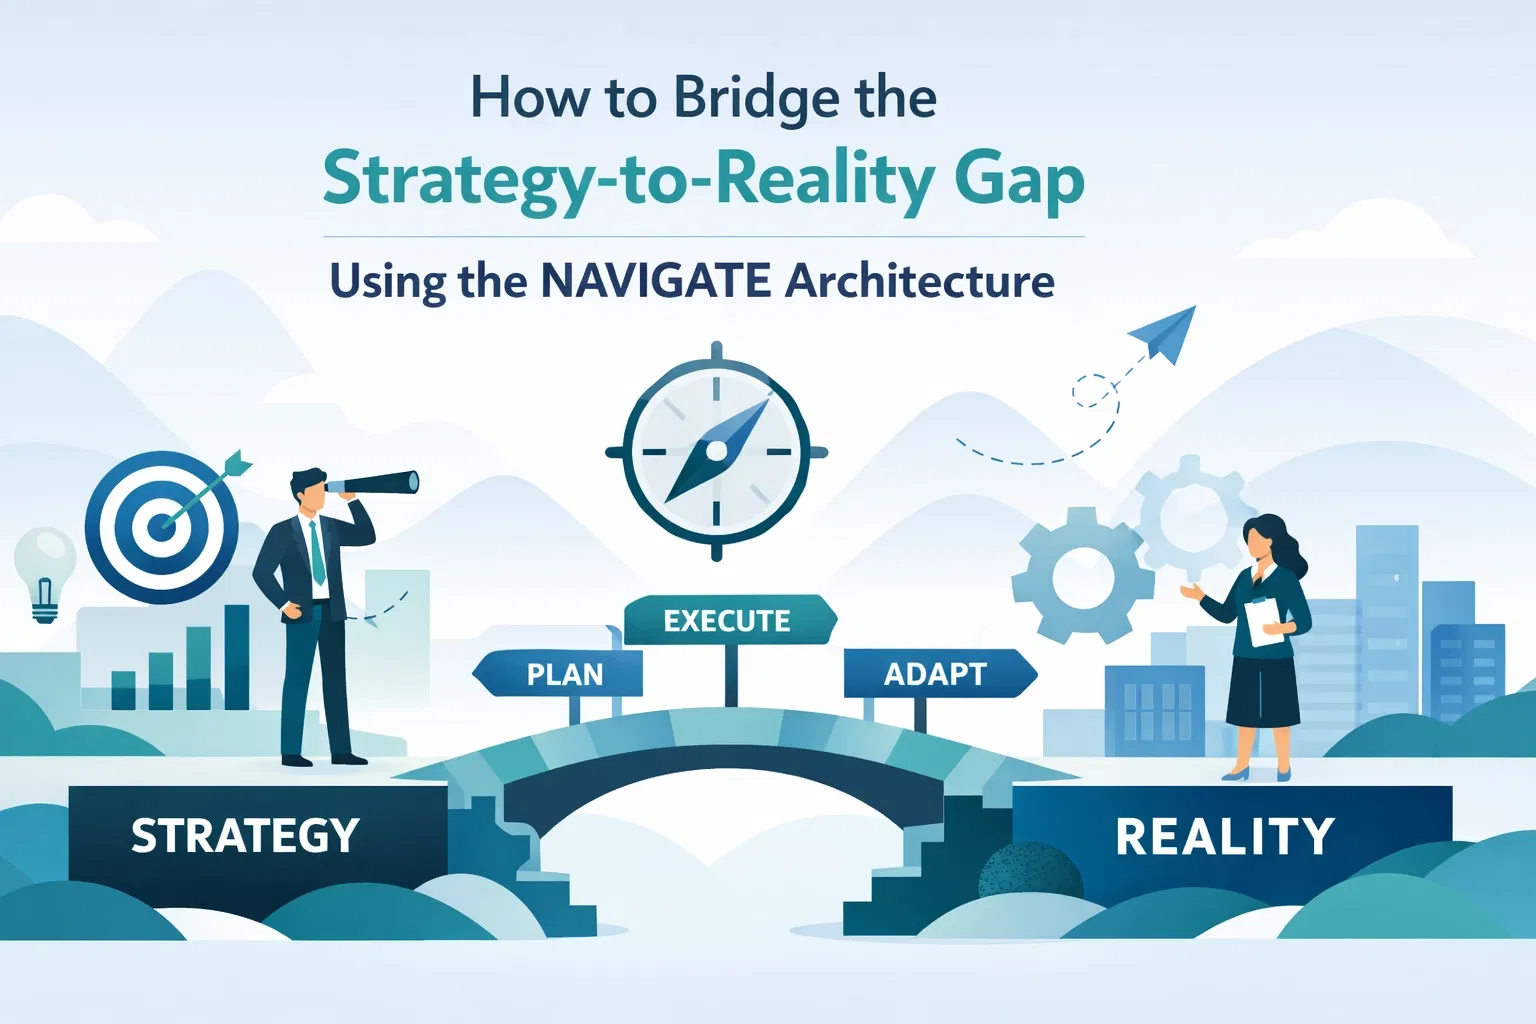
In the realm of operational excellence, the traditional DMAIC (Define, Measure, Analyse, Improve, Control) framework has long been the gold standard for process improvement. However, as global markets become more complex and organizational needs more nuanced, a more robust evolution has emerged: RDMAICS.
At Lean 6 Sigma Hub, we advocate for this comprehensive 7-phase methodology: Recognise, Define, Measure, Analyse, Improve, Control, and Sustain: to ensure that project execution is not just successful in the short term, but deeply embedded in the company culture for years to come. This process improvement guide explores how to master each phase of the RDMAICS framework to achieve maximum ROI and sustainable growth.
Why RDMAICS Over Traditional DMAIC?
The fundamental purpose of upgrading from DMAIC to RDMAICS is to address two common failure points in lean six sigma project execution: inadequate project selection and the eventual "drift" back to old habits once the project team leaves.
By adding Recognise at the start, we ensure strategic alignment before a single data point is collected. By adding Sustain at the end, we shift the focus from technical stability to cultural transformation. This lifecycle ensures that practitioners are solving the right problems and that those solutions stick.
Phase 1: Recognise – The Strategic Foundation
The Recognise phase is the strategic front-end that traditional DMAIC often leaves underdeveloped. In the realm of operational excellence, many projects fail not because the team cannot analyse or improve, but because the organization selected the wrong problem, pursued a low-leverage opportunity, or launched without leadership alignment. RDMAICS addresses this by making project recognition and prioritisation a formal phase with explicit deliverables, governance expectations, and decision gates.
Suggested timeline: 1–2 weeks (longer if the organization requires portfolio approval cycles).
Recognise: Step and Substep Structure (7 Steps, 35 Substeps)
Step 1 — Clarify the strategic context (5 substeps)
- Confirm current-year strategic pillars (e.g., cost, quality, delivery, safety, growth).
- Identify enterprise constraints (budget cycles, regulatory obligations, capacity limitations).
- Review recent operational performance (e.g., top loss categories by cost).
- Define the decision cadence (weekly ops review vs. monthly steering committee).
- Establish the improvement “north star” (e.g., reduce end-to-end lead time by 20%).
Step 2 — Surface problem signals across the value chain (5 substeps)
- Review KPI dashboards for abnormal trends (scrap %, rework hours, AHT, complaints).
- Extract Voice of the Customer (VOC) signals from complaints, NPS comments, churn reasons.
- Examine Voice of the Process (VOP) signals (control chart breaches, queue growth, overtime).
- Capture Voice of the Business (VOB) priorities (margin erosion, SLA penalties).
- Document “where pain lives” at a high level (departments, product lines, customer segments).
Step 3 — Create an initial opportunity statement (5 substeps)
- Describe the problem in business language (what, where, when, magnitude).
- Quantify the apparent size using rough-order-of-magnitude estimates.
- Identify suspected customers and stakeholders.
- Define the performance gap at a headline level (current vs. desired).
- Record assumptions explicitly (what is known vs. what must be validated).
Step 4 — Confirm feasibility and constraints (5 substeps)
- Verify data availability (systems, reports, sampling feasibility).
- Identify operational readiness (access to process, ability to run pilots).
- Check interdependencies (IT releases, vendor constraints, union agreements).
- Evaluate compliance and risk constraints (privacy, medical, aviation, finance controls).
- Validate that benefits are realistically capturable (not merely theoretical).
Step 5 — Prioritise and select the project (5 substeps)
- Build a shortlist of candidate projects (3–10 items).
- Use weighted scoring to rank (impact, effort, risk, alignment, urgency).
- Estimate benefit ranges (best/expected/worst) to avoid single-point optimism.
- Confirm sponsor interest and functional ownership.
- Select 1 project and identify “next best” backups if approvals change.
Step 6 — Establish governance and sponsorship (5 substeps)
- Appoint an Executive Sponsor and Process Owner.
- Confirm Belt level and time commitment (e.g., Green Belt 20% allocation).
- Define steering review cadence and escalation routes.
- Agree on success criteria (financial + operational + customer).
- Approve a preliminary resourcing plan (SMEs, analysts, IT, training).
Step 7 — Launch readiness and decision gate (5 substeps)
- Draft a one-page concept brief for sign-off (problem, scope guess, benefits).
- Define the initial CTQ/VOP hypothesis (what will be measured later).
- Schedule the Define workshop(s) and stakeholder interviews.
- Confirm baseline reporting access and permissioning.
- Conduct the Recognise gate review: Go / No-Go / Re-scope.
Key Objectives (Recognise)
- Identify high-leverage opportunities aligned to strategy, not anecdotal frustration.
- Evaluate potential projects based on ROI, feasibility, risk, and strategic fit.
- Secure executive sponsorship and a governance model before the team invests effort.
Essential Tools (Recognise)
- Project Selection Scoring Calculator: Use this to rank potential projects using weighted criteria rather than intuition.
- Project Charter ROI Calculator: Produce a defensible benefit estimate early (with ranges and assumptions).
- Benefit/effort matrix: Visual prioritisation to prevent low-impact project selection.
- High-level value stream scan: A rapid assessment to locate queues, rework loops, and handoff delays.
- Stakeholder map (early draft): Identifies champions, blockers, and impacted groups before Define begins.
Practical example (data-driven):
A logistics organisation observes late deliveries rising from 4.2% to 7.9% over eight weeks, alongside overtime costs increasing by $18,000/month. During Recognise, the team evaluates three candidate projects and selects “pickup scheduling variability” because it scores highest on impact (reduces late deliveries by an estimated 2–3 percentage points) and feasibility (data exists in TMS; pilot possible in one depot). This selection discipline is the first reason RDMAICS reliably covers the full lifecycle, unlike traditional DMAIC implementations that begin only after a project is already (sometimes poorly) chosen.
Phase 2: Define – Mapping the Boundaries
Once a project is recognised as a priority, the Define phase establishes precision: purpose, scope, boundaries, roles, and success criteria. To fully appreciate why RDMAICS outperforms traditional DMAIC in real organisations, note that RDMAICS expects strategic alignment (Recognise) before Define and long-term adoption (Sustain) after Control—thereby covering the full lifecycle rather than treating “project selection” and “change stickiness” as afterthoughts.
Suggested timeline: 3–5 weeks (shorter for narrowly scoped transactional projects; longer when VOC collection spans multiple customer groups).
Define: Step and Substep Structure (7 Steps, 42 Substeps)
Step 1 — Confirm the problem statement and goal statement (6 substeps)
- Write a problem statement with: what, where, when, and magnitude (no causes yet).
- Convert the symptom to a measurable gap (e.g., defects per unit, cycle time, cost).
- Define the goal statement with a numeric target and a due date.
- Specify “from–to” boundaries (start point and end point).
- Capture the business impact categories (cost, revenue, risk, customer, capacity).
- Record constraints and non-negotiables (compliance, staffing, system limitations).
Step 2 — Build the Project Charter (6 substeps)
- Define background and case for change in one paragraph.
- Confirm scope and out-of-scope items explicitly.
- Identify team structure (Sponsor, Process Owner, Belt, SMEs).
- Draft milestone plan by phase (high-level).
- Estimate benefits (hard savings vs. soft savings) and validation method with Finance.
- Define tollgate criteria (what must be true to proceed to each phase).
Step 3 — Capture Voice of the Customer (VOC) and translate to CTQs (6 substeps)
- Identify customer segments (external customers, internal downstream users).
- Choose VOC methods (interviews, surveys, complaint logs, call monitoring).
- Collect and code VOC themes (e.g., “late,” “inaccurate,” “hard to use”).
- Translate needs into CTQs (Critical to Quality characteristics).
- Define CTQ specs (targets, tolerances, defect definitions).
- Validate CTQs with customer representatives and the Process Owner.
Step 4 — Identify stakeholders and change impacts (6 substeps)
- Map stakeholders by influence and impact.
- Identify likely sources of resistance (loss of control, extra work, fear of metrics).
- Define engagement plan (who, message, frequency, channel).
- Confirm training needs by role (operators, team leaders, supervisors).
- Agree on communication artefacts (one-pager, FAQ, storyboard).
- Establish escalation path for scope and resource conflicts.
Step 5 — Map the high-level process (SIPOC + macro process map) (6 substeps)
- Facilitate a SIPOC session with SMEs and operators.
- Align on start/end points and key outputs (Ys).
- Identify key inputs (Xs) and upstream suppliers.
- Identify customers and how they judge quality (CTQs).
- Draft a macro process map (5–10 steps) with handoffs.
- Identify suspected waste areas (queues, rework loops, approvals, batching).
Step 6 — Identify risks, assumptions, and data needs (6 substeps)
- List assumptions that must be tested in Measure.
- Identify potential data sources and data owners.
- Draft an initial operational definition list (what counts as a defect, delay, etc.).
- Identify compliance/privacy requirements for data handling.
- Create a preliminary risk register (project risks, not process FMEA yet).
- Confirm feasibility of baseline measurement (sampling, access, tooling).
Step 7 — Define the Define-phase gate review and mobilisation plan (6 substeps)
- Confirm tollgate agenda and approvers.
- Present Charter, VOC-to-CTQ logic, SIPOC, and macro map.
- Confirm baseline metric list and data collection approach.
- Lock resourcing and time allocation for Measure/Analyse.
- Align on pilot boundaries (where/when pilots could occur later).
- Gate decision: Proceed / Re-scope / Pause.
Key Objectives (Define)
- Draft a formal Project Charter that is specific enough to prevent scope creep.
- Identify VOC and translate it into measurable CTQs (requirements and defect definitions).
- Map the high-level process (SIPOC and macro map) to establish clear boundaries and handoffs.
Essential Tools (Define)
- SIPOC (Suppliers, Inputs, Process, Outputs, Customers): A high-level map that provides a bird's-eye view of the process. You can evaluate your process complexity using our SIPOC Complexity Score Calculator.
- CTQ Tree: Translates VOC into measurable requirements (e.g., “fast response” → “< 2 hours”).
- Stakeholder Impact Assessment Calculator: Identify who will be affected by the change and how to manage their expectations.
- RACI matrix: Clarifies accountability to prevent ambiguity during Improve and Control.
- Gemba Walk (Define-level): A short observational visit to validate that the SIPOC reflects reality, not a “meeting-room process.”
Practical example (numbers):
A healthcare billing process shows 12.5% claim rework and an average cycle time of 9.4 days. The Define phase produces a CTQ of “clean claim rate ≥ 95%” and a target cycle time of ≤ 6.0 days within 120 days. Scope is explicitly limited to outpatient claims in two clinics to protect feasibility and speed.
Phase 3: Measure – Grounding the Project in Data
The Measure phase establishes the factual baseline and verifies that the organisation can measure performance credibly. In the realm of Lean Six Sigma, baseline data that is biased, inconsistently defined, or collected with an unstable measurement system will distort every downstream decision—particularly during Analyse, where false patterns can appear statistically convincing.
Suggested timeline: 3–6 weeks (often longer when multiple systems are reconciled or operational definitions are inconsistent across sites).
Measure: Step and Substep Structure (8 Steps, 40 Substeps)
Step 1 — Finalise operational definitions and defect logic (5 substeps)
- Confirm CTQ definitions (what counts as a defect, delay, error, rework).
- Define units (unit of work, unit of output, opportunity count).
- Align time definitions (business days vs. calendar days; start/stop timestamps).
- Define inclusion/exclusion rules (edge cases, exceptions, non-standard work).
- Document the definitions in a data dictionary accessible to the team.
Step 2 — Build the data collection plan (5 substeps)
- Identify each metric, owner, source system, and extraction method.
- Define sampling approach (census vs. sample; random vs. stratified).
- Define frequency (hourly/daily/weekly) and required sample size.
- Design collection sheets/forms and field validation rules.
- Confirm data storage and version control (single source of truth).
Step 3 — Perform process observation and current-state confirmation (5 substeps)
- Conduct Gemba Walks to validate actual process steps and rework loops.
- Time studies (where applicable) to capture cycle time components.
- Capture queue times and wait states between steps.
- Document handoffs, approvals, and exception routes.
- Update the macro map into a more detailed current-state map if needed.
Step 4 — Validate the measurement system (MSA) (5 substeps)
- Determine if measurement is variable, attribute, or automated.
- Conduct Gage R&R for variable data or Attribute Agreement Analysis for categorical decisions.
- Quantify repeatability and reproducibility issues (e.g., %R&R thresholds).
- Identify root causes of measurement error (training, definitions, tool calibration).
- Implement corrections (retraining, recalibration, definition refinement) and re-check.
Step 5 — Establish baseline performance (5 substeps)
- Calculate baseline averages and variation (mean, median, standard deviation).
- Compute defect metrics (DPU/DPMO/FPY) as relevant.
- Calculate baseline cycle time, lead time, and throughput.
- Quantify baseline costs (scrap, rework hours, SLA penalties, expedite fees).
- Stratify baseline by segment (shift, site, product, channel, customer type).
Step 6 — Assess process capability and stability (5 substeps)
- Confirm specification limits (from CTQs) and performance limits (process).
- Calculate capability metrics (Cp/Cpk or Pp/Ppk) where applicable.
- Use run charts/control charts to assess stability.
- Identify special causes and decide whether to remove/contain before Analyse.
- Document baseline capability gap in business terms (e.g., “currently operating at 2.6 sigma”).
Step 7 — Validate the baseline with stakeholders (5 substeps)
- Review baseline logic with SMEs and process operators.
- Reconcile conflicting reports from different systems.
- Confirm Finance validation approach for benefits tracking.
- Obtain sign-off on baseline metrics and definitions.
- Prepare the Measure tollgate pack with evidence of MSA and baseline stability.
Step 8 — Prepare Analyse readiness (5 substeps)
- Identify candidate Xs (inputs) based on observation and data patterns.
- Create an initial stratification plan for root-cause work.
- Identify “quick containment” actions if customer harm is ongoing.
- Confirm analysis tools and software approach (Excel/Minitab/BI tools).
- Gate decision readiness: data quality, definitions, and baseline confirmed.
Key Objectives (Measure)
- Develop a robust data collection plan with clear operational definitions and governance.
- Validate the measurement system using MSA so data is trustworthy.
- Establish baseline performance and capability to quantify improvement accurately.
Essential Tools (Measure)
- Measurement System Analysis (MSA): Ensures that the data collected is accurate and repeatable.
- Data Collection Plan Checklist: Ensure you aren't skipping vital steps like operational definitions, sampling frequency, or data governance.
- Gemba Walks: Observational validation that closes the gap between documented process and real work.
- Process capability analysis (Cp/Cpk or Pp/Ppk): Quantifies how well the process can meet CTQ specs.
- Stratification: Separates signal from noise by segmenting data (site/shift/product/channel).
Practical example (numbers):
A finance team measures “invoice exceptions” and finds a baseline exception rate of 8.7% (n=4,200 invoices/month). MSA reveals only 78% attribute agreement between reviewers due to inconsistent definitions of “missing PO.” After redefining the defect and retraining, agreement rises to 92%, enabling valid root-cause analysis in the next phase.
Phase 4: Analyse – Identifying the Root Cause
With a credible baseline in place, the Analyse phase isolates the true drivers of performance (the “critical Xs”) and distinguishes them from correlation, anecdotes, and noise. The fundamental purpose of this phase is to build a defensible cause-and-effect story that can withstand executive scrutiny and frontline reality.
Suggested timeline: 3–6 weeks (longer when multiple process paths exist or when experiments are required to confirm causality).
Analyse: Step and Substep Structure (8 Steps, 48 Substeps)
Step 1 — Confirm the performance gap and stratification logic (6 substeps)
- Restate baseline vs. target in one chart/table.
- Identify where the gap is concentrated (Pareto by defect type, step, product, site).
- Segment by time (day/week/month) to identify seasonality or release impacts.
- Segment by people/shift/team to test training or workload hypotheses.
- Segment by customer/channel to detect demand-shape drivers.
- Validate that segments are statistically and operationally meaningful.
Step 2 — Map the detailed process and identify failure points (6 substeps)
- Create a detailed process map or swimlane map (including decision points).
- Identify rework loops, queues, and handoff delays.
- Document where inspections, approvals, or batching introduce delay.
- Identify points where errors enter and where they are detected.
- Validate map accuracy via Gemba confirmation.
- Highlight suspected “high leverage” steps for deeper analysis.
Step 3 — Generate potential causes (Fishbone / 6M) (6 substeps)
- Run a structured brainstorming workshop with SMEs and operators.
- Build a Fishbone (Ishikawa) diagram using the 6M categories: Man, Machine, Method, Material, Measurement, Mother Nature (Environment).
- Convert vague causes into measurable variables (e.g., “training” → “time since onboarding”).
- Identify controllable vs. uncontrollable factors.
- Identify suspected interactions (e.g., shift x product type).
- Prioritise causes to investigate (impact, plausibility, data access).
Step 4 — Validate causes using graphical analysis (6 substeps)
- Use Pareto charts to confirm dominant defect modes.
- Use box plots to compare distributions across groups.
- Use scatter plots to test potential relationships (e.g., workload vs. error rate).
- Use time-series charts to link changes to events (policy change, new supplier).
- Check for outliers and data integrity issues.
- Produce an initial “vital few” list to test statistically.
Step 5 — Apply statistical confirmation (6 substeps)
- Select appropriate tests (t-test/ANOVA/chi-square/regression).
- Formulate null and alternative hypotheses with practical significance thresholds.
- Check assumptions (normality, equal variance, independence).
- Run tests and interpret both p-values and effect sizes.
- Validate findings with operational sense-making (does it fit the process reality?).
- Document conclusions and limitations transparently.
Step 6 — Identify and verify root cause(s) (6 substeps)
- Use 5 Whys to connect proximate causes to systemic causes.
- Confirm cause-and-effect directionality (cause precedes effect).
- Identify “root cause layers” (process design, training, system, policy, supplier).
- Quantify each root cause’s contribution to the gap (where possible).
- Validate via targeted sampling or observation (mini-studies).
- Finalise the critical Xs list for Improve.
Step 7 — Define the improved future-state requirements (6 substeps)
- Convert root cause logic into solution requirements (what must change).
- Identify constraints for solutions (IT limitations, compliance rules, ergonomic limits).
- Draft measurable solution success criteria (leading and lagging indicators).
- Identify potential unintended consequences to monitor.
- Align requirements with Process Owner and Sponsor.
- Prepare the Analyse tollgate narrative (evidence chain from data to root cause).
Step 8 — Prepare Improve experiments/pilots (6 substeps)
- Identify candidate solutions (countermeasures) linked to each critical X.
- Define pilot scope, duration, and evaluation method.
- Define baseline comparison method (before/after, A/B, stepped-wedge).
- Identify training and change management needs for the pilot.
- Confirm data collection plan for the pilot (what, how often, who).
- Gate readiness for Improve: root causes proven, not assumed.
Key Objectives (Analyse)
- Identify potential causes through structured tools and evidence.
- Use statistical and process analysis methods to prove or disprove hypotheses.
- Determine the quantified gap between current and desired performance and its drivers.
Essential Tools (Analyse)
- Fishbone / 6M (Ishikawa): Ensures potential causes are comprehensive and categorised logically.
- Hypothesis Testing: Uses statistical evidence (p-values plus effect size) to avoid opinion-driven decisions.
- Regression / ANOVA: Quantifies relationships and confirms the magnitude of factor impacts.
- The 5 Whys: Drills from symptom to system-level breakdowns.
- For a deep dive into how this looks in practice, review our LSS Black Belt Sample Project.
Practical example (numbers):
A contact centre seeks to reduce average handle time (AHT) from 9.8 minutes to 7.5 minutes. Analysis shows AHT is 2.1 minutes higher for one call type. ANOVA confirms significant differences by call type (p < 0.001), and regression indicates that “system rework screens” add 1.4 minutes on average. A 6M fishbone reveals the root cause as a Method + Measurement issue: inconsistent workflow steps and a misleading “call reason” code that routes customers to the wrong script, increasing transfers by 18%.
Phase 5: Improve – Implementing the Solution
The Improve phase converts proven root causes into tested solutions that measurably shift the CTQs. The fundamental purpose of Improve is not to “implement ideas,” but to engineer countermeasures that are linked to critical Xs, validated through pilots or experiments, and designed for operational adoption.
Suggested timeline: 4–8 weeks (longer if IT releases, capital approvals, or multi-site rollouts are involved).

Figure 2: A sample Project Charter showing the transition from the Analyse phase to the Improve phase, highlighting targeted KPIs and projected ROI.
Improve: Step and Substep Structure (8 Steps, 48 Substeps)
Step 1 — Translate root causes into solution requirements (6 substeps)
- Link each root cause to a requirement (“must eliminate…,” “must reduce…,” “must prevent…”).
- Define measurable acceptance criteria for each requirement.
- Identify constraints (policy, compliance, system design, ergonomic limits).
- Confirm what must stay unchanged (non-negotiables).
- Identify dependencies (vendors, IT, finance, training).
- Align requirements with Process Owner and Sponsor.
Step 2 — Generate solution options (6 substeps)
- Facilitate structured ideation (brainwriting, TRIZ, benchmark review).
- Generate solutions across people/process/technology, not only automation.
- Include Lean options (flow, pull, workload leveling, standard work).
- Include mistake-proofing and detection options.
- Identify quick wins vs. structural fixes.
- Document solutions in a solution bank mapped to root causes.
Step 3 — Screen and select solutions (6 substeps)
- Use a criteria matrix (impact, cost, speed, risk, sustainability, customer impact).
- Estimate benefit magnitude using baseline data (not anecdotes).
- Estimate implementation effort (hours, dollars, lead time, approvals).
- Identify change impacts by role and site.
- Select preferred solution set (often 2–5 combined countermeasures).
- Obtain sponsor alignment before piloting.
Step 4 — Design the future state (6 substeps)
- Create a future-state process map (swimlane + decision logic).
- Define new roles/responsibilities and handoffs.
- Define standard work sequence and expected takt/cycle time where relevant.
- Design visual controls (boards, status indicators, error cues).
- Define required system changes (fields, validations, automation rules).
- Draft training approach and materials outline.
Step 5 — Risk-proof the solution (FMEA and controls-by-design) (6 substeps)
- Conduct FMEA on the future-state process (failure mode, effects, causes).
- Rate severity/occurrence/detection and calculate RPN (or equivalent prioritisation).
- Identify control actions that reduce occurrence (prevention) not only detection.
- Add Poka-Yoke where feasible (hard stops, validation rules, templates).
- Define contingency actions and escalation for high-risk failure modes.
- Update the implementation plan with risk mitigations.
Step 6 — Pilot and/or experiment (6 substeps)
- Select pilot site/team/time window with minimal confounders.
- Define comparison method (A/B, before-after with controls, stepped rollout).
- Define pilot KPIs (leading and lagging) and measurement cadence.
- Train pilot participants and verify readiness.
- Run pilot, capture issues daily, and adjust within agreed boundaries.
- Analyse pilot results: effect size, stability, and operational practicality.
Step 7 — Implement and scale (6 substeps)
- Finalise rollout plan by location/team/product line.
- Secure approvals (IT release, finance, compliance, procurement).
- Train all impacted roles; validate competence where needed.
- Deploy supporting materials (job aids, checklists, templates).
- Execute cutover plan with hypercare support.
- Confirm benefits capture method and handover timing.
Step 8 — Validate results and Improve tollgate (6 substeps)
- Compare post-improvement performance to baseline using agreed metrics.
- Confirm unintended consequences (quality trade-offs, workload shifts).
- Validate financial benefits with Finance (hard vs. soft savings evidence).
- Update project documentation (future-state map, FMEA, training artifacts).
- Prepare the Control plan inputs (what must be monitored and by whom).
- Gate decision: proceed to Control with a stable implemented solution.
Key Objectives (Improve)
- Generate potential solutions linked directly to verified root causes.
- Select the best solution set using objective criteria and quantified trade-offs.
- Conduct a pilot or experiment to confirm the solution works in real operations.
Essential Tools (Improve)
- Failure Mode and Effects Analysis (FMEA): Proactively identifying how the new solution might fail and building safeguards.
- Kaizen Events: Rapid improvement workshops to implement changes quickly (especially effective for workflow redesign and standard work).
- Poka-Yoke: Error-proofing to prevent defects rather than detect them.
- Design of Experiments (DOE) (where appropriate): Efficient testing of multiple factors and interactions.
- Standard Work drafts: The precursor to formal SOP updates in Control.
Practical example (numbers):
A warehouse pilot introduces a new pick-path layout, barcode validation (poka-yoke), and standard work. Mis-picks drop from 2.4% to 0.9% over three weeks (n=18,000 picks), while average pick time decreases from 92 seconds to 78 seconds. FMEA identified “scanner battery failure” as a high-occurrence risk; the team added a charging standard and visual battery status checks, reducing the risk during scale-up.
Phase 6: Control – Ensuring Stability
The Control phase formalises operational control so the gains do not erode the moment project attention shifts elsewhere. In the realm of Lean Six Sigma project execution, Control is the technical stabiliser: it standardises the new way of working, establishes monitoring, and creates response plans when performance deviates.
Suggested timeline: 3–5 weeks (some items continue in parallel with early Sustain activities).
Figure 3: An example of an X-bar and R Control Chart showing a process within statistical control limits after the implementation of the Improve phase.
Control: Step and Substep Structure (8 Steps, 40 Substeps)
Step 1 — Finalise the control strategy (5 substeps)
- Identify which CTQs and leading indicators must be controlled.
- Define control points (where measurement occurs) and owners.
- Define monitoring cadence (real-time, daily, weekly) by metric.
- Define acceptable thresholds and escalation triggers.
- Confirm reporting mechanism (dashboard, daily management board, automated alerts).
Step 2 — Create the Control Plan (5 substeps)
- Document process step, CTQ/Y, measurement method, sampling, and frequency.
- Define reaction plan for out-of-control signals (who does what, within what timeframe).
- Define containment actions to protect the customer if performance degrades.
- Define audit checks (layered process audits, checklist audits).
- Obtain Process Owner approval and integrate into daily management routines.
Step 3 — Standardise work and documentation (SOPs) (5 substeps)
- Update or create Standard Operating Procedures (SOPs) aligned to the future state.
- Create job aids (one-point lessons, checklists, quick reference guides).
- Ensure document control (versioning, approval, accessibility at point of use).
- Align SOPs with compliance/regulatory requirements where applicable.
- Retire obsolete documents to prevent parallel “shadow processes.”
Step 4 — Training and competence validation (5 substeps)
- Train all impacted roles using role-based materials.
- Validate competence (observation checklist, short assessment, sign-off).
- Identify super-users or shift champions for on-the-floor support.
- Schedule refresher training triggers (new hires, quarterly refresh).
- Confirm that training records meet internal audit requirements.
Step 5 — Implement Statistical Process Control (SPC) where appropriate (5 substeps)
- Select chart type (I-MR, Xbar-R, p-chart, u-chart) based on data type.
- Establish control limits using post-improvement stable data.
- Define rules for detecting special cause variation (Western Electric or agreed rules).
- Integrate chart review into daily/weekly routines.
- Train teams on how to interpret charts and take action without overreacting.
Step 6 — Visual management and process ownership routines (5 substeps)
- Design visual boards that show CTQs, targets, status, and actions.
- Define daily huddle agenda focused on abnormality management.
- Define escalation routes for recurring issues.
- Establish issue log and problem-solving cadence for emerging gaps.
- Confirm Process Owner accountability and backup coverage.
Step 7 — Verify benefit capture and compliance (5 substeps)
- Validate that measured improvements are sustained for a minimum period (e.g., 4 weeks).
- Confirm savings capture in finance systems (cost centres, budget lines, avoidance rules).
- Verify quality and customer metrics have not traded off negatively.
- Ensure compliance artefacts are complete (SOPs, training records, audit logs).
- Prepare the Control tollgate evidence pack.
Step 8 — Handover readiness to Sustain (5 substeps)
- Confirm steady-state ownership (Process Owner, team leaders).
- Confirm audit schedule and KPI review cadence.
- Confirm documentation repository and access.
- Confirm ongoing resourcing (who maintains dashboards, who audits).
- Gate decision: move to Sustain with controls operating effectively.
Key Objectives (Control)
- Create and deploy a monitoring and reaction plan that prevents performance drift.
- Update and institutionalise SOPs and standard work to make the new process repeatable.
- Implement SPC and visual management so abnormality is detected early and addressed consistently.
Essential Tools (Control)
- Control Plan: The central document that connects CTQs to measurements, owners, and reaction plans.
- Control Charts (SPC): Visual statistical tools that detect drift and special cause variation early.
- SOPs and Standard Work: The operational foundation that makes outcomes repeatable.
- Layered Process Audits (LPA): Ensures adherence and detects “workarounds” before they become normalised.
- Visual Management: Makes process health visible at a glance and supports daily accountability.
Practical example (numbers):
After rollout, a billing process improves clean-claim rate from 87.5% to 95.6%. The Control plan specifies daily monitoring of “missing information defects” with a p-chart and a reaction plan: if the defect rate breaches the upper control limit for two consecutive days, the team must perform same-day containment and a 30-minute root-cause mini-session. SOP updates and training sign-offs ensure the process remains stable during staff turnover.
Phase 7: Sustain – The Cultural Anchor
This is where RDMAICS distinctly surpasses traditional DMAIC. While DMAIC often concludes at Control (implying that documentation and charts alone prevent regression), RDMAICS formalises Sustain to ensure the improvement becomes culturally embedded, resilient to turnover, and reinforced through leadership routines and governance. In the realm of continuous improvement, this final phase is what converts a “successful project” into an enduring capability.
Suggested timeline: 8–12 weeks (and then ongoing as part of business-as-usual). Many organisations treat the first 90 days post-control as the critical window for habit formation.
Sustain: Step and Substep Structure (8 Steps, 40 Substeps)
Step 1 — Formalise ownership and accountability (5 substeps)
- Confirm Process Owner and operational owners by shift/team/site.
- Define KPI accountability (who owns which metric, how often reviewed).
- Establish escalation thresholds and decision rights.
- Integrate responsibilities into role descriptions where applicable.
- Confirm governance cadence (monthly ops review, quarterly strategy review).
Step 2 — Embed Leader Standard Work (LSW) (5 substeps)
- Define leader routines (daily/weekly) aligned to CTQs and leading indicators.
- Create standard checklists for leader process confirmation.
- Define what leaders must verify at the point of work (not from a desk).
- Schedule routine review of abnormality trends and recurring issues.
- Audit adherence to LSW and coach leaders when drift occurs.
Step 3 — Establish an audit system that detects “workarounds” (5 substeps)
- Define audit types (layered process audit, document audit, data audit).
- Define audit frequency and sampling logic.
- Train auditors on what “good” looks like (SOP conformance criteria).
- Use an audit finding log with due dates and owners.
- Trend audit results to detect early erosion (before KPI failure).
Step 4 — Reinforce behaviour through Gemba Walks and coaching (5 substeps)
- Conduct routine Gemba Walks focused on process adherence and barriers.
- Use structured questions (what is the standard? what is abnormal? what action?).
- Capture frontline improvement ideas and close the loop visibly.
- Coach problem-solving on minor deviations before they grow.
- Recognise teams that maintain standards and proactively surface issues.
Step 5 — Standardise onboarding and training continuity (5 substeps)
- Incorporate SOPs and job aids into onboarding packs.
- Define certification/competency requirements by role.
- Create a refresher training schedule and triggers (errors, audit failures, new hires).
- Maintain training records and ensure easy access to the latest documents.
- Periodically test knowledge with short assessments or observations.
Step 6 — Replication and horizontal deployment (5 substeps)
- Identify other areas with similar process patterns (copy-exact opportunities).
- Define replication criteria (similar CTQs, similar failure modes, similar systems).
- Package the solution (SOPs, control plan templates, training materials).
- Roll out to additional sites/teams using a staged approach.
- Compare performance across sites and adjust standards as necessary.
Step 7 — Benefits verification and long-term tracking (5 substeps)
- Confirm benefits at 30/60/90 days (operational + financial).
- Validate savings capture and prevent “benefit evaporation.”
- Track leading indicators that predict regression (training compliance, audit scores).
- Confirm customer outcomes (complaints, NPS, SLA adherence).
- Publish a performance storyboard to maintain transparency and momentum.
Step 8 — Institutionalise continuous improvement (5 substeps)
- Establish a pipeline of next improvements based on residual losses.
- Define how future issues are routed (when to use quick Kaizen vs. full RDMAICS).
- Maintain a lessons-learned repository and reuse templates.
- Celebrate success with data: before/after metrics, customer impact, financial impact.
- Conduct project closeout with a Sustain gate: “Is this now business-as-usual?”
Key Objectives (Sustain)
- Transfer ownership to the Process Owner with clear accountability and governance.
- Conduct regular audits and leader routines to prevent silent drift.
- Embed metrics into daily management (huddles, boards, KPI reviews).
- Replicate improvements across the organisation to scale ROI.
Essential Tools (Sustain)
- Leader Standard Work: Structured leader routines that reinforce standards and ensure rapid response to abnormality.
- Gemba Walks: Observation and coaching at the point of work to maintain adherence and remove barriers.
- Audit systems (Layered Process Audits): Detects erosion, workarounds, and document misuse early.
- Performance storyboarding: Keeps results visible, data-driven, and culturally reinforced.
- Onboarding integration: Ensures new hires inherit the improved process, not the old one.
Practical example (numbers):
A manufacturing team improves first-pass yield from 91.2% to 96.8% in Improve/Control. Sustain then prevents regression by implementing weekly layered audits and leader standard work. Over the next 12 weeks, audit adherence remains above 95%, while FPY holds at 96.4–97.1% despite onboarding six new operators—demonstrating that the improvement is no longer dependent on the original project team.
Staying on Track: The Role of Six Sigma Flash Cards
Mastering these 7 phases requires a deep understanding of dozens of tools and concepts. Whether you are an aspiring Green Belt or a seasoned Black Belt, keeping the technical requirements of each phase top-of-mind can be a challenge.
Our Six Sigma Flash Cards are designed to help practitioners bridge the gap between theory and execution. They provide quick-reference guides for tool selection, formulas, and phase-specific checklists, ensuring you never miss a step in your RDMAICS framework journey.
Conclusion: Elevate Your Career with RDMAICS
Executing a Lean Six Sigma project is more than just running statistics; it is a structured journey toward excellence. By adopting the 7-phase RDMAICS guide, you ensure that every project is strategically relevant, technically sound, and culturally permanent.
In the competitive landscape of modern business, those who can demonstrate a track record of sustained improvement are the ones who lead. If you are ready to take the next step in your professional development, start by testing your knowledge with our free resources.

Take the first step toward mastery today. Explore our Free Lean Six Sigma Black Belt Practice Exam and see how you rank against the industry’s highest standards. To secure your future as a process leader, enroll in our CSSC-accredited certification programs at Lean 6 Sigma Hub.