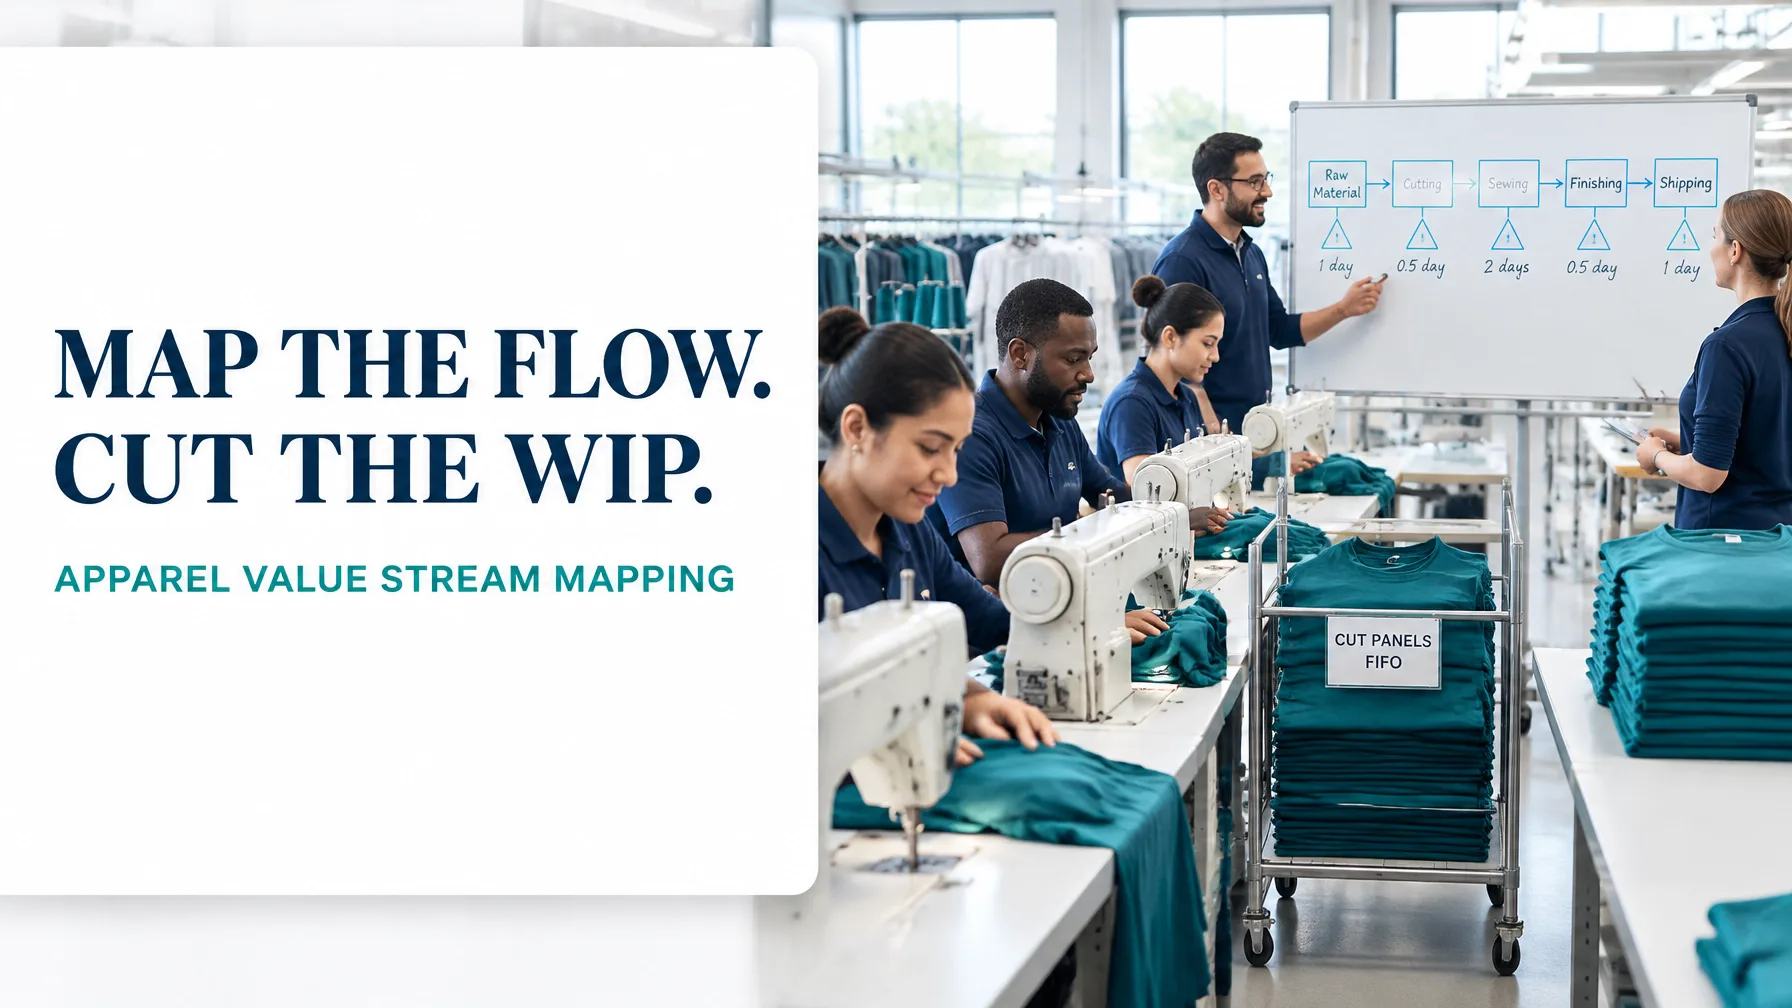
A sewing line can be busy all day and still struggle to deliver the right garments on time. In apparel manufacturing, the cause is often not a lack of activity but a lack of flow: fabric waits for inspection, cut panels accumulate before sewing, and finished pieces queue for pressing or packing.
Value stream mapping (VSM) makes this system visible. It maps the flow of both materials and information, from supplier inputs to the customer, so teams can distinguish value-adding work from queues, rework and unnecessary handling. In cut-make-trim production, the purpose is to improve the entire path to a store-ready garment, not simply to speed up one workstation.
The example below follows a knitted basic T-shirt through a hypothetical factory. Its figures are a worked scenario for demonstrating the method, not a universal apparel benchmark. Actual results depend on style complexity, product mix, staffing, shift time and how each factory defines its measures. Published apparel studies also show that VSM interventions and their outcomes vary by factory; see this apparel VSM case study.
1. Select a product family and define the scope
Start with a family that shares a similar route and equipment. For this example, select a knitted basic T-shirt range with comparable fabric, construction and finishing requirements. Avoid combining products with substantially different process paths in one map.
Set the scope from fabric roll receipt to store-ready packed garment. This includes fabric inspection, marker making and cutting, sewing, thread trimming, pressing, quality inspection, folding and packing. The boundary matters: beginning at cutting could conceal delays in fabric release, while ending at sewing would miss finishing queues and packing constraints.
Confirm customer demand, available production time, product specifications and the information signals that trigger work. This follows the Define-phase discipline of setting clear project boundaries; see best practices for scoping Lean Six Sigma projects.
2. Build the current-state map with shop-floor data
Walk the process and observe a representative production period. Record actual cycle times, queue times, WIP, changeovers, first-pass yield and schedule signals. Distinguish cycle time at each operation from sewing labor content: 8.5 minutes of combined sewing work per shirt does not mean the line releases one garment every 8.5 minutes.
Worked demand and takt calculation
Assume the line runs one shift with 450 net production minutes per day, five days per week, and customer demand of 2,000 shirts per week.
- Daily demand: 2,000 ÷ 5 = 400 shirts
- Takt time: 450 ÷ 400 = 1.125 minutes per shirt, or 67.5 seconds
Takt is the required customer rhythm, not a promise that the current process can meet it. In this scenario, the sewing line’s current output interval is 1.15 minutes, slightly slower than takt. That gap is a capacity warning: the team should investigate the sewing constraint rather than assume extra cutting will solve the delivery problem.
Current-state data
The WIP figures below use 400 shirts per day as the planning rate. Queue time multiplied by that rate gives the approximate buffer count for each queue.
| Process or queue | Process cycle / touch time per garment | Wait before next step | Approx. WIP |
|---|---|---|---|
| Fabric receipt and inspection | 0.40 min | 0.8 day | 320 |
| Marker making and cutting | 1.10 min | 0.7 day | 280 |
| Cut-panel queue before sewing | – | 3.5 days | 1,400 |
| Sewing line: 10 operators within an 8–14 operator range | 8.50 min labor content; 1.15 min line output interval | 1.4 days in bundles | 560 |
| Thread trimming and pressing | 1.60 min combined | 1.0 day | 400 |
| Quality inspection | 0.60 min | 0.6 day | 240 |
| Folding and packing | 1.20 min | – | – |
Total touch time is 13.4 minutes per garment. For this example, value-added time is 11.7 minutes: cutting, sewing, pressing and packing work that creates or completes the garment for its customer. Inspection and thread trimming are necessary or corrective activities, but they do not add value from the customer’s perspective.
Total waiting is 8 working days. At 450 production minutes per day, that is 3,600 minutes of elapsed production time. So:
- Process Cycle Efficiency (PCE): 11.7 ÷ 3,600 × 100 = 0.33%
- Total WIP in mapped queues: approximately 3,200 garments
The low PCE indicates that elapsed time is dominated by waiting rather than transformation. For more on the calculation, use the Process Cycle Efficiency Calculator.

3. Identify the eight wastes in the garment flow
Use DOWNTIME to connect observed waste to specific process evidence:
- Defects: Seam failures discovered at final inspection create rework and delay shipment.
- Overproduction: Cutting a full size-set batch before sewing confirms the style mix can leave unwanted sizes waiting.
- Waiting: Cut-panel bundles sit for 3.5 days before the sewing line.
- Non-utilisation of talent: Operators may see recurring seam issues or imbalance but lack a regular way to raise and test improvements.
- Transportation: Bundles travel between cutting, sewing, trimming, pressing and inspection, sometimes through separate areas.
- Inventory: The 1,400-piece cut-panel buffer hides mismatches between cutting release and sewing consumption.
- Motion: Operators reach for thread, tools or parts stored outside the point of use.
- Extra processing: Repeated checks, unnecessary pressing or duplicate handling add time without improving the garment to specification.
Bundle handling deserves close attention. Every move can add counting, sorting and search time, while large bundles delay quality feedback. Reducing the bundle size without controlling changeovers or balancing work, however, can simply transfer queues elsewhere.
4. Design a practical future-state map
The future state should synchronise upstream release with customer demand and protect the sewing constraint from both starvation and overload.
A practical design for the example is to:
- Balance the sewing line to takt. Reallocate work across 10 operators, cross-train where appropriate and test a line output interval below 1.125 minutes. Use observed station times to confirm the balance.
- Pull work in controlled quantities. Replace unrestricted cutting push with a small FIFO lane or supermarket between cutting and sewing. Set a visible maximum WIP and replenish only what the line consumes.
- Arrange work in a compact cell. Reduce bundle transport and make operator hand-offs and abnormalities visible.
- Reduce size-changeover time. Separate internal and external setup tasks, prepare guides and materials in advance, and target a reduction from a hypothetical 60 minutes to 25 minutes per size-set change.
- Build quality at source. Define the seam and measurement checks at the operation, provide a clear response signal, and stop or correct the process when a defect appears.
- Standardise the improved method. Document sequence, work content, quality checks and WIP limits. Review output, defects and replenishment daily.

Current versus future-state measures
These are project targets for the worked scenario, to be validated during a pilot, not guaranteed results.
| Measure | Current state | Future-state target |
|---|---|---|
| Lead time | 8 working days | 2.5 working days |
| Touch/process time | 13.4 min/garment | 12.5 min/garment |
| PCE | 0.33% | 1.04%* |
| First-pass yield | 88% | 96% |
| Mapped WIP | 3,200 garments | 1,000 garments |
| On-time delivery | 78% | 95% |
| Size-set changeover | 60 min | 25 min |
*Assuming the future state retains 11.7 minutes of value-added work and 2.5 working days of elapsed production time: 11.7 ÷ (2.5 × 450) × 100 = 1.04%. Use consistent time boundaries and definitions when comparing actual results.
5. Sequence the kaizen work over 90 days
| Wave | Owner(s) | Actions and measurable targets |
|---|---|---|
| Days 1–30: See and stabilise | VSM lead, production supervisor, quality lead | Confirm demand and takt; observe times and queues; establish baseline WIP, FPY and delivery; test a FIFO limit before sewing. |
| Days 31–60: Balance and pull | Sewing-line leader, industrial engineer, maintenance | Pilot the balanced line and point-of-use layout; introduce demand-based cutting release; target 30% lower WIP and changeover at or below 25 minutes. |
| Days 61–90: Standardise and sustain | Process owner, training lead, planning manager | Document standard work, daily checks and escalation rules; train operators; target 1,000 or fewer WIP pieces, 96% FPY and 95% on-time delivery. Review actuals against baseline and adjust. |

A value stream map is most useful when it becomes a management plan: measure the current state, test the future state, and assign owners to each improvement. Build the skills to lead that work: explore Lean 6 Sigma Hub’s self-paced, CSSC-accredited Lean Six Sigma training and certification courses, from White Belt foundations through advanced Belt programmes.
Kaizen. Kai-Care. Kai-Done. Lean Six Sigma