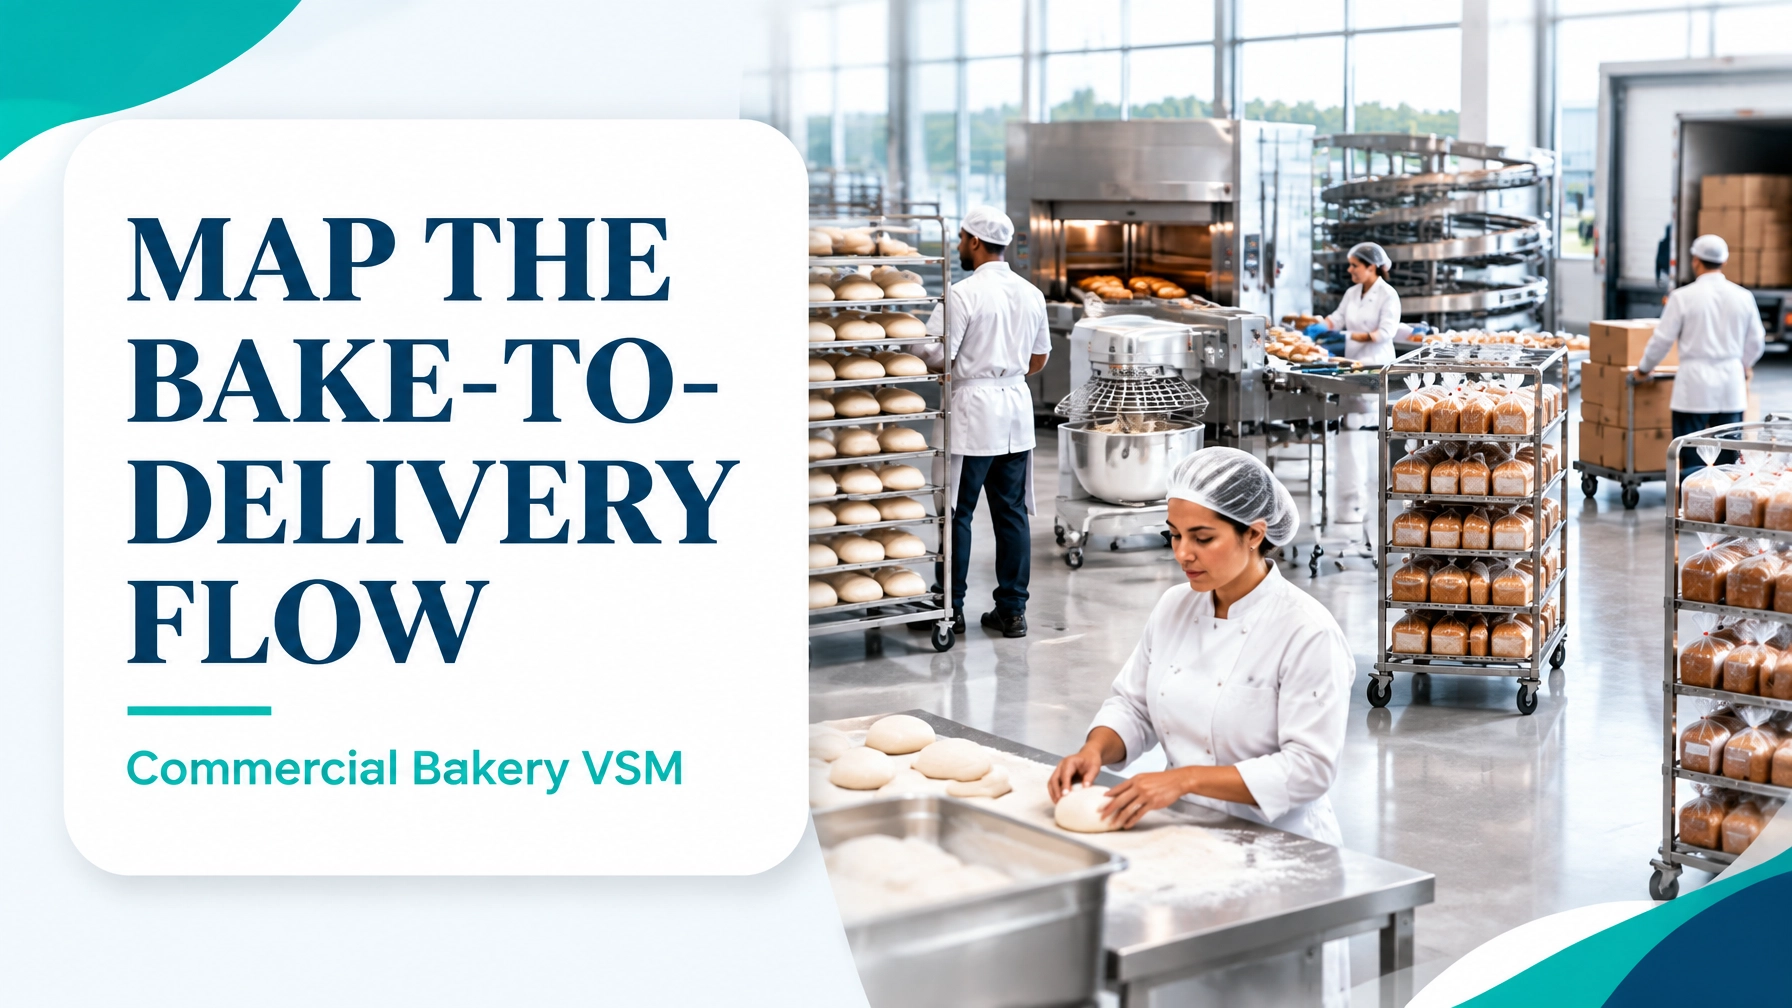
A commercial bakery can produce thousands of loaves per shift and still struggle with late deliveries, excessive work in process, stale returns and an exhausting overnight labour peak.
The issue is often not one isolated machine. It is the relationship between order consolidation, dough mixing, proofing, baking, cooling, slicing, packaging, rack building and route dispatch.
That is why Value Stream Mapping (VSM) is so effective. It shows the complete flow of material and information from customer order to delivered rack, revealing where value is created, where work waits and where the process loses capacity.
The Lean Enterprise Institute’s definition of Value Stream Mapping describes it as mapping the material and information flow required to bring a product from order to delivery. For a bakery, that means looking beyond oven performance and examining the entire system.
This worked example uses representative commercial bakery data. Actual results will vary by product mix, equipment and operating model, but the method is directly transferable.
1. Define the Bakery Value Stream Before Drawing the Map
Begin with a product family that follows a broadly consistent route, such as sliced white, wholemeal and sourdough loaves.
The value stream includes:
- Order consolidation and production scheduling
- Ingredient staging and dough mixing
- Dividing, moulding and panning
- Proofing
- Baking
- Cooling and depanning
- Slicing and packaging
- Rack build
- Route dispatch and customer delivery
The industrial bread process map from Flexco also illustrates how commercial bakeries connect ingredient storage, mixing, dough handling, proofing, baking, cooling, slicing, bagging and shipping.
The fundamental purpose of the map is not to create a visually impressive diagram. It is to understand how the whole system behaves.
Capture the three voices
A strong map balances:
- Voice of the Customer: delivery-window reliability, freshness, label accuracy and correct quantities.
- Voice of the Business: labour stability, asset utilisation, route economics and product margin.
- Voice of the Process: actual cycle times, queue lengths, downtime, yield and variation.
This prevents the team from improving one workstation while making the total bakery flow less responsive.

2. Current-State VSM: A Representative Commercial Bakery
Consider a wholesale bakery supplying supermarkets, cafés and food-service distributors.
Operating profile
- Two shifts: 8 hours each
- Planned breaks and sanitation: 1 hour per shift
- Net available production time: 15 hours, or 54,000 seconds per day
- Customer demand: 18,000 saleable loaves per day
- Average demand rate: 1,200 loaves per net production hour
- Oven capacity: 600 loaves per bake cycle
- Bake cycle: 24 minutes
- Proofing time: 42 minutes
- White-to-sourdough changeover: 38 minutes
- Current first-pass yield: 93.8%
- Current on-time delivery: 82%
- Scrap: 3.1%
- Stale returns: 4.6%
Takt time calculation
[
\text{Takt Time}=\frac{\text{Available Production Time}}{\text{Customer Demand}}
]
[
\text{Takt Time}=\frac{54,000\text{ seconds}}{18,000\text{ loaves}}=3.0\text{ seconds per loaf}
]
The bakery must release a saleable loaf every 3 seconds on average to meet demand.
This does not mean every process must handle one individual loaf every 3 seconds. Mixing, proofing and baking operate in batches. Their effective capacity must nevertheless support the same customer-driven rhythm.
Current-state data table
| Process step | Key operating data | Queue or delay |
|---|---|---|
| Order consolidation | 90 minutes administrative processing | 120 minutes before release |
| Dough mixing | 900-loaf batch every 18 minutes | 22 minutes |
| Proofing | 42-minute residence time | 30 minutes before entry |
| Baking | 600 loaves every 24 minutes; 84% availability | 16 minutes before oven |
| Cooling | 35-minute cooling time | 12 minutes |
| Slicing and packaging | 1,200–1,380 loaves/hour depending on SKU | 28 minutes |
| Rack build | 60 loaves per rack; 25 minutes per route wave | 18 minutes |
| Dispatch | Route loading and paperwork | 95 minutes before departure |
The current-state map contains approximately 463 minutes of elapsed lead time, while direct processing time is approximately 162 minutes. The gap, more than five hours, is primarily waiting, staging, batching, schedule delays and rehandling.
That is the opportunity.
3. Where the Overnight Bake Crunch Comes From
The overnight peak is usually created by several interconnected decisions:
- Orders are consolidated late, so production instructions reach the floor in large batches.
- Long runs are used to avoid changeovers, creating excess finished goods for some SKUs.
- Proofers and ovens are loaded unevenly, causing queues before constrained assets.
- Packaging waits for cooled product, then receives several racks at once.
- Rack building and dispatch are treated as downstream activities rather than part of the value stream.
- Labour is added reactively during the final route-building window.
This is a classic example of Waste (Muda). The eight DOWNTIME categories (defects, overproduction, waiting, non-utilised talent, transportation, inventory, motion and extra-processing) can all appear in this flow.
Work in Process (WIP) is particularly important. Excess dough pieces, racks waiting for the oven and cooled loaves awaiting packaging create storage, handling and freshness risk. WIP can make a busy bakery look productive while hiding poor flow.
The largest constraint is often not the step with the longest nominal cycle time. It is the step with the lowest reliable capacity after changeovers, downtime, variation and quality losses are included.
4. Analyse Phase: Confirm the Root Causes with Data
During the Analyse Phase of DMAIC, the team should move from visible symptoms to verified causes.
Useful tools include:
- Time Observation Sheets to record actual mixing, loading, proofing, cooling, packaging and rack-build times.
- Affinity Diagrams to organise operator observations, retailer feedback and delivery issues into natural categories.
- Box Plots to reveal spread, skewness and outliers in proofing, cooling and route-loading times.
- Pareto Charts to rank causes of scrap, stale returns and delivery misses.
- ANOVA to compare average proofing or cooling times across white, wholemeal and sourdough SKUs.
- Bartlett’s Test to assess whether group variances are sufficiently equal before applying a standard ANOVA assumption.
- X-bar and R Charts to monitor average loaf weight, bake temperature or packaging defects over time.
For example, a four-week study might show these average proofing times:
| SKU | Average proofing time | Standard deviation |
|---|---|---|
| White | 39 minutes | 3.2 minutes |
| Wholemeal | 43 minutes | 4.1 minutes |
| Sourdough | 51 minutes | 6.8 minutes |
An ANOVA can test whether the differences are statistically significant rather than simply random variation. If sourdough has a materially different proofing profile, it should not be forced into the same sequencing logic as standard white bread.
Measurement quality also matters. Bias in temperature probes, scales or time stamps can make a process appear more stable than it is. A practical Measurement System Analysis should confirm that the data reflects the process accurately.
5. Future-State Design: Create Flow Around the Constraint
A future-state VSM should be designed around customer demand, reliable capacity and controlled buffers.
In this example, the pacemaker process is the combined packaging and rack-build schedule, because it determines what must be ready for each route departure.
Proposed future-state changes
- Level the order release into smaller, timed production increments rather than one large overnight schedule.
- Reduce white-to-sourdough changeover from 38 minutes to 18 minutes using SMED principles, external setup and standardised settings.
- Establish a controlled supermarket of cooled product between cooling and packaging.
- Use Andon-style visual signals for oven delays, proofer deviation, packaging stops and missing materials.
- Introduce Autonomation (Jidoka) at critical points so equipment detects weight, temperature or packaging faults and stops before producing a large defect batch.
- Sequence products to reduce allergen, dough-temperature and packaging-material disruption.
- Synchronise rack build with route departure times rather than building finished racks as early as possible.
- Use daily Agile improvement huddles and short kaizen experiments to test one change at a time.
Future-state performance target
| Measure | Current state | Future-state target |
|---|---|---|
| Daily saleable throughput | 17,300 loaves | 19,200 loaves |
| First-pass yield | 93.8% | 97.8% |
| Scrap | 3.1% | 1.4% |
| Stale returns | 4.6% | 1.8% |
| On-time delivery | 82% | 96% |
| Changeover | 38 minutes | 18 minutes |
| Lead time | 463 minutes | 295 minutes |
| Overnight peak labour | 26 people | 18 people |
The future state does not eliminate every buffer. It makes buffers visible, intentional and sized to protect flow.

6. Throughput, Yield and the Business Case
Throughput is the number of saleable loaves delivered per period. It is not the same as oven output.
If the bakery bakes 19,200 loaves but loses 2.2% to defects, damage, underweight product and stale returns, customer-ready output is lower than the production counter suggests.
A simple business case might calculate:
- Additional saleable output: 1,900 loaves per day
- Annual operating days: 300
- Additional annual saleable loaves: 570,000
- Stale-return reduction: 2.8 percentage points
- On-time delivery improvement: 14 percentage points
- Overnight labour reduction: 8 people during the peak window
The financial value should include recovered product, reduced overtime, improved route utilisation and fewer retailer service failures.
Track both First Pass Yield and Rolled Throughput Yield. First Pass Yield shows how much output passes a specific step without rework. Rolled Throughput Yield shows the cumulative probability that a loaf moves through every step defect-free.
7. Sequence Kaizen Without Disrupting Production
A practical improvement sequence is:
- Week 1: Validate the product family, demand profile and measurement system.
- Week 2: Complete the current-state map at the gemba using real timestamps.
- Week 3: Confirm the bottleneck with capacity, downtime and queue data.
- Week 4: Run a changeover reduction event for white to sourdough.
- Week 5: Pilot level loading and route-based rack build.
- Week 6: Install visual controls, Andon signals and a daily control board.
- Week 7: Review yield, stale returns, throughput and on-time delivery.
- Week 8: Standardise the improved process and begin the next DMAIC cycle.
Agile complements Lean Six Sigma here because its flexible, iterative approach supports short experiments, rapid feedback and cross-functional collaboration. Lean Six Sigma provides the disciplined measurement and statistical validation; Agile provides the cadence for testing and learning.

Conclusion: Map the Whole Flow, Then Protect the Customer Promise
A commercial bakery does not improve by maximising every individual machine. It improves by aligning value, capacity, quality and delivery across the complete value stream.
When order consolidation, dough mixing, proofing, baking, cooling, slicing, packaging, rack build and dispatch are mapped together, the overnight labour peak becomes a process-design issue rather than an unavoidable tradition.
For professionals who want to lead this type of transformation, Lean 6 Sigma Hub’s CSSC-accredited online Lean Six Sigma training provides practical tools, case studies and DMAIC guidance. The Green Belt programme is especially relevant for practitioners who need to analyse data, lead improvement projects and convert future-state maps into measurable results.
Start with the current state, calculate your takt time, validate the constraint and build a future state that protects both freshness and delivery reliability. Pursue Lean Six Sigma training or professional certification to lead the work with confidence.
Kaizen. Kai-Care. Kai-Done. ( Lean Six Sigma)