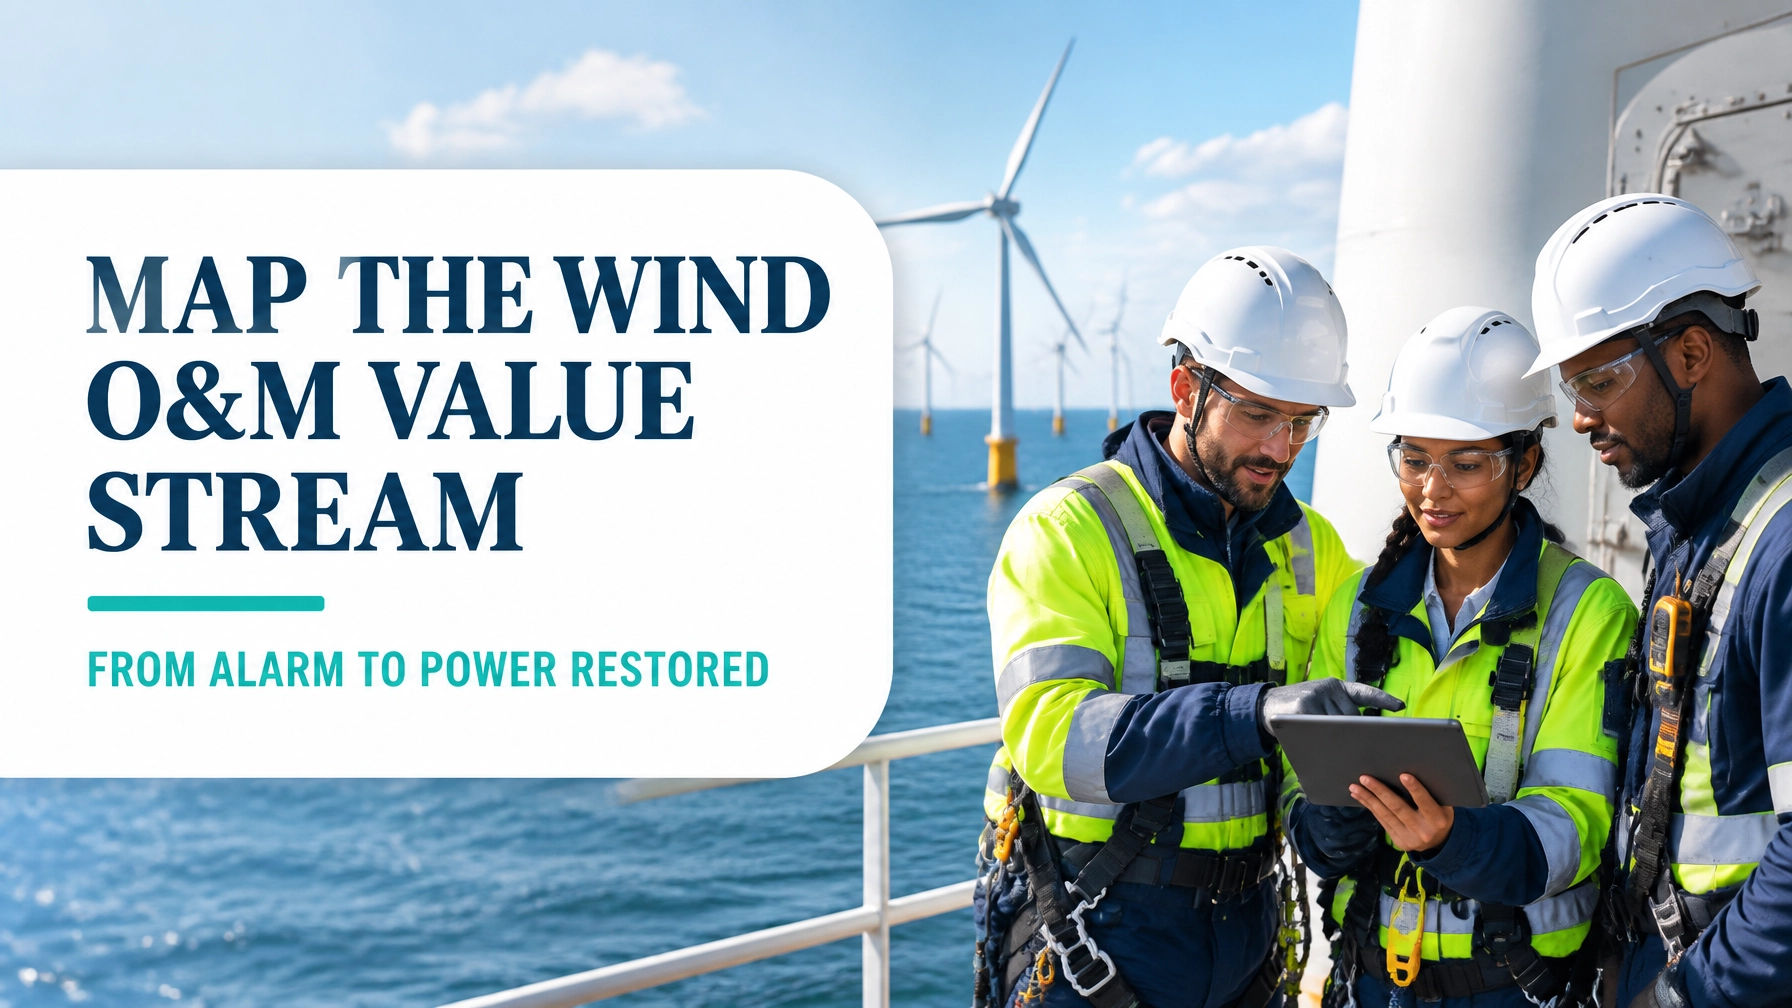
In wind farm operations and maintenance, the most expensive delay is rarely the physical repair itself. The greater loss often sits between the SCADA alarm, approval, diagnosis, spare-parts decision, vessel or crane booking, weather window, and final recommissioning.
Value Stream Mapping (VSM) makes this complete flow visible. Instead of measuring only technician “wrench time,” it connects information flow, material flow, access logistics, safety controls, and energy loss from the first turbine fault alarm to power exported back to the grid.
This guide uses an industry-informed worked example: a 68-turbine, 210 MW offshore wind farm facing an unplanned gearbox failure. The figures are illustrative, but they reflect the ranges and constraints discussed in offshore wind reliability and O&M research, including the influence of vessel availability, weather, spares, and repair strategy. See the AWEA Operations and Maintenance Recommended Practices, wind turbine reliability research, and studies of jack-up vessel chartering.
Why the Wind O&M Value Stream Matters
The customer of the process is not only the asset owner. The value stream must satisfy several voices:
- Voice of the Customer: safe, reliable and predictable renewable power.
- Voice of the Business: high availability, controlled OPEX and profitable energy export.
- Voice of the Process: data showing whether alarms, repairs and commissioning meet required standards.
- Voice of the Technician: complete work packages, correct parts and safe access.
- Voice of the Grid: dependable generation and accurate outage information.
In Lean terms, value is created when the turbine is safely restored and capable of exporting energy. Activities such as duplicate data entry, waiting for approval, repeated diagnosis, searching for parts and queuing for a crane do not directly restore power. Some controls are necessary, but they should be designed to protect value rather than interrupt flow.
A value stream includes every step from beginning to end, including material flow and information flow. That is why a turbine VSM must include SCADA, the CMMS, planners, procurement, warehouses, vessel coordinators, technicians, OEMs, grid representatives and finance.

Worked Case: 68 Turbines, 210 MW and a Gearbox Failure
Assume the farm has:
- 68 turbines
- 210 MW installed capacity
- Average turbine rating of approximately 3.09 MW
- Expected average capacity factor of 42%
- Electricity value of $75 per MWh
- Current technical availability of 96.2%
- MTBF for corrective events of 3,900 operating hours
- Corrective MTTR of 52 hours, excluding major crane and vessel queues
- First-time-fix rate of 68%
- Gearbox replacement requiring a heavy-lift vessel or jack-up crane
At a 42% capacity factor, one turbine would be expected to produce approximately:
3.09 MW × 42% = 1.30 MWh per hour
Therefore, one hour of downtime on one turbine represents approximately 1.30 MWh of lost production, or around $98 in gross energy revenue at $75/MWh. A 240-hour outage would represent approximately 312 MWh and $23,400 in gross energy value before considering contractual, balancing or renewable-certificate impacts.
At farm level, the same 240-hour outage across three turbines would represent approximately 936 MWh, worth about $70,200.
| Performance measure | Current-state example | Future-state target |
|---|---|---|
| Technical availability | 96.2% | 97.5% |
| Corrective MTTR | 52 hours | 34 hours |
| First-time-fix rate | 68% | 85% |
| Major-component crane/vessel lead time | 60 days spot charter | 14-day framework slot |
| Weather-related waiting | 25–40% of campaign hours | Below 20% through seasonal planning |
| Critical-spares holding cost | $2.4 million | $1.8 million with segmentation |
| Gearbox alarm-to-return scenario | 76.5 days | 16.9 days with pre-planning |
The target is not to eliminate every delay. It is to separate necessary work from avoidable waiting, rework, approval queues, excess work in process and poor scheduling.
Current-State VSM: Where the Crane Queue Forms
A representative gearbox failure may follow this path:
- SCADA detects a high-temperature or vibration alarm.
- The control room validates the alarm and attempts a remote reset.
- An approval is raised for technician dispatch.
- A technician travels to the turbine and performs diagnosis.
- Engineering confirms gearbox failure.
- Procurement searches for a replacement unit.
- The warehouse prepares a spare-parts kit.
- The marine team requests a vessel or jack-up crane.
- The farm waits for a suitable weather window.
- The gearbox is removed and replaced.
- The turbine is tested, recommissioned and returned to service.
- Energy export resumes.
| Current-state activity | Typical elapsed time |
|---|---|
| Alarm validation and remote reset | 6 hours |
| Dispatch approval and work-order creation | 24 hours |
| Access, travel and diagnosis | 18 hours |
| Engineering confirmation | 12 hours |
| Replacement gearbox sourcing | 504 hours |
| Crane or vessel queue | 960 hours |
| Weather-window waiting | 144 hours |
| Replacement execution | 168 hours |
| Commissioning and grid verification | 12 hours |
| Total elapsed time | 1,848 hours / 77 days |
The physical gearbox replacement consumes only 168 hours of this flow. The remaining time is dominated by information delays, procurement, vessel access and weather. This is a classic example of waiting and a capacity bottleneck: the crane is a constrained resource that limits the throughput of major repairs across the entire farm.
A current-state VSM should also show:
- Approval loops and escalation points
- Duplicate SCADA-to-CMMS data entry
- Missing fault-code information
- Parts waiting for inspection or release
- Technicians waiting for permits or access
- Vessels waiting offshore for safe conditions
- Rework caused by incomplete job plans
- Work in process, including open alarms and unclosed work orders
A Wind Systems Magazine case study demonstrates the value of mapping technician movement and maintenance procedures. Reorganising work around defined responsibilities reduced man-hours per turbine by more than 50% in that reported application.
Analyse the Causes, Not Just the Delay
The Analyse Phase of DMAIC converts the map into evidence. A Black Belt or experienced Green Belt can combine:
- Pareto analysis of failure modes and downtime hours
- Box plots comparing repair duration by turbine model, crew and season
- Attribute data such as Pass/Fail commissioning results
- Average repair time as a baseline for performance
- ANOVA to compare mean MTTR across suppliers, teams or weather seasons
- Bartlett’s Test to check whether group variances are sufficiently equal before ANOVA
- X-bar and R charts to monitor average repair duration and range
- Z-scores to identify unusually long outages
- FMEA to prioritise gearbox, generator, converter and pitch-system risks
- An Affinity Diagram to organise technician, planner and supplier observations into natural categories
Measurement reliability matters. If SCADA timestamps, CMMS closure times and vessel logs use different definitions, bias can distort the result. A process may appear to improve simply because waiting time has been excluded from MTTR.
The fundamental relationship is Y = f(x): return-to-service time is the outcome, while inputs include alarm quality, diagnosis accuracy, approval time, spare availability, vessel access and weather. Control the critical inputs and the outcome becomes more predictable.
Future-State Design: Build Flow Before the Failure
The future-state map should redesign the process around early decisions and prepared capacity.
1. Create a standard alarm pathway
Use autonomation, or Jidoka, by allowing intelligent systems to detect abnormal vibration, temperature or oil-quality signals and trigger a defined response. An Andon-style visual signal can show the alarm status, owner, escalation time and next action in the control room.
Remote reset attempts should be governed by a safe decision tree:
- Reset only within defined operating limits.
- Escalate immediately when the same alarm repeats.
- Attach diagnostic data automatically to the CMMS work order.
- Assign one accountable owner for the next decision.
2. Segment spares by risk and economics
Not every gearbox should be held at every port. Use failure probability, supplier lead time, turbine criticality and lost-energy exposure to classify inventory.
A $1.8 million future holding cost may be preferable to a $2.4 million stock position if the farm improves supplier response, shares strategic spares regionally and maintains a pre-approved logistics plan. The decision should include break-even analysis: compare carrying cost with expected lost revenue, charter costs and failure probability.
3. Replace approval queues with clear governance
Approval supports safety, compliance and financial control. However, unnecessary sequential approvals create a bottleneck. Establish thresholds:
- Technician dispatch: pre-approved within defined alarm criteria.
- Standard spare release: delegated authority.
- Major-component replacement: formal engineering and commercial checkpoint.
- Emergency charter: predefined escalation route.
This preserves governance without requiring every decision to move through one manager.
4. Reserve crane capacity through campaigns
A spot-chartered jack-up vessel may require approximately 60 days to mobilise in some planning models. A framework agreement or campaign slot can reduce practical access time to around 14 days, depending on vessel availability and contract structure.
The aim is not simply to book a crane faster. It is to batch compatible work, pre-kit components, align technicians and plan around seasonal weather windows. This increases throughput, measured as completed turbine interventions per campaign period, while reducing queue time.

Kaizen Sequencing for the New Value Stream
A practical improvement sequence is:
- Define: establish the business case using lost MWh, revenue exposure, safety requirements and availability targets.
- Measure: capture timestamps from SCADA alarm to energy export, including every waiting interval.
- Analyse: use Pareto, FMEA, ANOVA, box plots and root-cause analysis to identify the vital few causes.
- Improve: pilot automatic work-order creation, standard diagnostic kits, pre-approved dispatch and campaign-based vessel planning.
- Control: monitor availability, MTBF, MTTR, first-time-fix rate, MWh lost per event, approval time and crane utilisation.
- Standardise: update job plans, training, control plans, supplier agreements and visual management boards.
An Agile approach complements this work. Instead of waiting for a perfect enterprise design, an O&M team can run two-week improvement cycles: test a new alarm rule, review results, adjust the work package and expand only after evidence supports the change.
The control plan should protect zero defects in critical steps: correct gearbox, correct lifting plan, correct torque sequence, correct software configuration and successful load testing before export. Yield can be measured through first-time-fix and commissioning pass rates, while rolled throughput yield tracks the probability that the complete repair passes through every stage without rework.
Control the Recovery, Not Just the Repair

A successful future-state VSM should show more than a shorter repair. It should demonstrate:
- 97.5% availability rather than 96.2%
- MTTR reduced from 52 to 34 hours
- First-time-fix improved from 68% to 85%
- Fewer open alarms and overdue work orders
- Lower critical-spares holding cost
- Reduced crane waiting and weather exposure
- More reliable energy export
White Belts can support basic process observation and DMAIC awareness. Yellow Belts can collect data and support Kaizen events. Green Belts can lead the VSM and analysis, while Black Belts lead complex cross-functional projects and mentor improvement teams.
To build these capabilities, explore Lean 6 Sigma Hub’s CSSC-accredited Green Belt training or review the full range of online Lean Six Sigma courses. The practical, self-paced format includes process mapping, data collection, root-cause analysis, FMEA, hypothesis testing and control planning.
Map the complete flow, quantify every hour of waiting, and train your team to turn turbine downtime into controlled, measurable recovery. Pursue Lean Six Sigma certification and apply the method where energy, safety and operational performance matter most.
Kaizen. Kai-Care. Kai-Done. ( Lean Six Sigma)