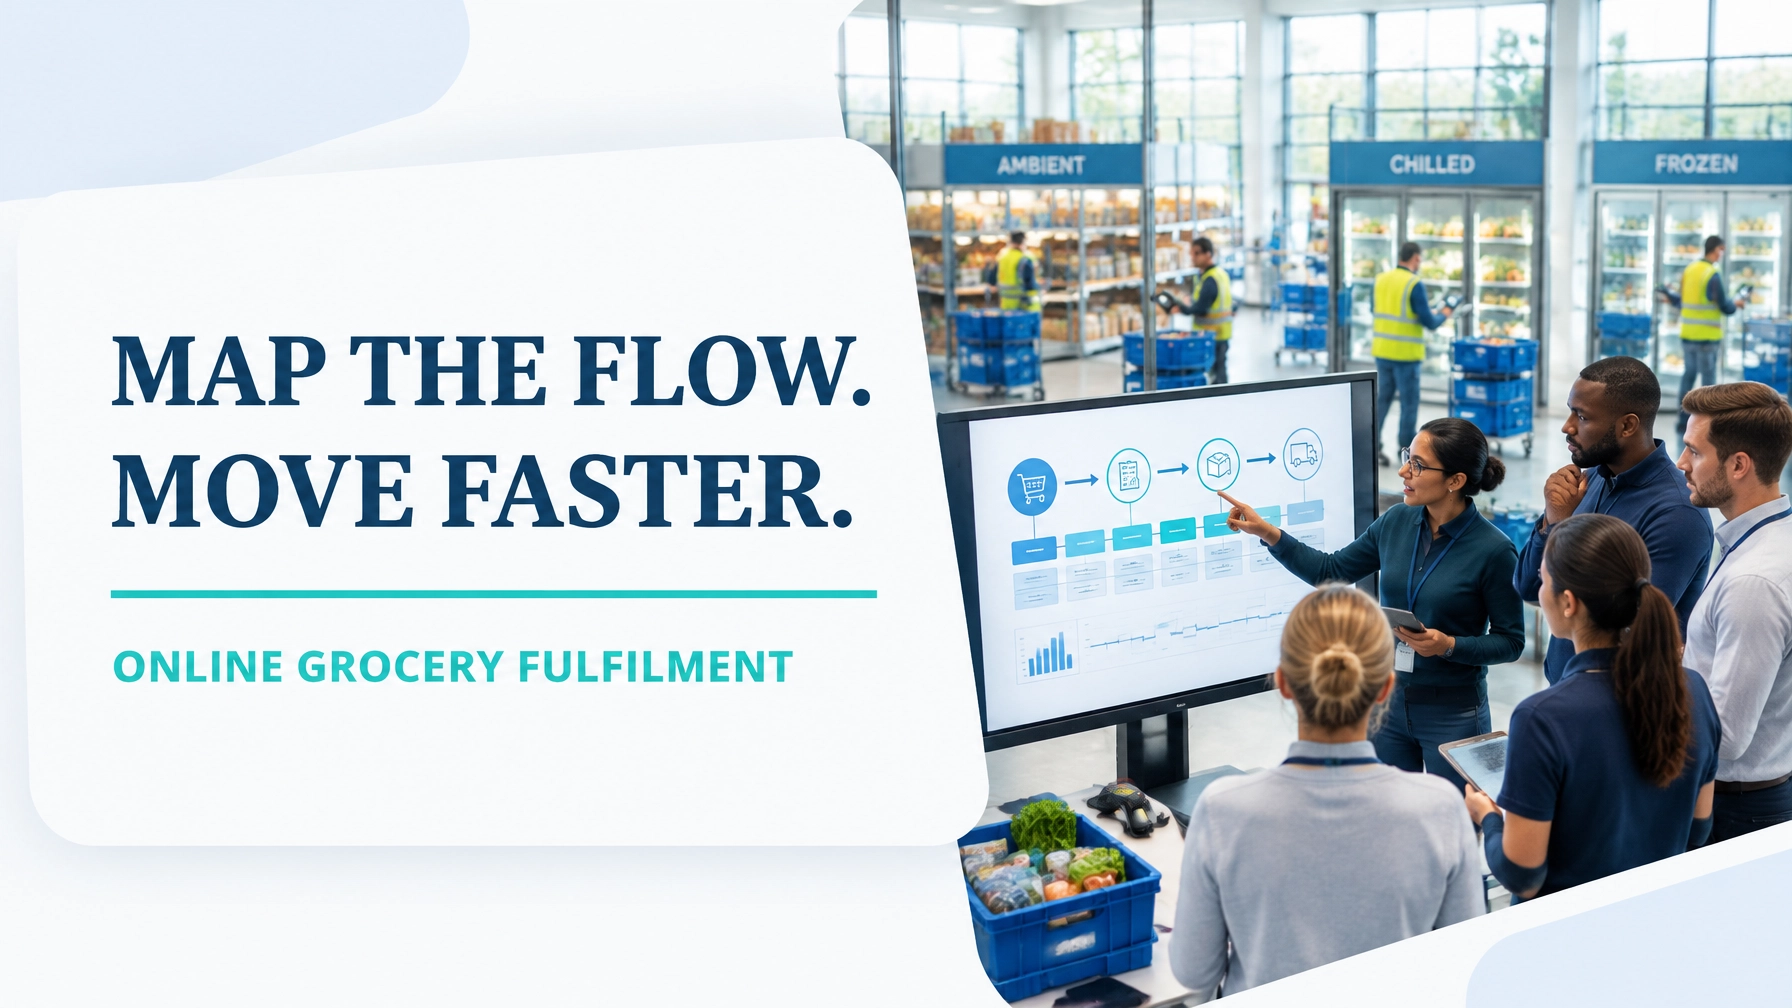
Online grocery fulfilment is a time-sensitive value stream with very little tolerance for delay. A customer may place an order in seconds, yet the fulfilment centre must coordinate inventory availability, wave planning, ambient picking, chilled and frozen handling, substitutions, packing, staging, van loading and dispatch within a narrow delivery window.
The fundamental purpose of Value Stream Mapping (VSM) is to make the entire flow visible. Rather than optimising one isolated activity, such as pick rate or packing speed, the team examines how material, information and decisions move from order drop to a doorstep-ready tote.
The Lean Enterprise Institute defines Value Stream Mapping as a method for seeing the complete flow required to deliver a product or service. In an online grocery operation, this perspective is essential because local improvements can easily create downstream congestion. Increasing picking speed, for example, may simply produce more totes waiting for substitution decisions, temperature-controlled staging or van loading.
This deep dive uses an illustrative online grocery fulfilment centre to show how a current-state map can expose hidden waiting, quantify flow performance and guide a practical 90-day improvement programme.
1. Scope Selection: Define the Grocery Value Stream Before Mapping
A useful VSM begins with a clear product or service family. Mapping every order type at once creates excessive complexity and makes performance comparisons less reliable.
For this example, the scope is:
- Start point: Customer order accepted and delivery or click-and-collect slot confirmed.
- End point: Complete order packed, verified, temperature-zoned, staged and ready for loading or customer collection.
- Product family: Standard online grocery orders containing ambient, chilled and frozen items.
- Channels: Home delivery and click-and-collect.
- Excluded from the primary map: Last-mile driving time, although dispatch performance and customer feedback remain important control metrics.
This scope was chosen because both delivery and click-and-collect orders share the same internal fulfilment flow. They enter through the same digital order system, move through similar wave plans and pick paths, and require the same substitution, packing and quality checks.
The team should map the flow during both normal and peak operating periods. A quiet mid-morning observation may suggest that capacity is adequate, while the evening order peak reveals congestion between wave release, chilled picking and dispatch staging.
The mapping team should include:
- An operations manager or value stream owner.
- A planning or wave-release specialist.
- Ambient, chilled and frozen zone leaders.
- Pickers and packers who perform the work.
- A substitution or customer-service representative.
- A dispatch or transport coordinator.
- A systems analyst responsible for the warehouse management system.
- A Lean Six Sigma practitioner, such as a Green Belt or Black Belt.
For governance, the Lean 6 Sigma Hub Project Scope Boundary Calculator can support early agreement on what belongs inside the project.
2. Current-State Map: The Worked Fulfilment Example
Assume the fulfilment centre processes 1,200 orders per day, averaging 15.5 order lines per order, or approximately 18,600 lines daily.
The facility operates with:
- 4 planners and team leaders.
- 38 pickers across ambient, chilled and frozen zones.
- 12 pack and verification operators.
- 6 staging and dispatch operators.
- 8 delivery vans during the primary evening dispatch window.
- Approximately 30% home delivery orders and 70% click-and-collect orders.
- A 30-minute customer delivery or collection promise window.
The current-state flow is as follows.
| Process step | Current performance | Waiting, WIP or risk |
|---|---|---|
| Order drop to wave release | 42-minute average; 68 minutes at peak | Orders accumulate before planning |
| Wave planning | 4 planners release batches every 30 minutes | Large batches create uneven workload |
| Wave release to pick start | 18-minute average | Pickers wait for assignment or replenishment |
| Ambient picking | 118 lines per labour hour | Fast movers create aisle congestion |
| Chilled picking | 92 lines per labour hour | Replenishment and shared equipment delays |
| Frozen picking | 76 lines per labour hour | Small zone and limited equipment |
| Overall blended pick rate | 104 lines per labour hour | Zone imbalance reduces effective throughput |
| Substitution handling | 8.6% of orders affected; 11-minute average decision wait | Approval loops delay pack completion |
| Packing and verification | 6.8 minutes per order | Rechecks caused by pick exceptions |
| Temperature-zone staging | 26-minute average | Early-completed orders wait for dispatch |
| Van loading or collection staging | 14 minutes per route or collection batch | Missing totes trigger searching and rework |
| Dispatch performance | 91.8% on-time in-full | Late orders and partial orders affect customer experience |
Reading the information flow
The customer order enters the order management platform. Every 30 minutes, a planner creates a wave based primarily on promised delivery time and total order volume.
The wave is then sent to the warehouse management system, which generates pick assignments. However, the release logic does not sufficiently account for:
- Chilled and frozen zone capacity.
- Current replenishment status.
- Substitution workload.
- Tote availability.
- Van loading sequence.
- The remaining time before the dispatch window.
This creates a classic information-flow problem. The order system knows the promise time, while the warehouse system knows the pick status. The dispatch team knows the vehicle schedule. Yet the three signals are not always synchronised.
Reading the physical flow
A typical order begins in the ambient zone, then moves through chilled and frozen picking before reaching a consolidation or packing point. When one zone completes early, the tote waits for the slowest zone.
For example, a 16-line order might contain:
- 9 ambient lines.
- 5 chilled lines.
- 2 frozen lines.
The ambient portion may be picked in 5 minutes, while the frozen portion takes 9 minutes because the picker waits for equipment access. The order then spends another 11 minutes waiting for a substitution decision on a chilled product. The fastest process step therefore does not determine order completion; the constraint and the exception loop do.
A representative current-state lead-time ladder is:
- Order drop to wave release: 42 minutes
- Wave release to pick start: 18 minutes
- Picking and zone consolidation: 46 minutes
- Substitution decision and exception handling: 11 minutes
- Packing and verification: 6.8 minutes
- Staging before load or collection: 26 minutes
- Loading or collection handoff: 14 minutes
This produces approximately 164.8 minutes of elapsed time from order drop to dispatch-ready status. With additional queue variation during the evening peak, the observed average is 178 minutes, and the 90th percentile reaches 246 minutes.
Only a fraction of this elapsed time is direct processing. The remainder is waiting, searching, moving, batching or resolving exceptions.

3. The Eight DOWNTIME Wastes in Online Grocery Fulfilment
The current-state map should identify the eight forms of DOWNTIME waste in the context of the actual operation.
Defects
Defects include wrong products, incorrect quantities, damaged packaging, missing items and unsuitable substitutions. At a 97.2% line-level pick accuracy, a centre processing 18,600 lines daily may create approximately 521 line-level errors per day.
Overproduction
Picking orders too early creates finished totes that wait in chilled or ambient staging. The operation has completed work before the downstream process is ready to use it. This increases storage demand and raises the risk of temperature, freshness or sequencing problems.
Waiting
Waiting appears between order drop and wave release, wave release and pick start, pick completion and substitution approval, and pack completion and van loading. In this example, waiting represents the largest component of total lead time.
Non-utilised talent
Pickers often understand why aisles become congested, which SKUs require frequent replenishment and where substitutions create rework. If this knowledge is not captured through structured improvement routines, the organisation loses practical process intelligence.
Transportation
Transportation waste includes excessive movement of totes between temperature zones, unnecessary transfers to staging lanes and repeated movement when a tote is placed in the wrong dispatch position.
Inventory
Work in Process includes open orders, incomplete totes, packed orders awaiting missing zones and completed totes waiting for a route. Excess WIP hides flow problems and increases the number of items the team must track.
Motion
Motion waste is particularly visible in pick paths. Backtracking, crossing aisles, searching for products and walking to shared equipment reduce productive pick time. A picker may record 118 lines per hour while spending a substantial portion of the shift travelling rather than selecting products.
Extra processing
Extra processing includes duplicate checks, manual transcription, repeated substitution approvals, unnecessary tote relabelling and rechecking caused by poor information visibility.
A useful Process Cycle Efficiency Calculator can help the team compare actual processing time with total elapsed time.
4. Analytical Lenses for a Stronger VSM
VSM provides the flow view. Lean Six Sigma tools add statistical discipline and help the team distinguish symptoms from causes.
- Value is defined by the customer’s willingness to pay or the service outcome the customer expects: an accurate, complete, fresh order delivered or made available within the promised window.
- The Value Stream includes every material and information step from order acceptance through fulfilment.
- Voice of the Customer translates feedback such as “my groceries arrived late” into CTQs such as on-time fulfilment above 97%, substitution acceptance above 90% and temperature compliance.
- Voice of the Business adds priorities such as cost per order, labour utilisation, van capacity and profitability.
- Voice of the Process uses actual data to show whether the process can meet those expectations consistently.
- Y = f(x) reminds the team that order performance, the Y, depends on controllable inputs such as wave size, slotting, replenishment timing, staffing and substitution rules.
- Variation must be separated into common-cause variation, inherent in the current system, and special-cause variation, created by an unusual event such as a system outage or refrigeration issue.
- An Average (Mean) provides a baseline, but the median and percentile values should also be reviewed because peak fulfilment data is rarely symmetrical.
- A Box Plot can compare order lead times by dispatch window and reveal spread, skewness and outliers.
- A Z-Score can identify unusually delayed orders by measuring how many standard deviations each order sits from the mean.
- Attribute Data, such as Pass/Fail, Correct/Incorrect or Accepted/Rejected substitution, supports quality analysis when numerical measurements are unavailable.
- ANOVA can compare the mean pick time across ambient, chilled and frozen zones or across different wave sizes.
- Bartlett’s Test can assess whether the variances of those groups are sufficiently equal before applying ANOVA.
- An X-bar Chart, used alongside an R chart, can monitor average pick time and detect shifts or trends.
- An Affinity Diagram can organise a large volume of picker, packer and driver observations into meaningful categories based on natural relationships.
- Agile practices complement VSM by enabling small, iterative experiments, for example, testing a new wave interval for one dispatch window before scaling it.
- Approval checkpoints protect governance, but excessive approval loops create bottlenecks. Substitution decisions should have clear rules and delegated authority.
- Andon visual signalling can alert the team in real time when a zone is missing stock, a tote is incomplete or a dispatch order is at risk.
- Autonomation (Jidoka) enables equipment or software to detect an abnormal condition and respond, for example, stopping a tote from advancing when a required temperature-zone component is missing.
- A Time Observation Sheet records actual travel, search, pick, wait and handoff times so the team can separate value-added from non-value-added work.
- Takt Time establishes the required fulfilment rhythm by dividing available operating time by customer demand. If 600 orders must be completed in a 10-hour operating window, the effective takt is one order every minute.
- Throughput measures completed orders or lines per period, while pick rate measures only one part of the flow.
- Waiting is a signal of scheduling, capacity or information imbalance, not simply an individual productivity issue.
- Theory of Constraints directs attention to the current limiting factor. If frozen picking limits complete-order release, improving ambient picking alone will not raise total throughput.
- Break-Even Analysis can determine whether investment in scanners, automation or additional chilled capacity is justified by labour savings, reduced refunds and improved order retention.
- The Business Case should connect the VSM findings to customer outcomes, financial benefits, operational risk and strategic priorities.
These tools are most effective when used to answer a specific process question rather than added as isolated analysis.
5. Future-State Design: Create Flow From Order to Ready Tote
The future-state map should not merely shorten individual task times. It should establish a controlled pull system with fewer queues, clear exception ownership and a stable dispatch rhythm.

1. Replace large batches with levelled micro-waves
Move from 30-minute batch releases to smaller, more frequent releases aligned with dispatch demand. A pilot could release 10–12 orders every 10 minutes, subject to available zone capacity.
The wave algorithm should consider:
- Customer promise time.
- Number of ambient, chilled and frozen lines.
- Current zone workload.
- Replenishment status.
- Substitution risk.
- Tote and staging availability.
- Route loading sequence.
This applies heijunka, or workload levelling, to reduce peaks and improve predictability.
2. Redesign pick paths and slotting
Use demand data to relocate the highest-frequency SKUs to accessible pick faces. Separate fast movers from replenishment-heavy items where practical, and create clear one-way routes in congested aisles.
A pilot should measure:
- Travel metres per order.
- Lines picked per labour hour.
- Aisle obstruction events.
- Picker crossovers.
- Replenishment-related waiting.
The target is not simply a higher individual rate. The objective is a higher complete-order throughput without creating downstream WIP.
3. Balance ambient, chilled and frozen capacity
The slowest zone frequently determines when an order becomes complete. Establish zone-specific takt requirements and dynamically rebalance labour during peak periods.
For example:
- Ambient target: 135 lines per labour hour.
- Chilled target: 115 lines per labour hour.
- Frozen target: 100 lines per labour hour.
These are illustrative targets and should be validated through time observation and capacity analysis rather than imposed without measurement.
4. Standardise substitutions
Create a substitution matrix based on product category, pack size, dietary requirements, price tolerance and customer preferences. Pre-authorise suitable alternatives where the customer has provided consent.
Use a clear escalation rule:
- System proposes an approved equivalent.
- Picker confirms availability and condition.
- Customer preference is checked automatically.
- Only exceptions move to manual approval.
- The final substitution is recorded for future demand and inventory analysis.
This reduces an average 11-minute approval delay and improves substitution acceptance.
5. Introduce FIFO staging and visual Andon signals
Create clearly labelled FIFO lanes for ambient, chilled and frozen totes. Each tote should have a visible status:
- Picking.
- Exception.
- Ready for consolidation.
- Ready for pack.
- Ready for load.
- Held for quality check.
An electronic Andon board can identify orders at risk of missing their dispatch window. The escalation trigger might be set at 20 minutes before route departure.
6. Sequence loading around the route
The future state should connect tote completion with vehicle loading. Totes should be staged in route and drop sequence, not simply in the order they finish packing.
This reduces searching, repeated movement and last-minute loading decisions. It also creates a stronger pull signal: the next required tote is visible, and the team can act before the loading window becomes constrained.
7. Build control into the process
The future-state map should include:
- Standard work for each zone.
- Daily review of OTIF and substitution accuracy.
- X-bar and R chart monitoring for pick and pack times.
- Weekly Pareto analysis of defects.
- Escalation rules for missing inventory and equipment.
- A documented response when performance moves outside control limits.
The Lean 6 Sigma Hub Kaizen resources provide a useful foundation for structuring these improvement cycles.
6. Current-State Versus Future-State Performance
The following targets are illustrative projections for the pilot area. They should be confirmed through a measured baseline, controlled trials and a defined control plan.
| Metric | Current state | 90-day future-state target | Improvement logic |
|---|---|---|---|
| Order drop to dispatch-ready lead time | 178 minutes | 104 minutes | Levelled waves and reduced staging |
| 90th percentile lead time | 246 minutes | 142 minutes | Fewer peak queues and faster exceptions |
| Blended lines picked per labour hour | 104 | 132 | Slotting and zone balancing |
| Pick accuracy | 97.2% | 99.0% | Standard work, scanning and clearer locations |
| Substitution rate | 8.6% | 6.0% | Better inventory visibility and replenishment |
| Substitution decision time | 11 minutes | 3 minutes | Equivalence matrix and delegated approval |
| On-time in-full fulfilment | 91.8% | 97.0% | Dispatch risk signals and route sequencing |
| Cost per order | $8.40 | $6.95 | Less rework, travel, waiting and overtime |
| Average staging WIP | 74 orders | 35 orders | Pull-based release and FIFO lanes |
The target cost reduction of $1.45 per order would represent approximately $1,740 per day at 1,200 orders, before considering retention, refund reduction or improved capacity.
7. The 90-Day Kaizen Sequencing Plan
A disciplined implementation sequence prevents the operation from launching too many changes simultaneously.
Days 1–30: Stabilise and Measure
Owners: Fulfilment manager, Black Belt, zone leaders and systems analyst.
Actions:
- Confirm the current-state map through direct observation.
- Establish operational definitions for lead time, pick accuracy, substitution rate and OTIF.
- Introduce a daily visual performance board.
- Capture time observations for 100 orders across peak and off-peak periods.
- Label staging lanes and apply FIFO rules.
- Create a Pareto of pick errors and substitution causes.
- Test an Andon escalation trigger for orders at risk.
Targets:
- Baseline data completeness above 95%.
- Staging WIP reduced by 15%.
- At-risk orders visible at least 20 minutes before dispatch.
- Pick-path observations completed across all three temperature zones.
Days 31–60: Pilot the Future-State Flow
Owners: Operations manager, planning lead, Yellow Belts and IT product owner.
Actions:
- Run 10-minute micro-waves for one dispatch window.
- Re-slot the top 100 fast-moving SKUs.
- Introduce the substitution equivalence matrix.
- Assign a dedicated exception owner during peak hours.
- Trial route-sequenced staging for two delivery routes.
- Compare pilot and control windows using lead-time and accuracy data.
- Use ANOVA where appropriate to compare mean performance across zones or wave types.
Targets:
- Blended pick rate increased to 120 lines per labour hour.
- Substitution decision time reduced to 5 minutes.
- Pick accuracy improved to 98.4%.
- On-time in-full fulfilment improved to 94.5%.
- Order lead time reduced below 135 minutes.
Days 61–90: Scale and Control
Owners: Value stream owner, Black Belt, finance partner and senior sponsor.
Actions:
- Extend levelled wave planning to all high-volume windows.
- Scale proven slotting changes across the fulfilment centre.
- Integrate staging status with dispatch dashboards.
- Establish control charts for pick time, pack time and lead time.
- Complete the financial validation and Break-Even Analysis.
- Document standard work and escalation responsibilities.
- Create a quarterly VSM refresh cycle.
- Train additional Yellow Belts and Green Belts to sustain local improvements.
Targets:
- Lead time at or below 104 minutes.
- Blended pick rate at or above 132 lines per labour hour.
- Pick accuracy at or above 99.0%.
- Substitution rate at or below 6.0%.
- On-time in-full fulfilment at or above 97.0%.
- Cost per order at or below $6.95.
8. Building Capability Beyond the First Map
A successful VSM is not a one-time diagram. It is a management system for understanding how customer demand, process capability and operational decisions interact.
A White Belt can support basic process awareness, identify the eight wastes and participate in improvement discussions. A Yellow Belt can assist with data collection, standard work and focused Kaizen activities. A Green Belt can lead structured projects using DMAIC, statistical analysis and financial validation. A Black Belt leads complex cross-functional projects, mentors Green Belts and helps the organisation address systemic constraints.
For fulfilment leaders, certification transforms VSM from a workshop exercise into a repeatable capability. The Lean 6 Sigma Hub online training programmes are self-paced and focused on practical application, including tools, worked examples and end-to-end improvement methods. The Green Belt programme is particularly relevant for professionals responsible for data-driven improvement and project execution.
Start with the value stream, measure the real flow, and pursue Lean Six Sigma certification to lead improvements that deliver faster, more accurate and more economical fulfilment.
Kaizen. Kai-Care. Kai-Done. Lean Six Sigma