

1. Turn Dairy Flow into a Freshness Advantage
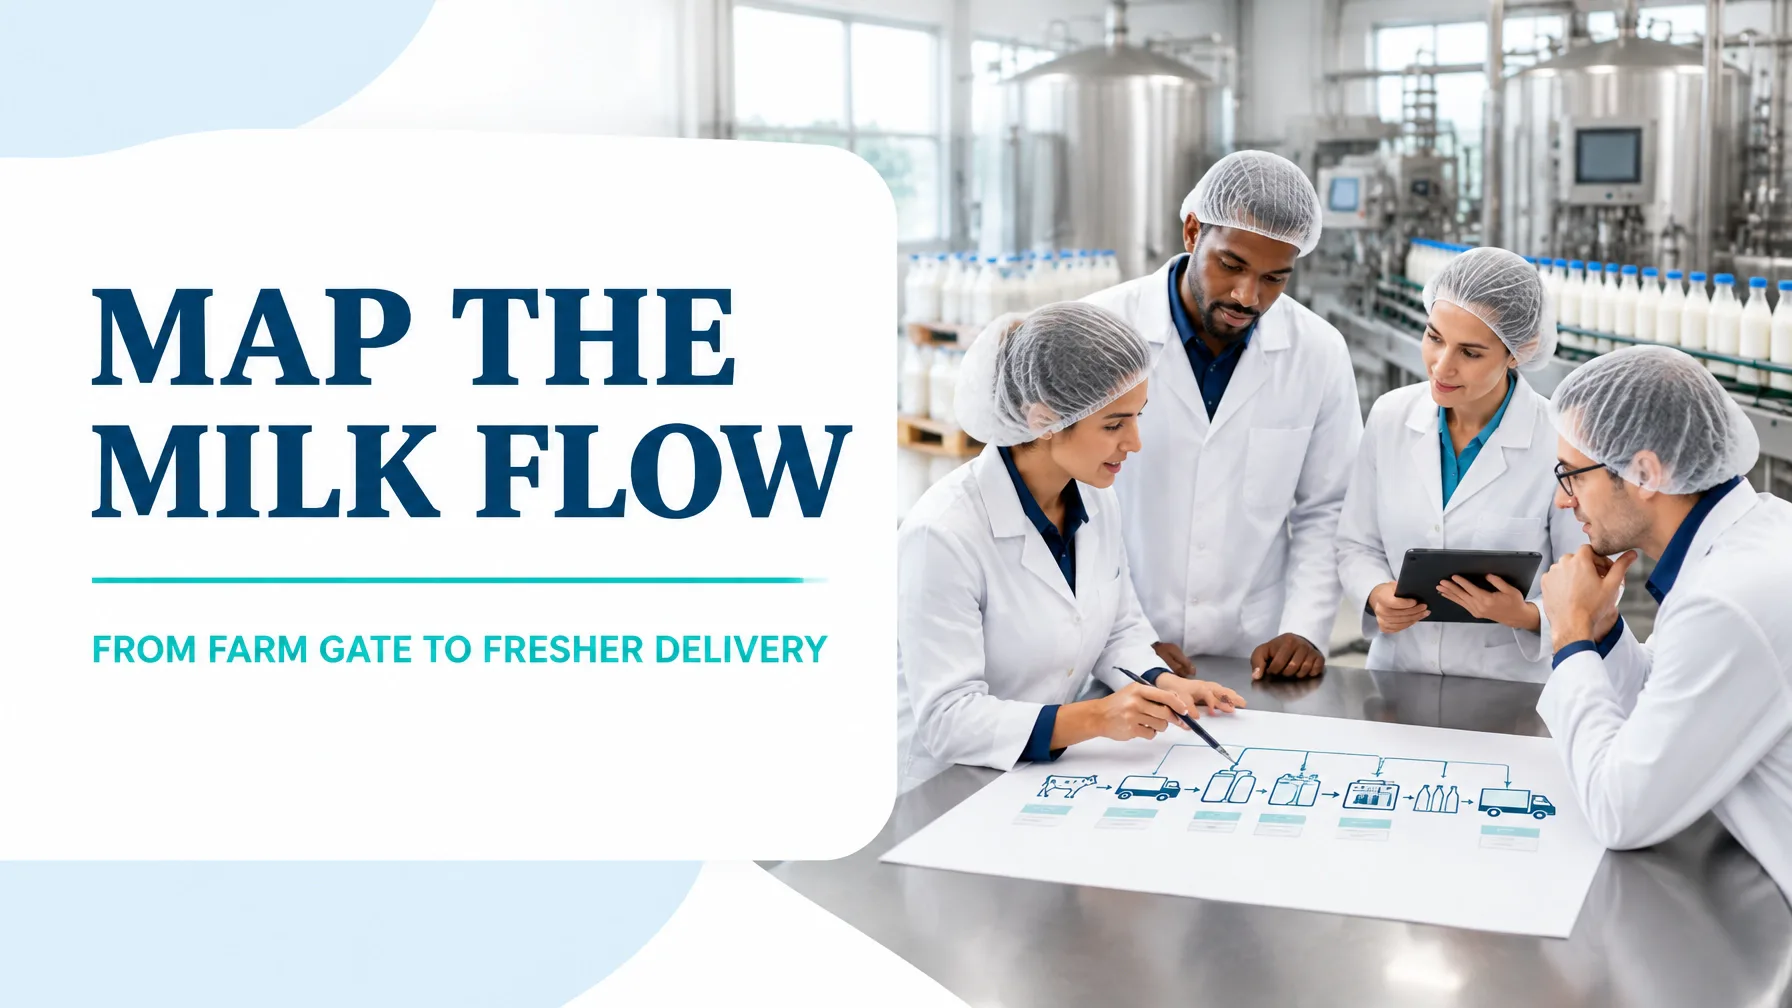
In the realm of dairy processing, value stream mapping makes the complete journey of milk visible: from farm collection and reception to pasteurisation, filling, cold storage and palletised dispatch.
The fundamental purpose is not simply to document process steps. It is to connect:
- Customer demand with production rhythm
- Processing time with total lead time
- Cold-chain delays with remaining shelf life
- Quality data with defect prevention
- Inventory levels with freshness and working capital
A bottle of fresh milk may require only minutes of direct processing, yet spend many hours waiting in tanks, queues, laboratories, packaging buffers or finished-goods storage. That gap is where a shelf-life leak develops.
The worked example below uses dummy data for a simulated dairy plant producing 2L fresh milk bottles. The approach reflects the practical logic used in published dairy value-stream studies, including research examining milk collection, processing, storage and supply-chain lead time.A dairy VSM research example
2. Select a Focused Product Family and Clear Boundaries
Product family: 2L fresh pasteurised milk
The selected product family is 2L refrigerated fresh milk because it represents a high-volume, repeatable flow with shared equipment and common customer requirements.
The map begins at:
Farm gate: milk collection released for tanker pickup
The map ends at:
Palletised finished product released for customer dispatch
The scope includes:
- Farm collection and tanker transport
- Milk reception, sampling and quality release
- Raw milk chilling and storage
- Standardisation and homogenisation
- Pasteurisation and cooling
- Bottle filling, capping, coding and labelling
- Case packing and palletising
- Finished-goods cold storage
- Dispatch planning and loading
The information flow should also be mapped. In this simulation, the customer order forecast is sent to production planning each afternoon, while laboratory release results control whether raw milk can move into processing. The production planner then schedules batches against demand, available tank capacity, changeover requirements and tanker arrivals.

3. Build the Current-State Map with Worked Numbers
The simulated plant operates two 8-hour shifts, with 960 net production minutes per day. Customer demand is 9,600 litres per day, equal to 4,800 bottles of 2L milk.
Takt time
[
\text{Takt Time}=\frac{\text{Available Production Time}}{\text{Customer Demand}}
]
[
\text{Takt Time}=\frac{960 \text{ minutes}}{4,800 \text{ bottles}}=0.20 \text{ minutes}
]
Therefore, the required production rhythm is:
12 seconds per 2L bottle
Current-state flow
Farm collection → reception and testing → raw milk tank → standardise and pasteurise → filling and coding → palletise → cold store → dispatch
| Process stage | Typical batch or unit | Cycle/process time | Waiting or queue time | Current observation |
|---|---|---|---|---|
| Farm collection and tanker arrival | 6,000L tanker | 36 min touch time | 7.6 hours | Fixed collection routes create uneven arrivals |
| Reception, sampling and release | 6,000L | 30 min | 5.4 hours | Laboratory release is performed in batches |
| Raw milk chilling and storage | 18,000L tank | 22 min transfer | 9.8 hours | Three-tanker buffer is common |
| Standardisation and pasteurisation | 6,000L batch | 72 min | 1.1 hours | Pasteuriser waits for a full batch |
| Packaging and coding | 2L bottles | 8.8 sec per bottle | 3.6 hours | Changeover averages 42 minutes |
| Case packing and palletising | 96 bottles per case | 18 min per pallet | 1.5 hours | Pallets wait for a dispatch sequence |
| Finished-goods cold storage | Pallet | 12 min handling | 17.2 hours | Product is often produced to forecast |
| Total | – | 3.4 hours processing | 43.2 hours waiting | 46.6 hours lead time |
Current operational measures are:
- Batch size: 6,000L
- Packaging changeover: 42 minutes
- Packaging uptime: 82%
- Overall Equipment Effectiveness (OEE): 68%
- Raw and finished WIP: 38,400L
- Packaging defect and leakage rate: 2.4%
- Total lead time: 46.6 hours
- Processing time: 3.4 hours
- Process Cycle Efficiency (PCE):
[
\text{PCE}=\frac{3.4}{46.6}\times100=7.3%
]
The Process Cycle Efficiency Calculator can support this type of baseline analysis. The key insight is clear: only a small proportion of elapsed time changes the product. The remaining time is dominated by queues, storage, release delays and scheduling gaps.
For a declared 12-day shelf life, 17.2 hours in finished-goods storage consumes approximately 6% of the available shelf life before dispatch. Reducing this delay improves freshness without changing the product specification.
4. Convert the Eight DOWNTIME Wastes into Improvement Targets
Defects
Typical defects include leaking caps, underfilled bottles, incorrect date codes, damaged labels and microbiological holds. In the simulation, 2.4% of packaged bottles require rework, downgrade or disposal.
Overproduction
Forecast-driven batches create finished milk before confirmed demand is available. The plant produces approximately 15% more than the next dispatch requirement on selected weekdays.
Waiting
Milk waits for tanker unloading, laboratory release, a full pasteurisation batch, packaging availability and dispatch sequencing. Waiting accounts for 43.2 hours of the 46.6-hour lead time.
Non-utilisation of talent
Operators identify recurring filler jams and cap-feed variation, yet the improvement team reviews these observations only during monthly meetings. A daily frontline review would convert practical knowledge into faster countermeasures.
Transportation
Milk travels between reception, raw tanks, processing and packaging areas with avoidable forklift and hose movements. The current layout requires approximately 420 metres of internal movement per batch.
Inventory
The combined raw, intermediate and finished-goods inventory is 38,400L, equivalent to four days of demand in selected parts of the flow. This increases handling, refrigeration demand and expiry exposure.
Motion
Operators walk to retrieve caps, labels, cleaning materials and quality forms. A time observation sheet records 26 minutes of avoidable movement per shift at the packaging cell.
Extra-processing
Duplicate data entry occurs when laboratory results are transferred from the quality system to a production spreadsheet. Additional manual checks are also performed after automated fill-volume verification.
5. Design a Future State that Protects Freshness

The future-state map should make demand the organising principle while preserving food safety, regulatory controls and cold-chain discipline.
Future-state countermeasures
- Create a supermarket pull signal between finished-goods cold storage and packaging. Replenishment is triggered by confirmed dispatch demand rather than a broad forecast.
- Reduce the packaging batch from 6,000L to 4,000L where validated by production and food-safety requirements.
- Apply SMED principles to reduce the 42-minute changeover. Prepare caps, labels, coding settings and cleaning materials externally before the line stops.
- Sequence laboratory testing with tanker arrival windows so samples are prioritised by production need and risk.
- Introduce standard work and 5S at reception and packaging to reduce searching, walking and variation between shifts.
- Install poka-yoke controls for cap presence, fill-volume deviation and date-code selection.
- Use an Andon signal at packaging to alert maintenance, quality and supervision in real time when leakage, coding or filler faults exceed control limits.
- Create a first-expiry, first-out dispatch rule supported by visible pallet locations and electronic ageing alerts.
- Use a daily tier meeting to review demand, WIP, OEE, leakage, laboratory release time and dispatch shelf life.
The future state is not a single large project. It is a linked system of smaller improvements that allow milk to move in smaller, more predictable increments.
6. Compare Current and Future Performance
The following figures represent a 90-day dummy simulation after countermeasures are validated and stabilised.
| Metric | Current state | Future state | Improvement |
|---|---|---|---|
| Total lead time | 46.6 hours | 25.4 hours | 45.5% reduction |
| Processing time | 3.4 hours | 3.1 hours | 8.8% reduction |
| Process Cycle Efficiency | 7.3% | 12.2% | 4.9 percentage-point gain |
| OEE | 68% | 80% | 12 percentage-point gain |
| Packaging changeover | 42 min | 24 min | 42.9% reduction |
| Raw and finished WIP | 38,400L | 18,000L | 53.1% reduction |
| Waste exposure as share of output | 6.8% | 3.1% | 3.7 percentage-point gain |
| Scrap, rework and leakage | 2.4% | 0.8% | 66.7% reduction |
| Finished-goods storage | 17.2 hours | 7.0 hours | 59.3% reduction |
Lead-time visualisation
Current state  |████████████████████████████████████████████| 46.6 h
Future state   |███████████████████████                       | 25.4 h
The future state releases product approximately 10.2 hours earlier from filling to dispatch, preserving more effective shelf life for wholesalers, retailers and consumers.
7. Sequence Kaizen Across 30, 60 and 90 Days

Days 1–30: Establish stable visibility
Owner: Continuous Improvement Lead
Supporting owners: Quality Manager, Production Supervisor and Laboratory Lead
Actions:
- Confirm the current-state map through floor observation.
- Measure tanker arrival variation, laboratory release time and packaging stoppages.
- Establish daily metrics for lead time, WIP, OEE and leakage.
- Apply 5S at the filler, cap storage and coding stations.
- Introduce a 15-minute daily tier meeting.
Targets:
- Map validation completed by Day 10
- Packaging movement reduced by 20%
- Baseline data completeness above 95%
- Daily leakage reporting at every shift handover
Days 31–60: Improve flow and changeover
Owner: Packaging Engineering Manager
Supporting owners: Maintenance Lead, Planner and Warehouse Manager
Actions:
- Run a SMED workshop on the 2L packaging changeover.
- Prepare external changeover kits for labels, caps and coding settings.
- Pilot 4,000L production batches on two high-volume days each week.
- Create a pull replenishment signal between packaging and cold storage.
- Introduce first-expiry, first-out pallet locations.
Targets:
- Changeover reduced to 30 minutes or less
- WIP reduced to 24,000L
- OEE increased to 75%
- Finished-goods storage reduced below 10 hours
Days 61–90: Control and scale the gains
Owner: Operations Manager
Supporting owners: Quality Manager, Supply Chain Manager and Lean Six Sigma Black Belt
Actions:
- Validate the Andon response standard for packaging and quality events.
- Complete a capability review for fill volume and cap-seal performance.
- Update the control plan and standard work instructions.
- Conduct a weekly shelf-life-at-dispatch review.
- Extend the future-state method to the 1L and flavoured-milk product families.
Targets:
- OEE sustained at 80% or higher
- Leakage and rework below 0.8%
- Lead time below 26 hours
- Dispatch with at least 11.5 days of declared shelf life remaining
- PCE maintained above 12%
Build the Capability to Lead Value Stream Improvements
A successful dairy value stream mapping project requires more than a diagram. It requires the ability to define customer value, collect reliable data, analyse variation, test countermeasures and sustain measurable gains.
Lean 6 Sigma Hub provides CSSC-accredited, self-paced online training from White Belt through Master Black Belt. The courses use practical case studies, worked examples, process data, templates and DMAIC-based project application.
- Explore Lean Six Sigma Online Training
- Start with White Belt
- Develop project leadership with Green Belt
- Build advanced leadership capability with Black Belt
- Advance toward Master Black Belt
Enrol in CSSC-accredited self-paced Lean Six Sigma training today and build the capability to map, improve and control value streams that deliver fresher products and stronger operational performance.
Kaizen. Kai-Care. Kai-Done. Lean Six Sigma





