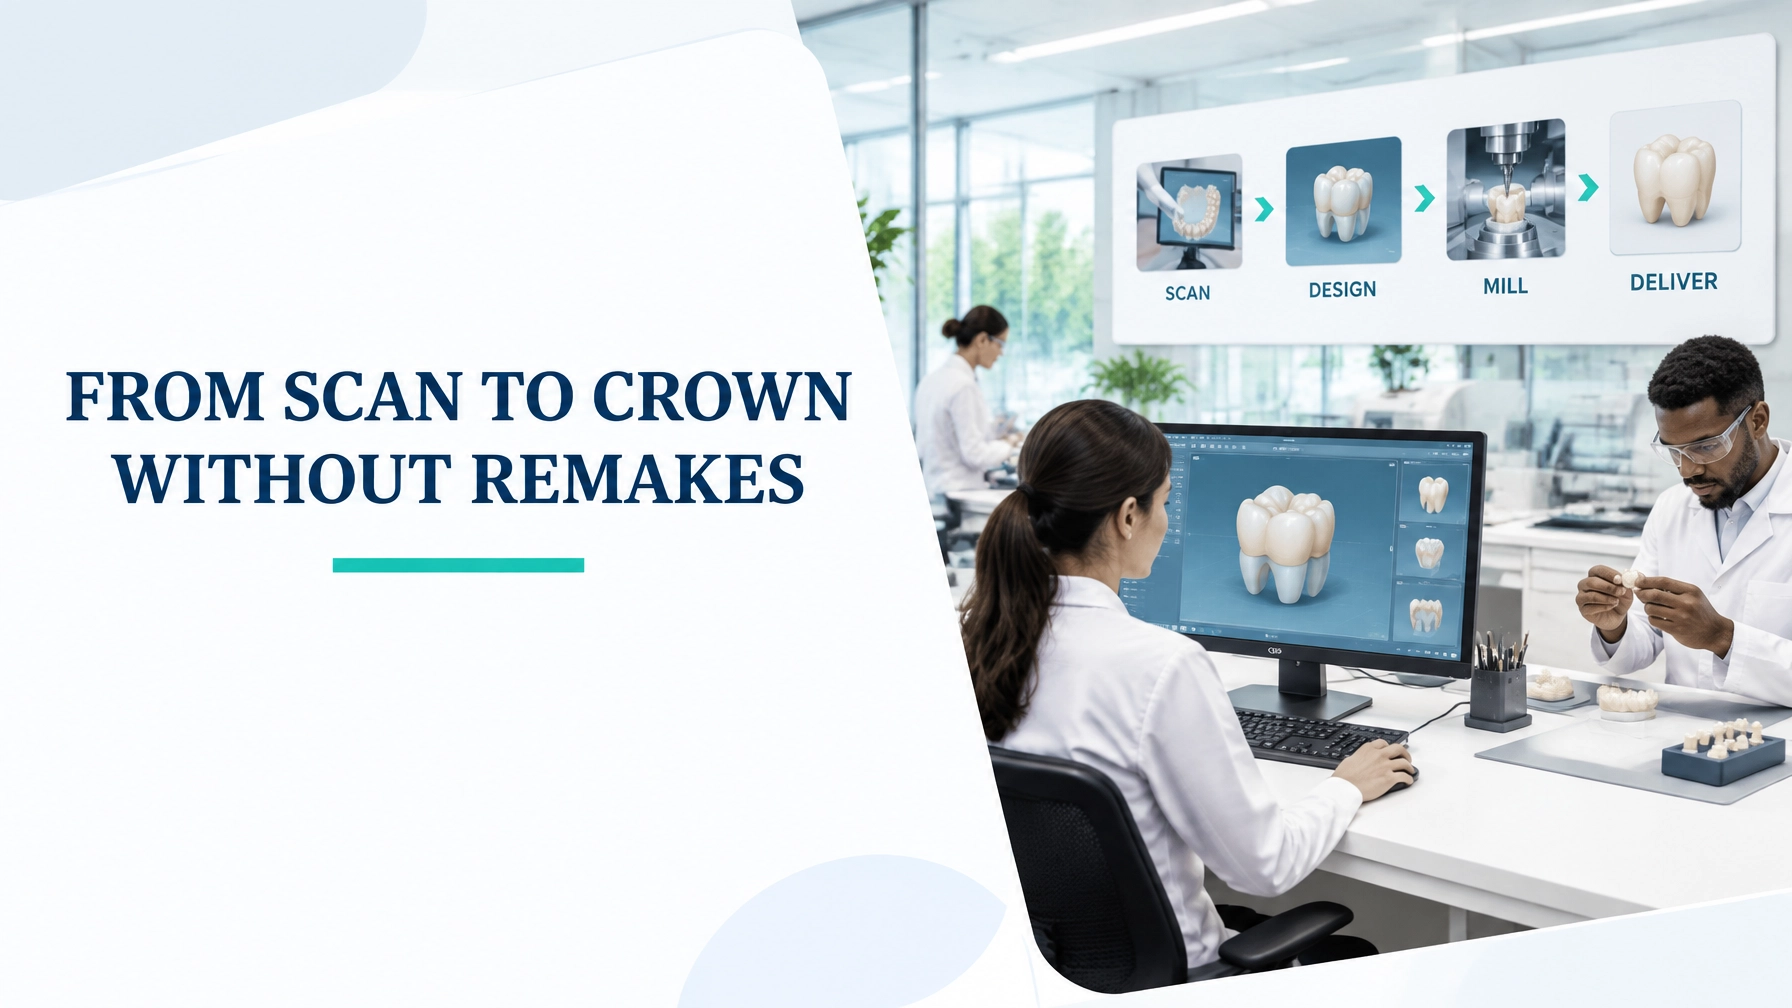
In dental laboratory fabrication, a crown can be technically excellent and still arrive late, require extensive adjustment, or return as a remake. The underlying issue is often not one isolated task. It is the performance of the entire value stream: clinical scanning, prescription submission, case intake, CAD design, CAM production, finishing, quality control, shipping, and clinical delivery.
Value Stream Mapping (VSM) makes that end-to-end system visible. It shows how material, digital information, decisions, and customer value move from an accepted impression scan to a successfully delivered crown.
For a dental laboratory, the customer outcome is not merely “a crown shipped.” Value is a restoration that meets fit, function, shade, quality, delivery, and patient expectations the first time.
The Lean Enterprise Institute defines VSM as the mapping of the material and information flows required to bring a product from order to delivery. That principle applies directly to digital dentistry, where connected scan, CAD, and CAM workflows can improve coordination: but only when the process is designed to flow.
1. Select the Right Dental Laboratory Scope
A useful map begins with a focused product family. Do not start by mapping every crown, bridge, implant, denture, and orthodontic appliance simultaneously.
For this worked example, select:
- Product family: Single-unit posterior zirconia crowns
- Start point: Digital impression scan and prescription submitted by the clinic
- End point: Crown successfully delivered and accepted clinically
- Included: Lab QC failures, clinical adjustments, remakes, and information delays
- Excluded: Patient preparation and clinical treatment before scan capture
Include a cross-functional team comprising:
- Dentist or clinical representative
- Dental assistant or scanning operator
- Case intake coordinator
- CAD designer
- CAM or milling technician
- Finishing and ceramic technician
- Quality representative
- Improvement lead
Review at least 20 working days of actual cases. Use de-identified data and observe the real process rather than relying only on standard operating procedures.
Capture the Voice of the Customer: fit, shade, delivery reliability, and minimal chairside adjustment: and the Voice of the Process through cycle time, queue time, defects, yield, and variation.
2. Build the Current-State Map
Place information flow above the process boxes and physical or digital case flow below them. Use data boxes for cycle time, first-pass yield, queue size, batch rules, and ownership.
A typical current-state workflow is:
- Receive scan and prescription
- Verify patient, tooth, material, shade, and due date
- Clarify missing or conflicting information
- Design crown in CAD
- Review or approve design
- Nest and mill or print
- Sinter, finish, stain, glaze, or polish
- Perform laboratory quality control
- Pack and dispatch
- Clinical try-in and delivery
- Return to remake loop when fit, contact, occlusion, shade, or structural quality fails
The map should show whether work is pushed from one department to the next in batches or pulled according to downstream capacity. It should also show where approvals, emails, portal notifications, and verbal clarifications interrupt flow.

3. Worked Example: Quantifying the Remake Loop
Assume a laboratory processes 28 single-unit crowns per day with 450 available production minutes.
Takt time
[
\text{Takt Time} = \frac{450\text{ available minutes}}{28\text{ crowns}} = 16.1\text{ minutes per crown}
]
Takt time establishes the required production rhythm. It does not mean every activity must take 16.1 minutes; it indicates the rate at which completed crowns are required to meet demand.
The current-state observations are:
| Process step | Cycle time | Average queue | First-pass yield |
|---|---|---|---|
| Intake and verification | 8 min | 4.0 hr | 92% |
| CAD design | 24 min | 6.5 hr | 95% |
| CAM milling | 18 min | 3.0 hr | 98% |
| Finishing and characterisation | 32 min | 5.0 hr | 93% |
| QC and packing | 10 min | 2.0 hr | 96% |
| Dispatch and clinic scheduling | : | 15.5 hr | : |
Total touch time is:
[
8 + 24 + 18 + 32 + 10 = 92\text{ minutes}
]
That is only 1.53 hours of direct processing against approximately 37.5 hours of elapsed lead time on a successful first-pass case.
The end-to-end first-pass rate is approximately:
[
0.92 \times 0.95 \times 0.98 \times 0.93 \times 0.96 = 76.5%
]
The laboratory also records a 14% remake rate. Remakes add an average of 26 hours because the case must be diagnosed, redesigned or rescanned, refabricated, inspected, and rescheduled clinically.
This is the central VSM insight: the largest opportunity may not be faster milling. It may be preventing the information and quality failures that cause the case to re-enter the stream.
4. Identify the Eight DOWNTIME Wastes
Use the eight Lean wastes: often remembered as DOWNTIME: to examine every handoff.
- Defects: Open contacts, poor margins, high occlusion, shade mismatch, fractured ceramic, incomplete scans, and incorrect material selections.
- Overproduction: Designing or milling crowns far ahead of confirmed clinical demand.
- Waiting: Cases queued for CAD, approval, machine availability, QC review, courier collection, or clinical scheduling.
- Non-utilised talent: Experienced technicians spending time searching for files, correcting incomplete prescriptions, or performing avoidable administration.
- Transportation: Physical models, crowns, trays, or paperwork moving repeatedly between work areas.
- Inventory: Excess work in process between CAD, CAM, finishing, and QC.
- Motion: Technicians searching for scan files, shade references, tools, materials, or software libraries.
- Extra-processing: Duplicate data entry, repeated file exports, unnecessary polishing, or multiple approval steps that do not improve the restoration.
A useful analysis treats remake rate as the outcome Y in the relationship Y = f(x). The critical inputs may include scan completeness, prescription accuracy, margin-marking rules, CAD library selection, milling parameters, and QC criteria.
During the Analyse Phase of DMAIC, use a Pareto chart to rank remake causes. Box plots can reveal variation in lead time or design duration, while ANOVA can test whether average remake performance differs significantly among scanners, designers, materials, or clinics.
5. Design the Future-State Flow
The future-state map should reduce both waste and variation. The objective is not simply to make each department busy. It is to improve the complete value stream.
Design changes may include:
-
Create a digital intake gate
Make tooth number, material, shade, due date, opposing arch, bite scan, preparation images, and clinical instructions mandatory before release to CAD. -
Standardise scan and prescription work
Use a structured checklist and clear acceptance criteria. Cases that fail the input check should be returned immediately for clarification rather than entering the CAD queue. -
Introduce a pull-based CAD-to-CAM flow
Set a visible work-in-process limit, such as 12 active crowns in CAD and 8 crowns awaiting CAM. Release new work when downstream capacity is available. -
Establish standard work for design and QC
Define margin, contact, occlusion, anatomy, and material-specific requirements. Use a common pass/fail checklist and consistent remake codes. -
Move toward a focused CAD-CAM cell
Where practical, position related activities, information, and support close together. Use FIFO sequencing for standard cases and a defined escalation rule for genuine clinical priorities. -
Create a closed-loop feedback system
Record the exact point of origin for every remake: scan, prescription, CAD, CAM, finishing, QC, shipping, or clinical fit. Review the top causes weekly.

6. Current State Versus Future State
The following targets are illustrative and should be validated through a pilot.
| Metric | Current state | Future-state target |
|---|---|---|
| Average lead time to successful delivery | 37.5 hr | 15.9 hr |
| Direct touch time | 92 min | 82 min |
| Total remake rate | 14% | 5% |
| End-to-end first-pass rate | 76.5% | 92.3% |
| Intake clarification rate | 18% | 5% |
| CAD work-in-process | 26 cases | 12 cases |
| Average dispatch and clinic scheduling delay | 15.5 hr | 8.0 hr |
| On-time delivery | 81% | 95% |
The future state does not depend on eliminating every batch or every approval. It uses controlled flow where possible and deliberate buffers where necessary. Approval remains an important governance checkpoint, particularly for complex prosthetics, but unclear approval ownership can create bottlenecks. Define who approves, what criteria apply, and the maximum response time.
7. Sequence the Kaizen Work
Do not implement every improvement at once. Sequence the work so that each change stabilises the next.
Kaizen 1: Stabilise the input
Launch the mandatory prescription and scan-quality checklist. Measure incomplete submissions, clarification time, and rejected scans.
Kaizen 2: Reduce queue and WIP
Set CAD and CAM WIP limits, introduce FIFO lanes, and create a visual board showing case status, due date, owner, and blocker.
Kaizen 3: Improve quality at source
Standardise CAD design rules, machine parameters, finishing instructions, and QC checks. Train Yellow Belts and technicians to identify abnormal conditions early.
Kaizen 4: Create a remake feedback loop
Use a simple defect taxonomy and review the Pareto ranking every week. Select one dominant cause for a focused DMAIC investigation.
Kaizen 5: Control the gains
Track remake rate, first-pass yield, lead time, on-time delivery, and queue size using trend charts or control charts. Confirm that the improvement remains stable across different designers, scanners, materials, and clinics.
A Black Belt may lead a larger cross-functional project, while Yellow Belts and experienced technicians support data collection, standard work, and daily problem-solving.
Turn Dental Laboratory Flow into a Competitive Capability
Value Stream Mapping helps dental laboratories see beyond isolated cycle times. It connects customer requirements with process performance, digital information flow, WIP, waiting, throughput, variation, and quality.
When a laboratory can move from accepted scan to reliable crown delivery without an avoidable remake loop, it improves patient experience, clinic trust, technician capacity, and financial performance simultaneously.
Build the capability to lead this kind of improvement through Lean Six Sigma training and CSSC-accredited certification. Explore the Lean 6 Sigma Hub training pathway and strengthen your practical knowledge with the Lean Six Sigma Practitioner Guide.
Kaizen. Kai-Care. Kai-Done. ( Lean Six Sigma)