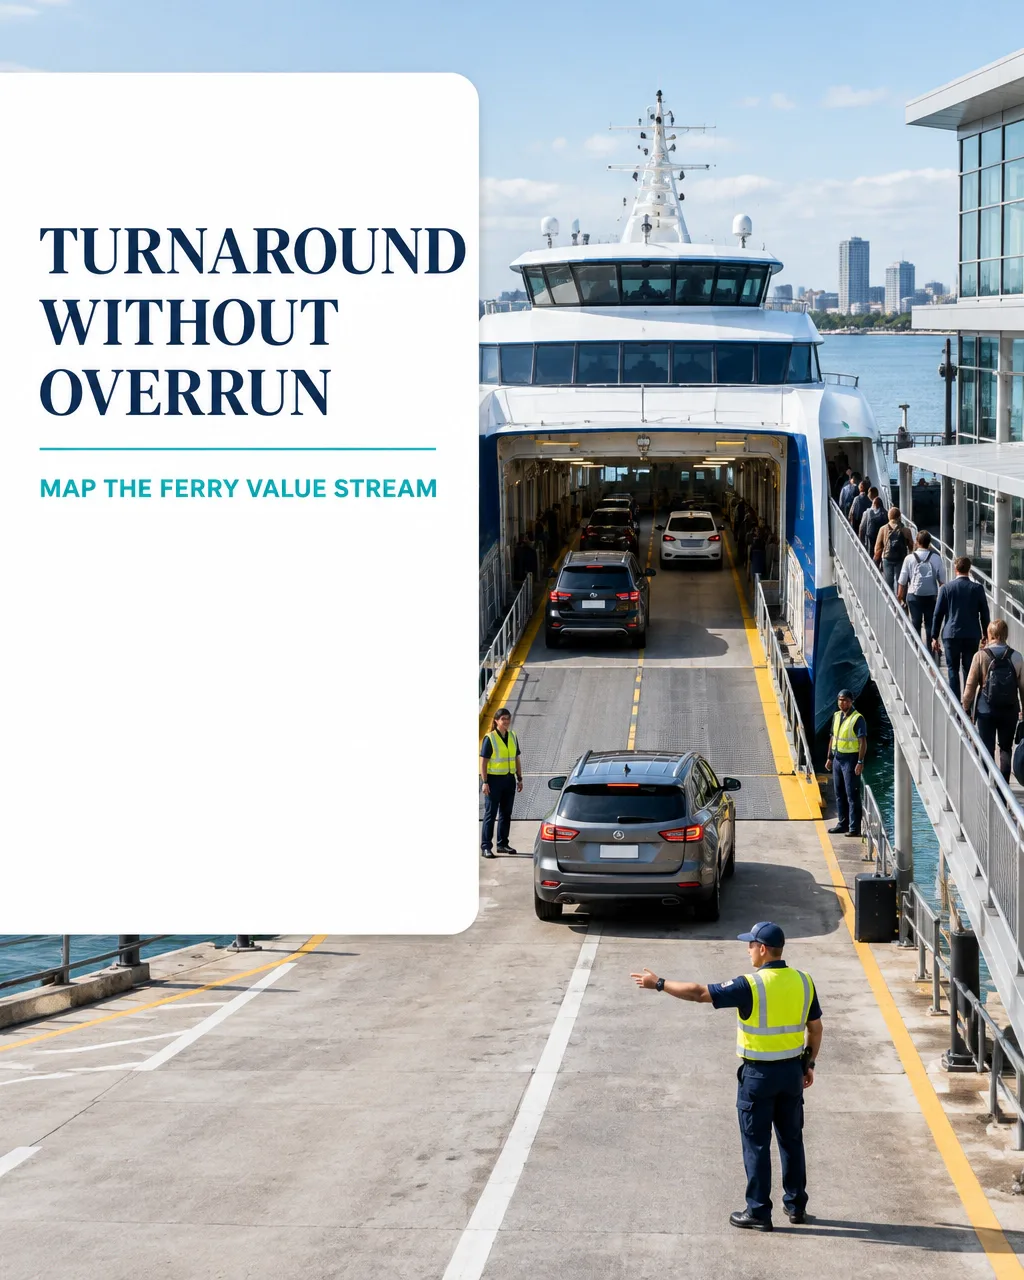
A ferry route is a repeating turnaround value stream: passengers and vehicles arrive, board, travel, disembark, and the vessel prepares to do it again. Performance is measured in minutes per crossing, but a small delay at one berth can ripple through the next departures, crew handovers and connections. On a route with 22 crossings a day, a five-minute overrun on every sailing represents 110 minutes of cumulative schedule pressure.
Value Stream Mapping (VSM) makes that flow visible from the customer’s first queue to their completed journey. It distinguishes necessary work, such as safety checks, from avoidable waiting, rehandling and unclear handoffs. For context, a National Academies ferry operations guide identifies vehicle loading and unloading as a major component of dwell time and discusses upstream fare collection, reservations and multiple-lane operations as potential improvement levers. Read its vehicle ferry capacity guidance.
Worked example: Every route-specific figure below is invented for illustration, not a published operator benchmark. Validate any target against the vessel’s approved procedures, applicable regulation, berth constraints and observed operating data.

1. Select a clear route and vessel scope
Map one commuter route and one vessel class first: an illustrative catamaran carrying up to 1,400 passengers and 120 vehicles, making 22 one-way crossings per day. The scope begins when the vessel is secured at the berth and ends at departure release for its next crossing. It includes the terminal, vessel, passenger, vehicle and control activities that determine that turnaround.
Keeping one route and class in scope helps separate process effects from differences in vessel design, terminal layout and sailing conditions. A regional island service can be a useful secondary reference, but should be mapped separately: longer distances, weather exposure, freight mix and fewer daily sailings can change both the critical constraints and improvement priorities.
For this example, the service has a 16-hour operating window. Its takt time, available operating minutes divided by daily departure demand, is:
960 minutes ÷ 22 departures = 43.6 minutes per departure.
With a 21-minute crossing and a 14-minute scheduled turnaround, the planned cycle uses 35 minutes, leaving 8.6 minutes of schedule margin. That margin is not permission to reduce safety controls; it is capacity to absorb normal variation.
2. Walk through the current-state map
Observe complete sailings across peak and off-peak periods. Timestamp each handoff and record passenger counts, vehicle count and type, ramp cycle, scan throughput, staffing, safety holds, cleaning, stores, fuel and water activity. For this example, the 19-minute current-state process time is the elapsed berth-to-departure turnaround, excluding the 21-minute transit.
| Current-state activity | Elapsed minutes | Complete & accurate (C&A) |
|---|---|---|
| Bridge and mooring release to secure berth; ramp landing | 1 | 98% |
| Disembark passengers and unload vehicles | 3 | 96% |
| Cleaning, stores turn, fuel and water top-up | 2 | 88% |
| Pre-departure checks and readiness confirmation | 1 | 94% |
| Vehicle marshalling and loading | 4 | 90% |
| Passenger ticketing and boarding | 6 | 92% |
| Ramp and door close; final confirmation | 1 | 97% |
| Departure clearance and bridge release | 1 | 95% |
| Total turnaround | 19 | – |
C&A means that the step completed without an exception requiring correction, clarification or repeat work, based on the illustrative observation set. Real operators should define it precisely and use consistent sampling.
The six-minute boarding step processes about 450 people at an aggregate scan rate of 75 passengers per minute. Vehicle occupancy averages 102 of 120 spaces, or 85% load factor. The schedule target is 14 minutes, so the current turnaround runs five minutes over target. In the model, on-time departures are 72%, overtime totals 96 crew-hours a month, and turnaround-related cancellations account for 420 scheduled service minutes monthly.
The wider customer journey has a different clock from vessel process time. In this illustrative round trip, two 21-minute crossings, two six-minute boarding periods, two 20-minute pre-boarding waits, a 44-minute destination stay and six minutes to exit total 144 minutes, or 2.4 hours. This makes the distinction clear: 19 minutes is the current turnaround process; 2.4 hours is an example of end-to-end customer lead time for a round trip.
The map should show the full sequence: checks, marshalling and loading; ticketing and boarding; ramp and door close; bridge release and harbour transit; berthing and ramp landing; unloading; cleaning and stores; fuel and water top-up; and the next boarding. Where tasks overlap, use swim lanes to show who is working and where the true elapsed-time constraint sits.
Spot ferry-specific DOWNTIME waste
Use the eight-waste framework to turn observations into testable improvement questions:
- Defects: ticketing exceptions, passenger-count mismatches and manual reconciliation.
- Overproduction: repeated cleaning passes without a defined standard or confirmed need.
- Waiting: late vehicles, delayed passenger counts or a crew waiting for release instructions.
- Non-utilised talent: experienced deck and terminal staff whose improvement ideas are not captured.
- Transportation: unnecessary movement of stores, equipment or information between terminal and vessel.
- Inventory: uncollected stores or supplies staged too early and left in the way.
- Motion: passengers and crew crossing the deck or walking between poorly positioned equipment.
- Extra-processing: duplicate checks or repeated entry of information already captured elsewhere.
Classify each step as customer-value-adding, necessary non-value-adding (such as required safety controls), or avoidable waste. Safety and approved operating requirements are fixed constraints, not waste to remove. UK Maritime and Coastguard Agency guidance, for example, addresses trained supervision, controlled vehicle movement and pedestrian segregation; operators must follow the rules that apply to their own jurisdiction and vessel. See the Ro-Ro vehicle stowage and securing guidance.

3. Build a practical future state
Design the future state around standard work per turnaround minute, with safe parallel activities and clear completion criteria:
- Separate marshalling into two lanes by vehicle type or sailing assignment, using advance booking information where available.
- Prepare passenger gates to the sailing rhythm and coordinate ticketing so exceptions are identified before the boarding peak.
- Use parallel cleaning zones with a defined clean-to-standard check, while stores and service tasks proceed only where authorized and safely compatible.
- Stage stores on pre-loaded trolleys with a verified manifest to reduce searching and repeated handling.
- Send a live passenger count feed to the bridge, with an assigned owner and reconciliation rule.
- Standardize handoffs and timestamps, including ramp cycle, last passenger and vehicle aboard, doors closed, checks complete and departure release.
The target is a 14-minute median turnaround, not a blanket instruction to accelerate every activity. Pilot changes with vessel masters, safety representatives, terminal teams and crew; confirm that staffing, access, vessel stability, maintenance and procedures remain suitable.

4. Compare the current and future state
The figures below are illustrative targets for a pilot, not guaranteed results. Fuel savings in particular should be verified against comparable crossings and operating conditions.
| Measure | Current state | Future-state target |
|---|---|---|
| Median turnaround | 19 min | 14 min |
| Berth-to-departure dwell | 19 min | 14 min |
| On-time departures | 72% | 90% |
| Boarding time per 100 passengers | 1.33 min | 0.83 min |
| Aggregate boarding scan rate | 75 passengers/min | 120 passengers/min |
| Vehicle load factor | 85% (102/120) | 92% (110/120) |
| Crew overtime | 96 hours/month | 38 hours/month |
| Fuel burn per crossing | 210 L | 202 L, subject to validation |
| Cleaning cycle time | 8 min | 5 min |
| Turnaround-related cancellation minutes/month | 420 min | 140 min |
The target boarding rate equates to 120 passengers per minute across the gates; it is a planning assumption to test with actual gate configuration, passenger mix and accessibility needs. Similarly, a higher vehicle load factor is useful only when demand, stowage plans and vessel limits support it.
5. Sequence the first 90 days of Kaizen
Days 1–30, Baseline and standardise: Map at least 100 sailings across different conditions. Agree on event timestamps, C&A definitions and safety-critical steps. Stratify delays by passenger volume, vehicle mix, shift, weather and berth; use Pareto analysis to select the largest controllable loss.
Days 31–60, Pilot and balance: Test two-lane marshalling, staged stores, parallel cleaning and gate timing on a defined set of sailings. Compare median and 90th-percentile turnaround, not averages alone. Review safety observations and customer impact alongside speed.
Days 61–90, Sustain and scale: Revise standard work from pilot evidence, train staff across shifts, establish daily visual management and audit adherence. Expand only when performance is stable and safety, accessibility and service quality are maintained.
For support in structuring a process map and improvement project, see Lean Six Sigma Hub’s process-mapping guide.
Build the capability behind the improvement
A reliable ferry turnaround depends on more than a faster ramp: it requires disciplined measurement, root-cause analysis, cross-functional problem solving and control. Build those skills through Lean Six Sigma Hub’s self-paced online White Belt to Black Belt certification paths, accredited by the Council for Six Sigma Certification (CSSC). Courses include practical learning through real-world simulations and end-to-end DMAIC case studies. Start with White Belt, develop project leadership through Green Belt, or prepare to lead complex improvement work with Black Belt.
Choose your Lean Six Sigma certification path and build the capability to improve your own value stream.
Kaizen. Kai-Care. Kai-Done. Lean Six Sigma