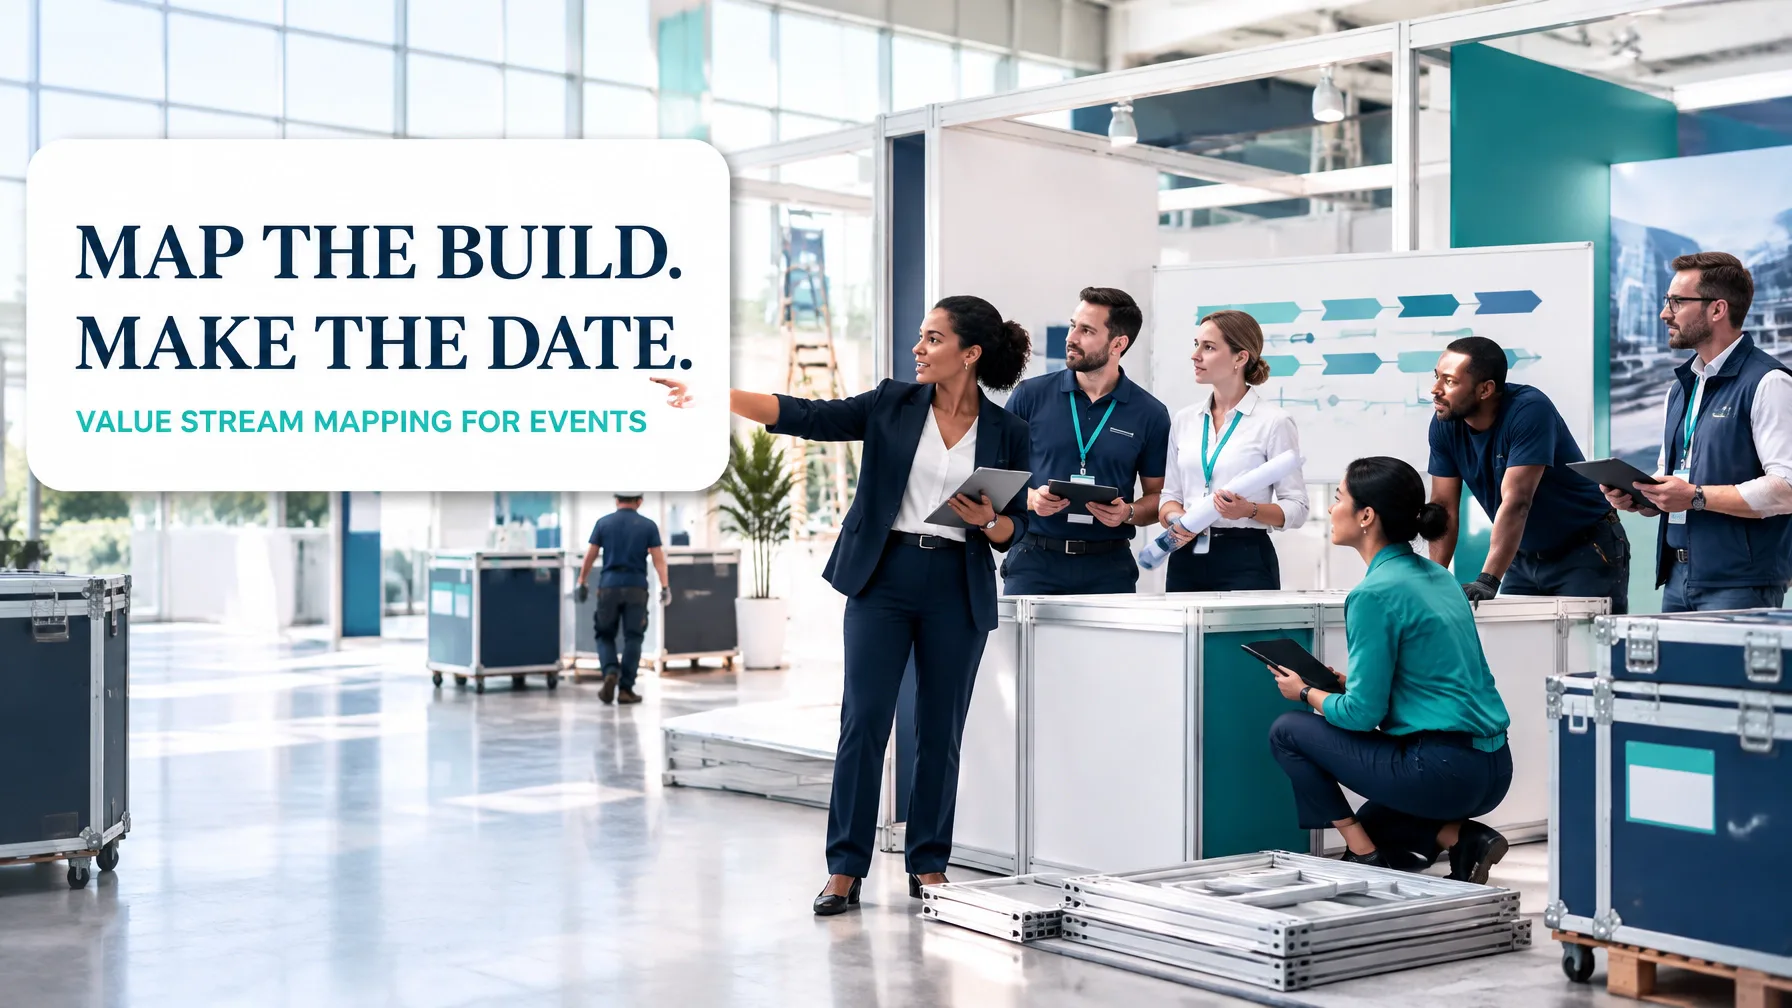
In event production, the deadline is fixed: the doors open when the venue schedule says they do. That makes an exhibition stand build a project-shaped value stream: a series of connected design, approval, production and site activities that must deliver customer value by an immovable date.
When work is pushed forward before decisions are ready, delays accumulate in approvals, fabrication queues and venue logistics. Pull and levelling help teams release work when its next step is ready and balance demand across available capacity. Value Stream Mapping (VSM) makes the full flow visible, from the initial brief to bump-out and return to store.
The example below follows a fictional mid-size events agency producing about 40 exhibition stands a year. Its typical stand is 42 m². All figures are illustrative planning assumptions, not industry benchmarks, and should be replaced with the agency’s measured data.
Choose a manageable value stream
Start with one repeatable product family: exhibition stand builds, covering design, fabrication, installation and bump-out. This scope is broad enough to capture cross-functional delays, but focused enough to map and improve without combining unrelated conference production workflows.
Define the start as an accepted client brief and the primary customer-value endpoint as a safe, compliant stand handed over before show opening. Include bump-out and return-to-store as the closeout tail so reusable assets and reverse logistics remain visible.
The ASQ value stream mapping overview recommends documenting the actual current state before designing improvements. Assemble agency, design, account, production, warehouse, freight and installation representatives, then verify each hand-off with the people doing the work.
Walk through the current state
For this fictional agency, brief-to-show-open lead time is approximately 38 calendar days. The post-show bump-out and return to store usually adds a further two calendar days. Across the complete stream, active process time is about 46 hours; this is elapsed work time, not total crew labour-hours. For example, a six-person crew working an eight-hour shift uses 48 labour-hours.
| Current-state step | Typical elapsed time | Active process time | Complete & accurate at hand-off |
|---|---|---|---|
| Client brief and site survey | 2 days | 1 hour | 90% |
| Concept and 3D design | 5 days | 26 hours | 88% |
| Client approval rounds | 9 days | 2 hours of coordination | 72% |
| Quoting | 2 days | 1 hour | 95% |
| Fabrication drawings | 3 days | 2 hours | 85% |
| Joinery and print production | 11 working days | 4 hours of active touch time | 92% |
| Transport planning and bump-in preparation | 1 day | 1 hour | 90% |
| On-site build | 1 day | 5 hours of active sequence time | 88% |
| Bump-out and return to store | 2 days after show | 4 hours | 95% |
The three approval loops add about nine calendar days. Late changes create an estimated 24 hours of rework across design (12 hours), drawings (4 hours) and production (8 hours). Although fabrication occupies 11 working days on the calendar, that elapsed time includes queues and non-touch intervals; it is not 11 days of continuous hands-on work.
During bump-in, a six-person crew has a 16-hour venue access window to complete the stand and resolve checks before handover. In this scenario, the truck is typically 62% utilised. If a late handover carries an assumed contractual exposure of $4,000 per stand, an 82% on-time rate across 40 builds implies roughly seven late handovers, or around $28,000 of annual exposure. Validate actual penalties and rates against contracts and records.

Find the eight wastes with DOWNTIME
Use DOWNTIME to classify what obstructs flow:
- Defects: print colour or dimensions are wrong; joinery needs rework.
- Overproduction: speculative concepts or graphics are produced before scope is stable.
- Waiting: work pauses for client sign-off, venue access or a confirmed dock slot.
- Non-utilised talent: skilled installers wait for information or search for missing kit.
- Transportation: stands and components make avoidable moves between suppliers, storage and venue.
- Inventory: reusable modules sit idle between shows, or excess materials are staged without a confirmed need.
- Motion: crews walk between sites, storage areas or scattered components to find what they need.
- Extra-processing: designers repeat revisions, redraw details or re-enter information already held elsewhere.
These examples are prompts for observation, not conclusions. Confirm waste and its causes at the worksite using timestamps, interviews and process data.
Design a future state around pull and readiness
The future state should make the next action clear and release work only when its inputs are ready. This aligns with the Lean Enterprise Institute’s explanation of pull production: downstream demand signals what should be produced, when and in what quantity.
- Set approval gates and response windows. Use a single digital brief, named client decision-makers and agreed response times. For example, allow two business days for a proof review; escalate overdue decisions rather than silently letting work age in a queue. Make scope changes visible with an impact on cost and schedule.
- Configure from a reusable modular kit. Standardise frames, connectors, counters and lighting interfaces. Reserve components when a design reaches the appropriate approval gate, then kit and label them for each stand.
- Use digital mock sign-off. Approve artwork, dimensions and key views in one version-controlled location before release to production. This reduces ambiguity between design, print and fabrication.
- Level the fabrication calendar. Plan releases against designer, production and installer capacity across the 40-stand annual portfolio. Avoid launching multiple jobs into the same constrained resource at once.
- Standardise bump-in work. Create a kit checklist, build sequence, role allocation, equipment list and handover check. Use the 16-hour venue window to set a takt-style sequence: divide available build time by the required work packages and schedule each package to a clear target.
- Pull transport and installation kits to readiness. Confirm venue slots, route, vehicle and complete kit before dispatch. Track status by stand and zone so freight, crew and materials arrive in the required sequence.

Compare the baseline with the target
These future-state values are pilot targets, not guaranteed outcomes. Track the same definitions before and after implementation.
| Measure | Current state | Future-state pilot target |
|---|---|---|
| Brief-to-show-open lead time | 38 calendar days | 25 calendar days |
| Active process time, including bump-out | 46 hours | 40 hours |
| Client approval rounds | 3 | 1.5 average |
| Late-change rework | 24 hours | 8 hours |
| On-site build time | 8 hours typical | 6 hours |
| Cost per square metre | $1,650 | $1,450 |
| On-time handover rate | 82% | 96% |
| Reusable module share | 35% | 70% |
Measure cost per square metre consistently, including or excluding the same design, freight and labour items in both periods. For related methods, see our guides to detailed process mapping and the Lean Six Sigma project storyboard toolkit.
Sequence the kaizen work across 90 days
Days 1–30: Establish the baseline. Map two or three recent stands from brief through return-to-store. Record actual approval timestamps, rework hours, truck utilisation, build time, handover performance and module reuse. Confirm the 24-hour rework estimate and agree metric definitions with process owners.
Days 31–60: Pilot the future state. Select one stand family and trial approval gates, a digital mock sign-off, modular kitting and standard bump-in work. Review readiness daily during production and capture deviations without disrupting safety or venue requirements.
Days 61–90: Improve, standardise and scale. Compare pilot results with the baseline. Adjust the kit, response windows and capacity plan based on evidence. Document standard work, assign owners to the measures and extend the approach to another stand type only when the pilot is stable.
The fundamental purpose of VSM is not to make a map look efficient; it is to improve how value moves to the customer. In event production, that means a complete, compliant stand ready for opening, and a managed route for every reusable component after the show.
Build your process-improvement capability with Lean Six Sigma Hub’s self-paced online courses. Learn through practical simulations and an end-to-end DMAIC case study, with training accredited by CSSC. Explore our Lean Six Sigma Green Belt course and pursue the certification that will help you lead measurable improvement in your organisation.
Kaizen. Kai-Care. Kai-Done. Lean Six Sigma